
Full report of the final project can be found here: https://479stlouis.home.blog/
This post is just a summary of the report.
For the final project, my partners, Daniel and Anthony, and I explored the spatial patterns of violent crime cases in St. Louis City. We analyze these crime patterns using several spatial analysis methods such as:
- Kernel Density;
- Hotspot Analysis;
- Space-time Analysis for Hotspots;
- Grouping Analysis;
- and Geographically Weighted Regression
Specifically, the goal of our project seeks to locate the most dangerous areas of the city. In order to aid our analysis, we looked into several social and environmental variables. For example, we gathered public school and bar data as our environmental variables along with social variables such as population, poverty rate, and median household income.
Results:
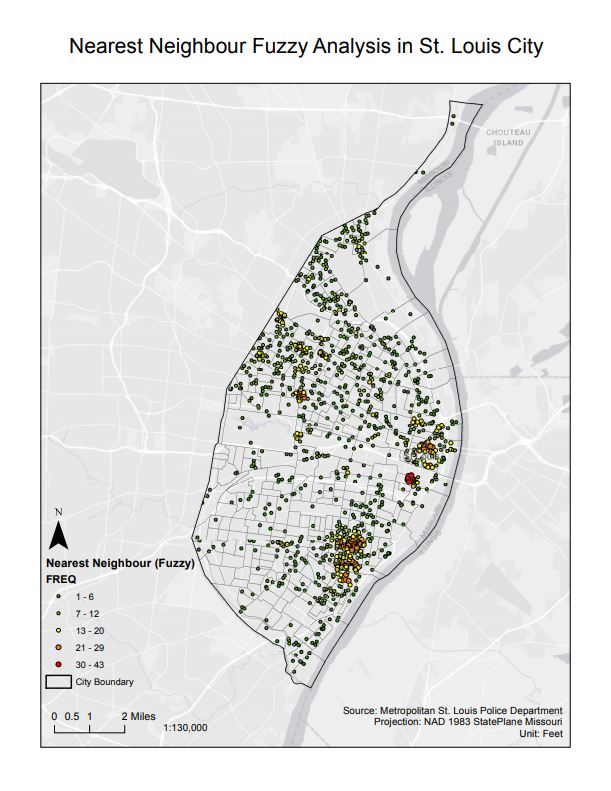
The nearest neighbor fuzzy mode presents the frequency of violent crime incidents within a 3000 foot radius. Crimes are noticeably clustered around the downtown area and Peabody Darst Webbe, as well as the south-western part of the city, including neighborhoods such as Gravois Park and Dutchtown. The lowest frequency class is between 1-6 crimes, and the highest is 30-34 crimes.
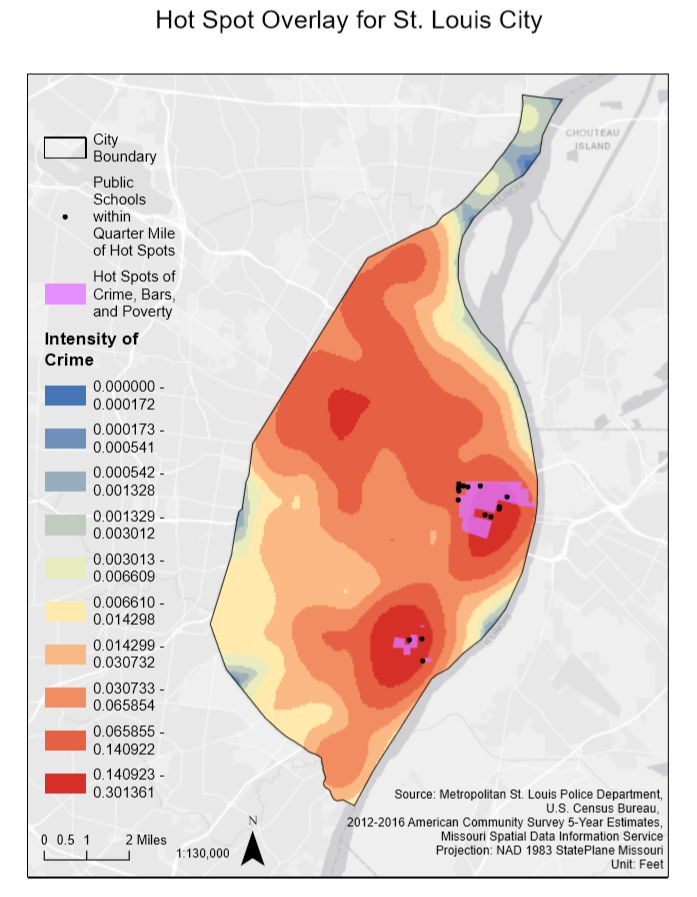
An overlay hot spot analysis of the city was used to determine if independent variables were responsible in influencing the occurrence of crimes. The variables included poverty and bars, which are both known to be generators of crime. Under the theory of risky places, as outlined by Kennedy et al (2018), states that features of the physical environment act as places of conflict and generators of crime. Bars, due to attracting gang members and creating disorder due to the effects of alcohol, were therefore included. The results from the overlay hot spot analysis again were concentrated in the downtown areas of the city as well as the south-western neighborhoods. Public schools within a quarter mile of hot spot overlays were identified at potential risk to violent crimes. Overall, 16 public schools are at potential risk of experiencing a violent crime in these areas.
Overall we had reached a conclusion that there are spatial patterns around the city and hot spots where violent crime tends to occur. We identified that there are two main crime clusters on the eastern and south eastern part of the city. However, there was another cluster in the northeastern part of the city in which we were unable to provide an explanation using the data we have. Solutions to these problems additionally may not be easy, especially if multiple physical and social factors are responsible. The overlay hot spot analysis was useful in showing how physical features can influence violent crimes, however risk terrain modelling would be preferred as the primary method for understanding risk generators in the city.