Study area
British Columbia (BC), Canada is located between the Pacific Ocean and the Rocky Mountains. It is well known as a region which has highly complex physio-geographic characteristics. BC covers almost one million hectares, and across a great ranges of latitude and elevation. There are also great variations in climatic modes and vegetation types in BC, ranging from arid to hyper-maritime and from coastal rainforest to alpine tundra (Moore et al., 2012).
Streamflow regimes
Streamflow tends to exhibit seasonal patterns (aka., regimes) which are mainly controlled by local climate. These patterns can be broadly classified according to the dominant sources of streamflow including rainfall, snowmelt and glacier melt. There are five primary streamflow regimes (Fig.1) in BC: pluvial (rain dominated, i.e. Carnation), nival (snowmelt dominated, i.e. Refish), two forms of hybrid regime (pluvial-dominant hybrid, i.e. Capilano; nival-dominant hybrid, i.e. Coquihalla), and nivo-glacial (snow and glacier melt dominated, i.e. Lillooet) (Eaton & Moore, 2010).
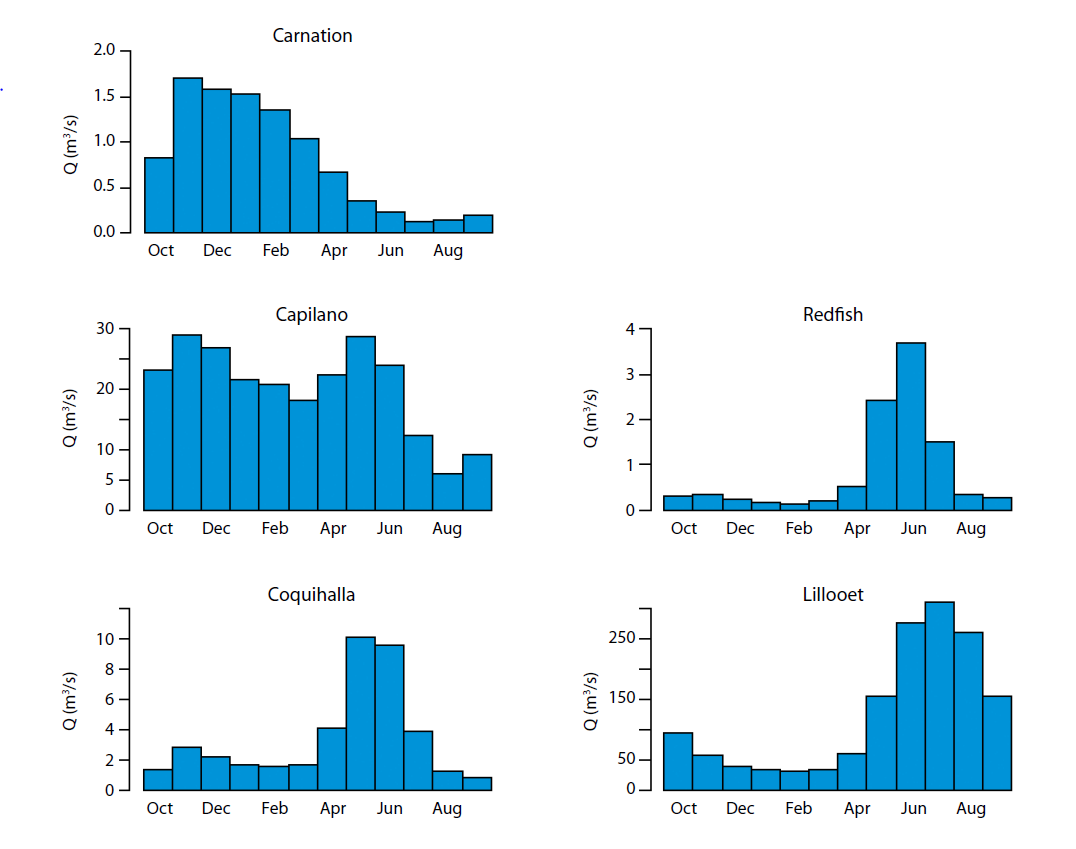
Figure 1 Examples of streamflow regimes in BC. Values are monthly average discharge (Q) in m3/s. (Eaton & Moore, 2010)
Data sources
Streamflow data
Annual streamflow records at gauging stations operated by the Water Survey of Canada (WSC) were downloaded from the HYDAT database developed by Environment Canada (2018). All stations with unregulated flows in BC were selected, resulting in 1448 stations.
Catchment characteristic data
The EAUBC Rivers dataset published by the Ministry of Environment and Climate Change Strategy, BC (2018) was used as a primary input for this study. It contains comprehensive data of catchments in BC such as shape file of catchment boundaries, elevation, drainage area, channel gradient, annual and monthly precipitation and temperature, fractional coverage of each provincial Biogeoclimatic Ecological Classification (BEC) zone (Klinka et al., 1991), bedrock type, quantified glacial influence, and results of a range of ecological classification systems including streamflow regime classification. The determined class of flow regime for each selected catchment in this dataset (the HYDRO_MODE column) was used as the observed regime for training the model and verifying the results.
Climate data
Climate data was obtain from the ClimateBC dataset (Wang et al., 2012), which was produced using the Parameter-elevation Regressions on Independent Slopes Model (PRISM) method. The spatial resolution of the dataset is 800m, and each grid contains annual/seasonal/monthly climate normal data (1981-2010 period was used). Each climatic variable (e.g., mean annual precipitation) is presented as individual raster file.
Extreme Gradient Boosting
Extreme gradient boosting algorithm was used to relate the climatic and catchment characteristic data to the streamflow regimes. In short,
XGB is a supervised machine learning algorithm based on decision tree statistical method. The tree method successively splits the data into categories based on some thresholds of the explanatory variables (can be either numeric or categorical) until the error metric (similar to the error term in a regression equation) can no longer be reduced by further splitting, then the probability of that each data-entry is belong to which pre-defined class is calculated. As results from a single tree is often biased, XGB constructs many of these trees but in different ways of splitting, and ensemble the trees to make the final prediction using the gradient descent technique that minimize the loss in accuracy when adding new trees. This algorithm is originated from the gradient boosting statistic framework by Friedman (2001), and is expanded and implemented by Chen et al. (2016). It is capable of three different tasks: classification, ranking, and numerical prediction.
Data processing
A list of selected gauging stations with coordinates was used to generate a point feature class in the GIS software ‘ArcMap’. Then, the points created were associated to the EAUBC Rivers dataset (polygons that contains catchment characteristic data) using the Spatial Joint function in ‘ArcMap’, and Climate data were extracted from ClimateBC raster files to the points that represent gauging stations. The attribute table of the resulted point feature class was exported as a database for further operations.
Streamflow regime classification
Unwanted variables were deleted from the exported database, only basic topographic (drainage area, mean elevation, and UTM coordinate), and climate (annual/seasonal precipitation and temperature from ClimateBC) data were kept as input explanatory variables (see Appendix 1 for the full list) to minimize data input requirement. The entire database with 1448 records was split into 70% of records for training the model and the other 30% for testing the performance. The classification included training and testing was done using the ‘xgboost’ package (Chen & Guestrin, 2016) in the data analysis software ‘R’.
Mean annual discharge prediction
The input data used for the mean annual discharge prediction purpose was different from those used for classification. To improve the precision of the input, stations that have more than 10 years of records were selected, resulting that the number of stations was reduced from 1448 to 541. An advice was given by Dr. Brian Klinkenberg at UBC in which multiple stations could be installed at different locations within one catchment, thus one set of catchment characteristics may relate to different magnitudes of discharge, compromising the meaningfulness of the data. This advice was followed, and duplicate records were cleaned based on that the record with the largest discharge was kept as such station is probably located downstream of those with smaller discharge. Downstream locations represent more drainage area of the catchment than those upstream locations do. There were 399 records left after cleaning, and only numerical variables in the EAUBC Rivers dataset were used as input for discharge prediction.