
WEEKLY OBJECTIVES
When we attempted to send out our survey to the principals via email last week, our email bounced back due to recent policy changes that prevents unauthorized emails from being sent to email accounts that belong to Vancouver School Board members (@vsb.bc.ca). Therefore our objective for this week is to find a way to successfully reach out to school administrations to be able to distribute our survey. We are only focusing on this objective because we believe that this is of great importance since this survey defines our subsequent steps.
What have we been able to achieve?
As mentioned earlier, last week we had some difficulties, however along with those difficulties came great achievements. After putting a lot of work making adjustments to the survey in regards to the considerations given by the teaching team and Joanne, our survey was finally approved by Joanne to be sent out to the school principals. In addition, we also had an opportunity to participate in the “moment of significant change workshop” during class time where we were able to reflect on the experiences we’ve had throughout this project and come up with an overall consensus of how we have felt throughout each significant moment. Lastly, we were able to complete the consent form that we will send to the principals once we figure out a successful way to communicate with them.
REFLECTION ON “MOMENT OF SIGNIFICANT CHANGE” WORKSHOP
Our reflection is based on the “What, So What, Now What” framework.
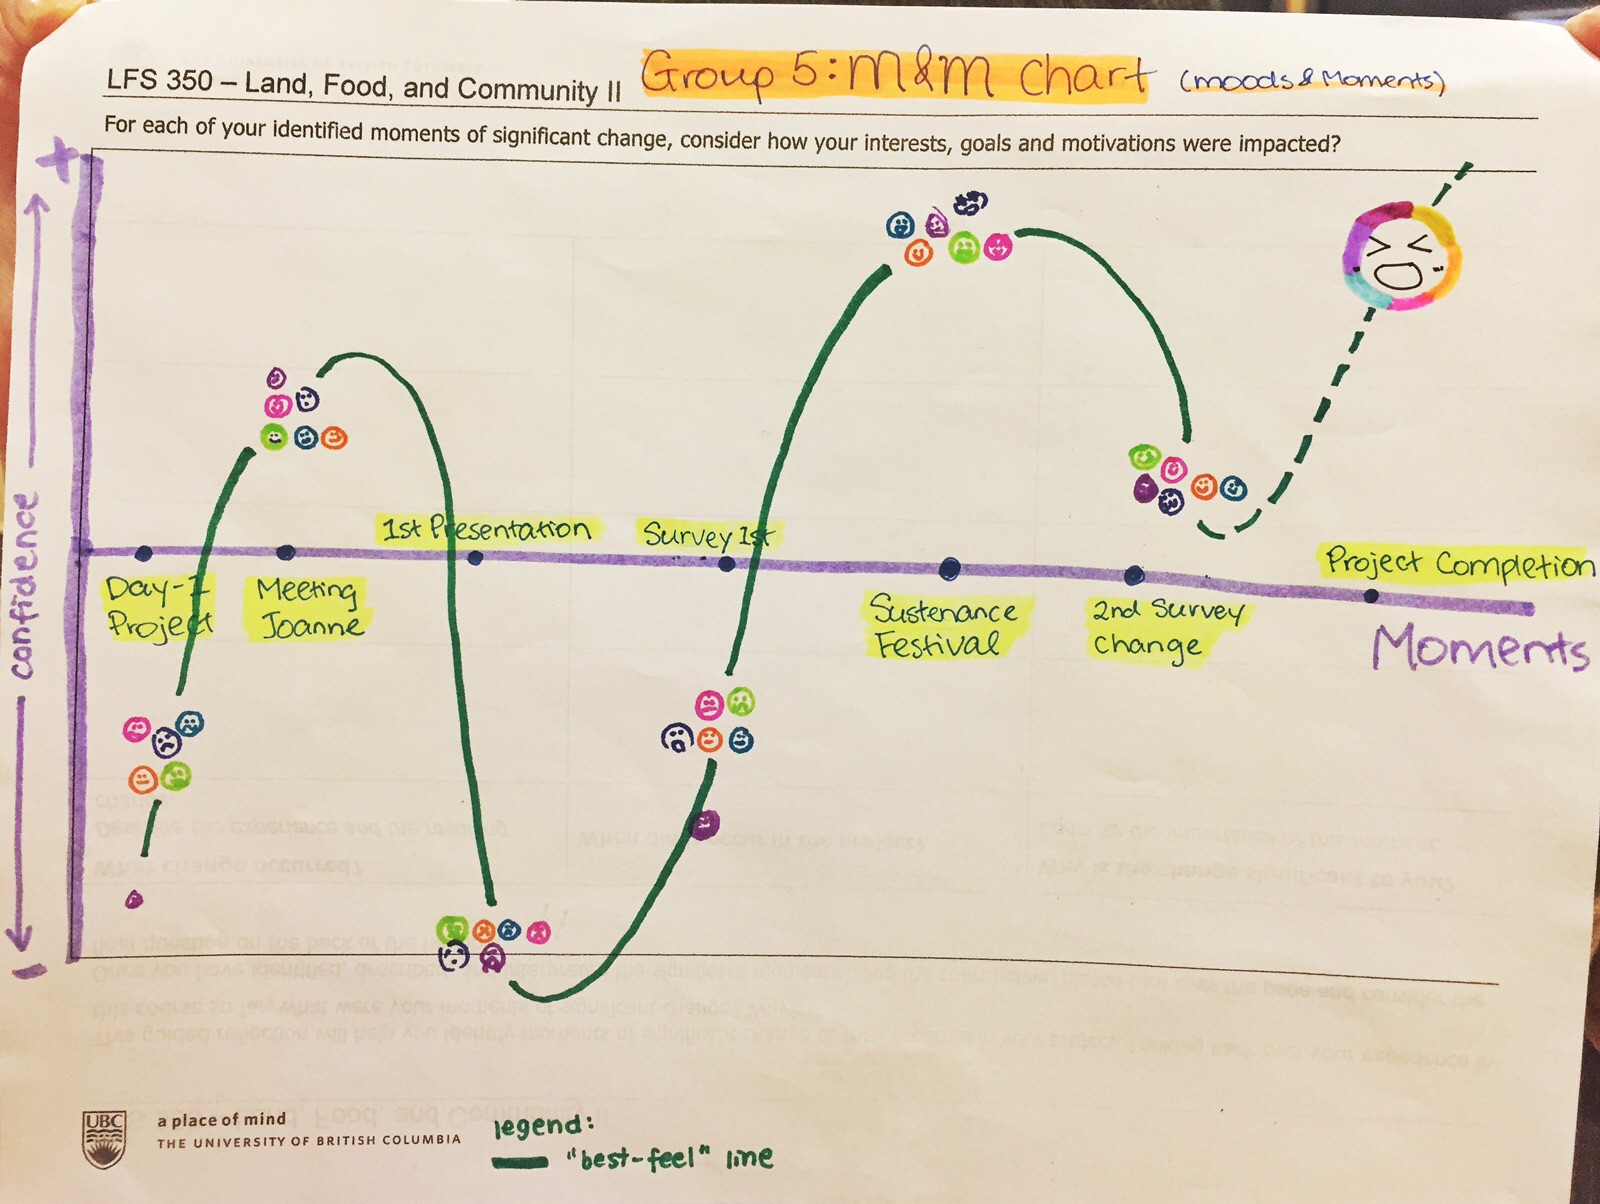
Our M&M (Moods and Moments) chart we created in LFS 350 Session 8 “Moment of Significant Change” workshop
What is our graph about?
During the workshop, we created a M&M Chart (Moods & Moments Chart) with x-axis showing the timeline of significant moments in this community garden project and y-axis representing levels of confidence. We chose “confidence” to be our y-axis because it best represents our emotions. When we face uncertainties and confusion, we lost our confidence to proceed. On the other hand, when we were on the right track and receiving positive feedbacks from the community and the teaching team, our confidence increased as the project accomplishment is foreseeable. Each of us used a different colour and an emoticon face to reveal our emotions at the moment and plotted our levels of confidence accordingly.
- Day 1 Project — The first significant moment is Day 1 when we first knew our community project and reviewed the project instructions. At that time, most of us felt confused and we were unclear about the objectives and tasks to be done.
- Meeting Joanne — A week later after we met Joanne and she cleared out the expectations and objectives of the project, we felt relieved, happy and knowing what to proceed.
- 1st Presentation — We had our first proposal presentation. We were pretty depressed because our instructor and teaching assistant commented on what we missed including inquiry questions and project limitations, and we needed to narrow down our project objectives otherwise it will be beyond the scope and our abilities.
- Survey 1st Draft — We constructed the first survey draft and sent it to Joanne for comments. She thought that our survey had too many qualitative/open-ended questions and she recommended us to have more quantitative/Likert scale questions. We felt disappointed that the survey was not approved and more time was needed to revise it.
- Sustenance Festival — On October 18, we conducted bread making workshops at the Sustenance Festival at Hillcrest Community Centre. The workshop was a big success since we had at least 40 kids joining us, which was more than the numbers of participants we expected. We were very excited that our workshop was highly engaging for the community.
- Survey Final Draft — After reviewing Joanne’s feedback and reconstructing the survey, our final draft was approved by Joanne and it was ready to be sent out to the school principals. We felt satisfied because we were a step closer to accomplish our project.
Finally, a “best-feel” line was drawn to visually show our overall moods and what we have been through for this community garden project.
In relation to Tristram Stuart’ s TED Talk, he constructed a graph analyzing the extent of food waste around the world by comparing the amounts of food produced and consumed (Stuart, 2012). Graphs are effective and useful visual aids used to identify an overall trend that allows people to reflect on the responses. By constructing a moment of significant change diagram during the workshop, we were able to visually analyze our progress and forecast our future goals and strategies to successfully complete our project.
So What: How did we feel?
While reflecting on our moments of significance during the workshop, our group felt more connected and refreshed as we looked back on how far we’ve come in the project. During the session, we had a chance to first reflect individually, then share our thoughts within our groups and finally, shared our experiences with other groups. It was comforting to learn that we were emotionally connected as a group as we all shared very similar emotions during each moment of significance that we identified. We also felt more reassured after sharing our experiences with the class and realizing that most groups went through similar processes in their projects. In particular, we noticed that other groups also felt somewhat discouraged after the first presentation where we all received constructive feedback from Will and Latika that resulted in a change in many projects. As we reflected on our progress so far, we could not help but feel accomplished at what our group has achieved and that we were able to remain united as a team. Our graph provides a snapshot of the up’s and down’s we experienced and shows how we managed to overcome the challenges faced while trying to keep a positive mindset. Through this workshop, we were able to take a step back and view our project in a different perspective, realizing that it is normal to face obstacles and the importance of seeking advice and working as a team to overcome them.
Now What: How do we hope to end our journey?
The last portion of our graph represented an optimistic view on how we hope to feel at the end of our project. We utilized a rainbow smiley emoticon which consisted of the six colours from our previous rankings, each colour representing each one of us. As shown, it was unanimous that we all wanted to end up satisfied with our project, and most importantly, confident that our project will be useful for the community. Our group ultimately felt that the success of our project was largely based off the service we provided for the community. Some of us expressed a realistic doubt, that possibly our project will be read, graded and forgotten. Our y-axis represents the confidence of our project at that given time. However, when we finish the project, what does that confidence measure? To our group, it would be a measurement of the confidence we have that the information we gathered and analyzed will ultimately affect the community. This is similar to Ron Finley’s TED talk, where in he creates urban gardens in previously abandoned locations. His primary goal is to affect the community and influence their habits, believing that if the community is involved in growing their food, they will eat the food that they have grown (Finley, 2013). Likewise, we hope to influence our own community project garden in a way that would allow people to become more interested and discover what it is exactly the community expects from the garden. The confidence we feel at the end of our project, will be a reflection on how we can see the community benefiting from our project.
OUR STRATEGY FOR SUCCESSFUL PROJECT COMPLETION
Our limitations
After getting our survey questions approved by Joanne MacKinnon, we began to distribute our survey link to our contact list which consists of school administrations and other contacts such as Parent Advisory Councils (PAC) coordinators. Unfortunately, the emails sent to Vancouver School Board members (@vsb.bc.ca) were bounced back because our emails are not authorized by VSB. Our community partner, Joanne, also tried to distribute the emails to the contacts, however, it yielded the same result. In response to this challenge, we consulted our teaching assistant (TA) and our professors, Latika, Will and Eduardo, to ask for their assistance. Latika provided us with two recommendations which Will and Joanne are in agreement of: to call Barbara Anderson from VSB Ethics Board to include our communication representative’s email on the list, or to conduct in-person interviews if our sample size is less than 20 people. Our limitations can be related to this week’s TED Talk by Ron Finley. In the video, Ron talked about how policy change in the area resulted ina warrant issued for his home garden (Finley, 2013). He overcame this limitation by obtaining petitions from the neighbourhood (Finley, 2013). In resolving our challenges, we seeked advice from our course instructors, community partner, and teaching assistant to obtain recommendations. As a group, these recommendations are taken into considerations when deciding upon our strategy for successful project completion.
Our new plan
In order to successfully achieve the completion of our project, we have come up with several alternative strategies. Our first strategy is to call Teri Corcoran (i.e. the community schools coordinator of Tupper Family of Schools) and Barbara Anderson (i.e. VSB Ethics Board member who deals with ethics approval for research with VSB) to explain them our dilemma and ask for our email to be put under the authorized email list for VSB schools. As explained earlier in our weekly objective, conducting a survey is a major part of this project. The importance of our survey is similar to what was presented in the TED talk by Tristram Stuart. Tristram used the data he obtained from diet intake survey, levels of obesity, and range of factors that estimate amount of food we consume to analyze food waste in a global scale and conclude that there is more than enough food in the world to feed everyone. We can relate Tristram’s use of survey to what our survey is hoped to achieve. Our survey is utilized as an information gathering method which will be used by community partner to develop a model to increase sustainability of school gardens, specifically the one at Tupper high school, by connecting this school garden to elementary schools in the area (Stuart, 2012).
If this plan does not work out, our second alternative is to conduct in-person interviews with Tupper schools principals. Although our sample size is 11 (i.e.less than 20), in-person interview is not the preferred strategy as our online survey has already been approved by community partners and there are several limitations regarding in-person interviews. With face-to-face interview, we would have to repeat the process of compiling different survey questions, having surveys approved with making further changes, which is time consuming considering that our project needs to be accomplished in one month. Moreover, interview bias is another drawback in that participants are more likely to give idealized and desirable responses due to the social expectations. Also, time constraints may cause less schools participating in the survey since interviews take more time and effort. By and large, we are taking our future steps towards making phone calls to receive mailing authorization or having face-to-face interviews, and hopefully successfully complete our project.
WORKS CITED
Finley, R. (2013, February). A guerilla gardener in South Central LA. TED. Video retrieved from http://www.ted.com/talks/ron_finley_a_guerilla_gardener_in_south_central_la?language=en
Stuart, T. (2012, May). The global food waste scandal. TED. Video retrieved from http://www.ted.com/talks/tristram_stuart_the_global_food_waste_scandal?language=en