
The foggy Vancouver weather has cleared up and the sun is finally poking through the clouds
Our Successful Survey Distribution
Before distributing the final version of our survey, we made two important changes to our list of questions, based on feedback we received from our TA and feedback we received from the first students we surveyed. To start with, we added a fundamental question: “Do you use campus vending machines? (Yes or No)”. The significance of including this basic question is to be able to classify all survey respondents (and their preferences) as current customers versus potential customers. Secondly, we decided to remove a too-specific question–asking how respondents felt about the potential introduction of one particular new type of product–in favour of asking a more generalized form: “Would you be more inclined to consider purchasing from the vending machine if new options were clearly labeled as ‘new item’?”.
Distributing Surveys at Irving K. Barber
Over the past few days, each group member has distributed approximately 30 surveys, for a total of 210 surveys completed across campus. We feel this is a large enough sample size to allow us to make meaningful interpretations. We coordinated our efforts to target as many popular locations on campus as possible. Tyra and Rosemary administered surveys at the Student Union Building to individuals who were seated at the cafeteria, near locations where vending machines were installed. Carmen administered surveys at Woodward Library, and Judy went to the other popular library on campus, Irving K. Barber. Katherine and Aveir both handed out surveys at the main bus loop. Lastly, Alex distributed her surveys at the UBC Bookstore. We carefully chose these locations to be as inclusive as possible to all individuals from the various faculties on campus. We also tried to cover a variety of times of day. This was done intentionally to avoid sampling bias: taking a sample not representative of the population.
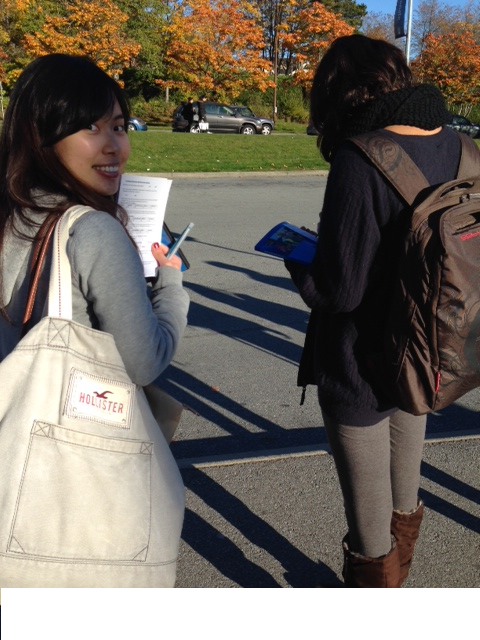
Aveir Waiting for a Participant to Finish the Survey
We are happy with how the surveying process went, and we attribute much of this to our pilot survey, as it really helped us prepare for what to expect (in terms of time-commitment and community responsiveness), as well as eliminate any blatant problems with the survey ahead of time. We printed three surveys to a page, so we were able to minimize paper use to 70 pages total, and printing was the only resource we required to complete this activity. From this undertaking, we learned that there are specific steps you can take to really make the process of surveying easier: having clipboards (especially if people are not seated anywhere!), and having several pens on hand. The first of us to administer surveys were able to share tips like these to help the rest of our group be more prepared.
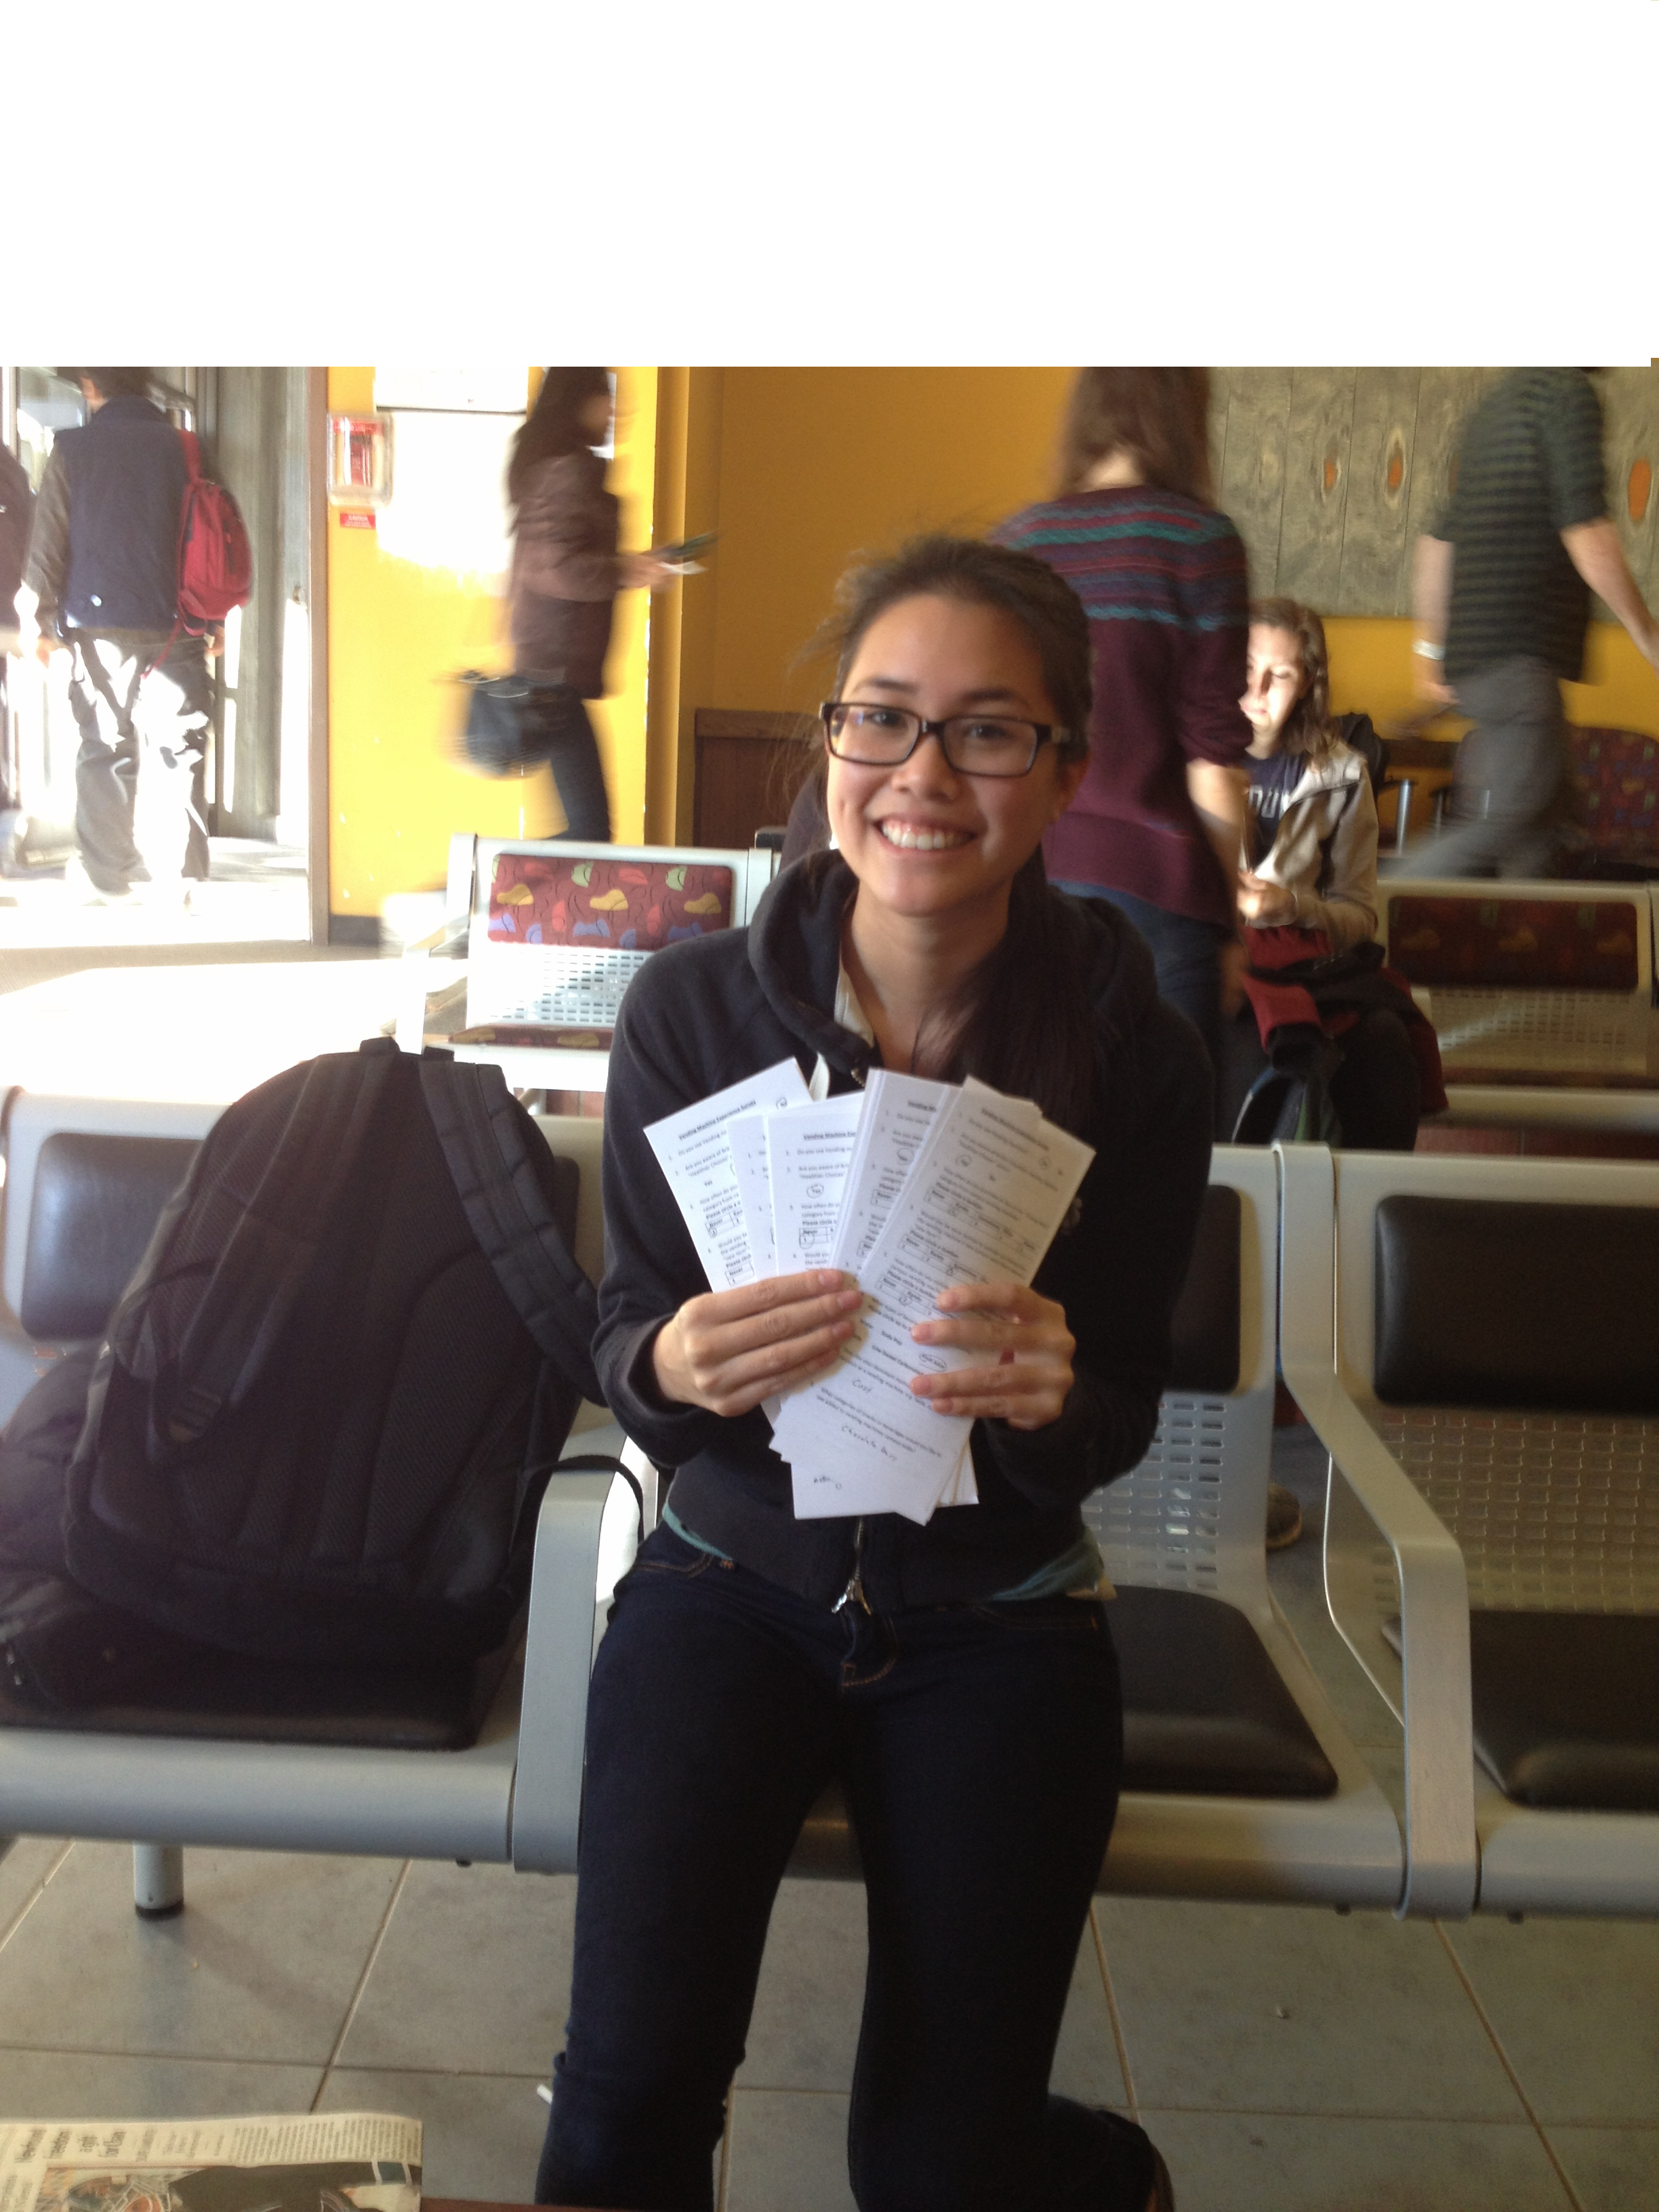
Alex With her Finished Surveys
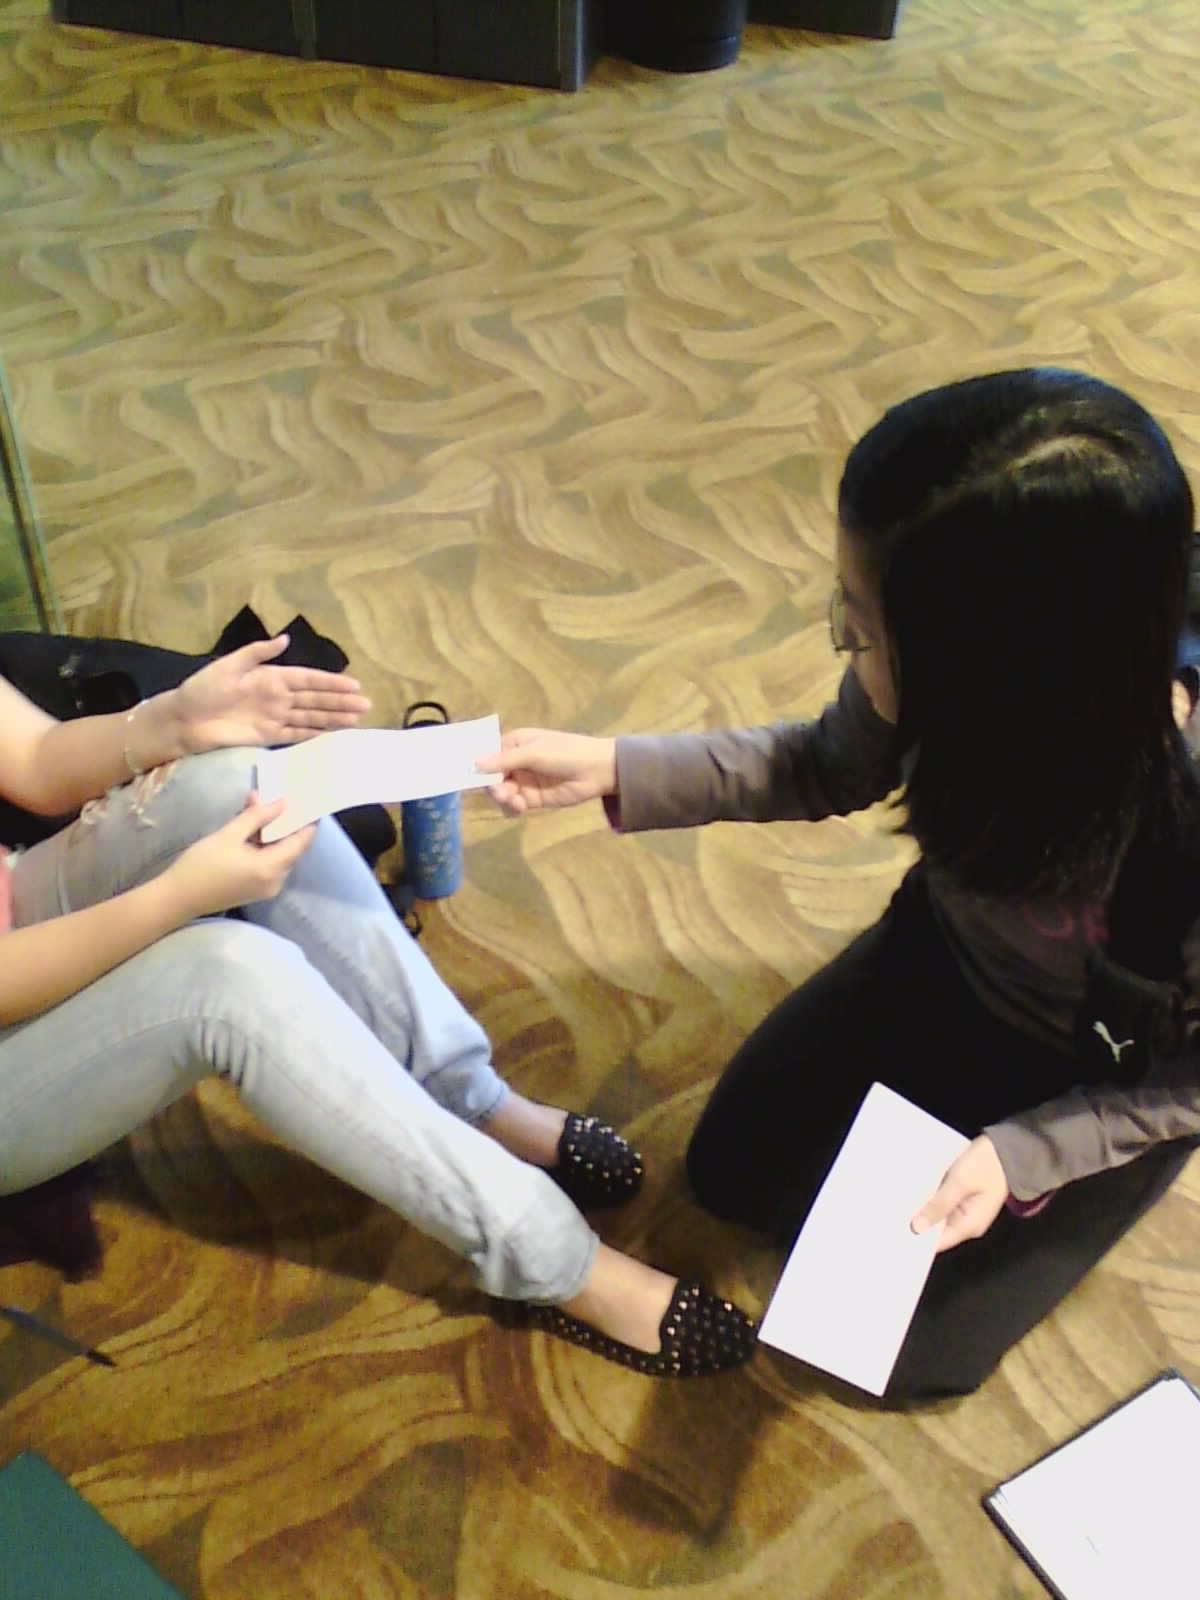
Judy Handing Over a Survey
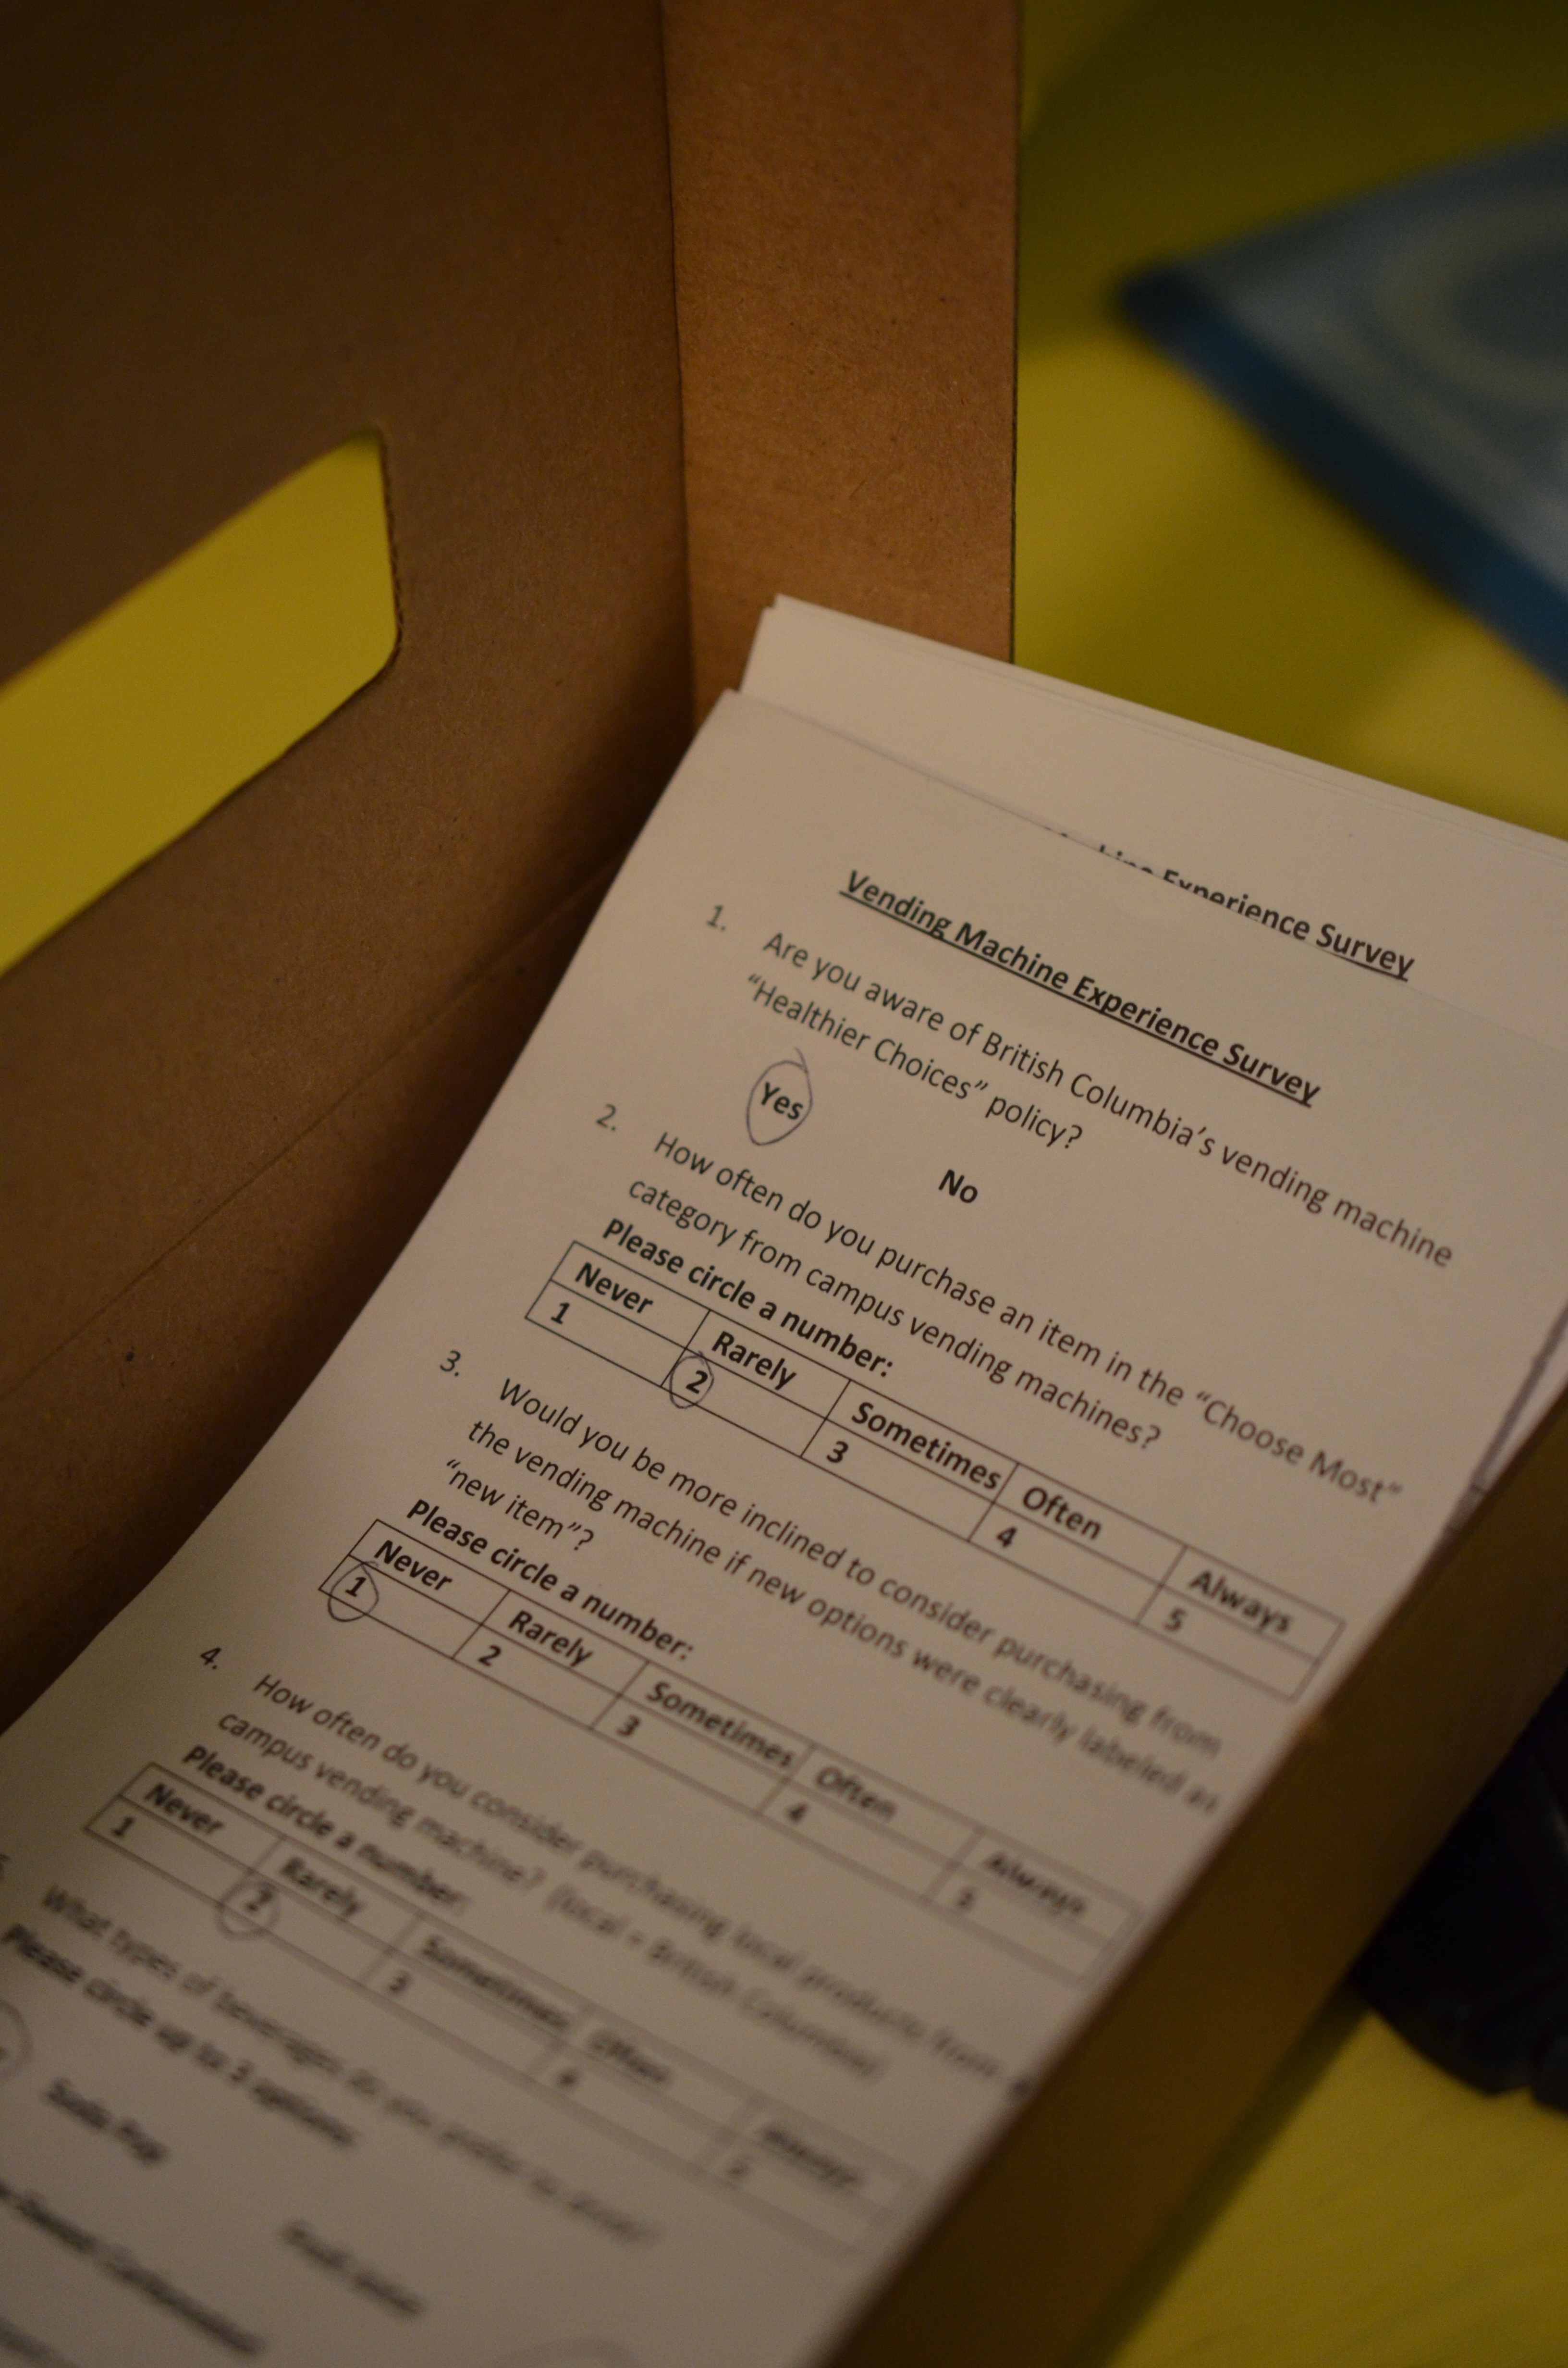
Completed Surveys Distributed by Tyra and Rosemary
What To Do With the Survey?
Now that we have finished the fieldwork for the survey, each member of the group is responsible for manually transcribing their completed surveys to a spreadsheet so that we can compile the complete tabulated results of the survey. We are planning to quantitatively analyze the ranked questions in order to find statistics that can be generalized to the entire campus population. We can make charts to allow this information to be easily conveyed and discussed. We hope to make recommendations to our community partner based on these findings. We also plan to read through the qualitative answers to see if there are any frequent answers that can be discussed in detail. This, in turn, should help us to understand patterns regarding student snack and beverage preferences, and their vending machine purchases.
Communication with Our Community Partner
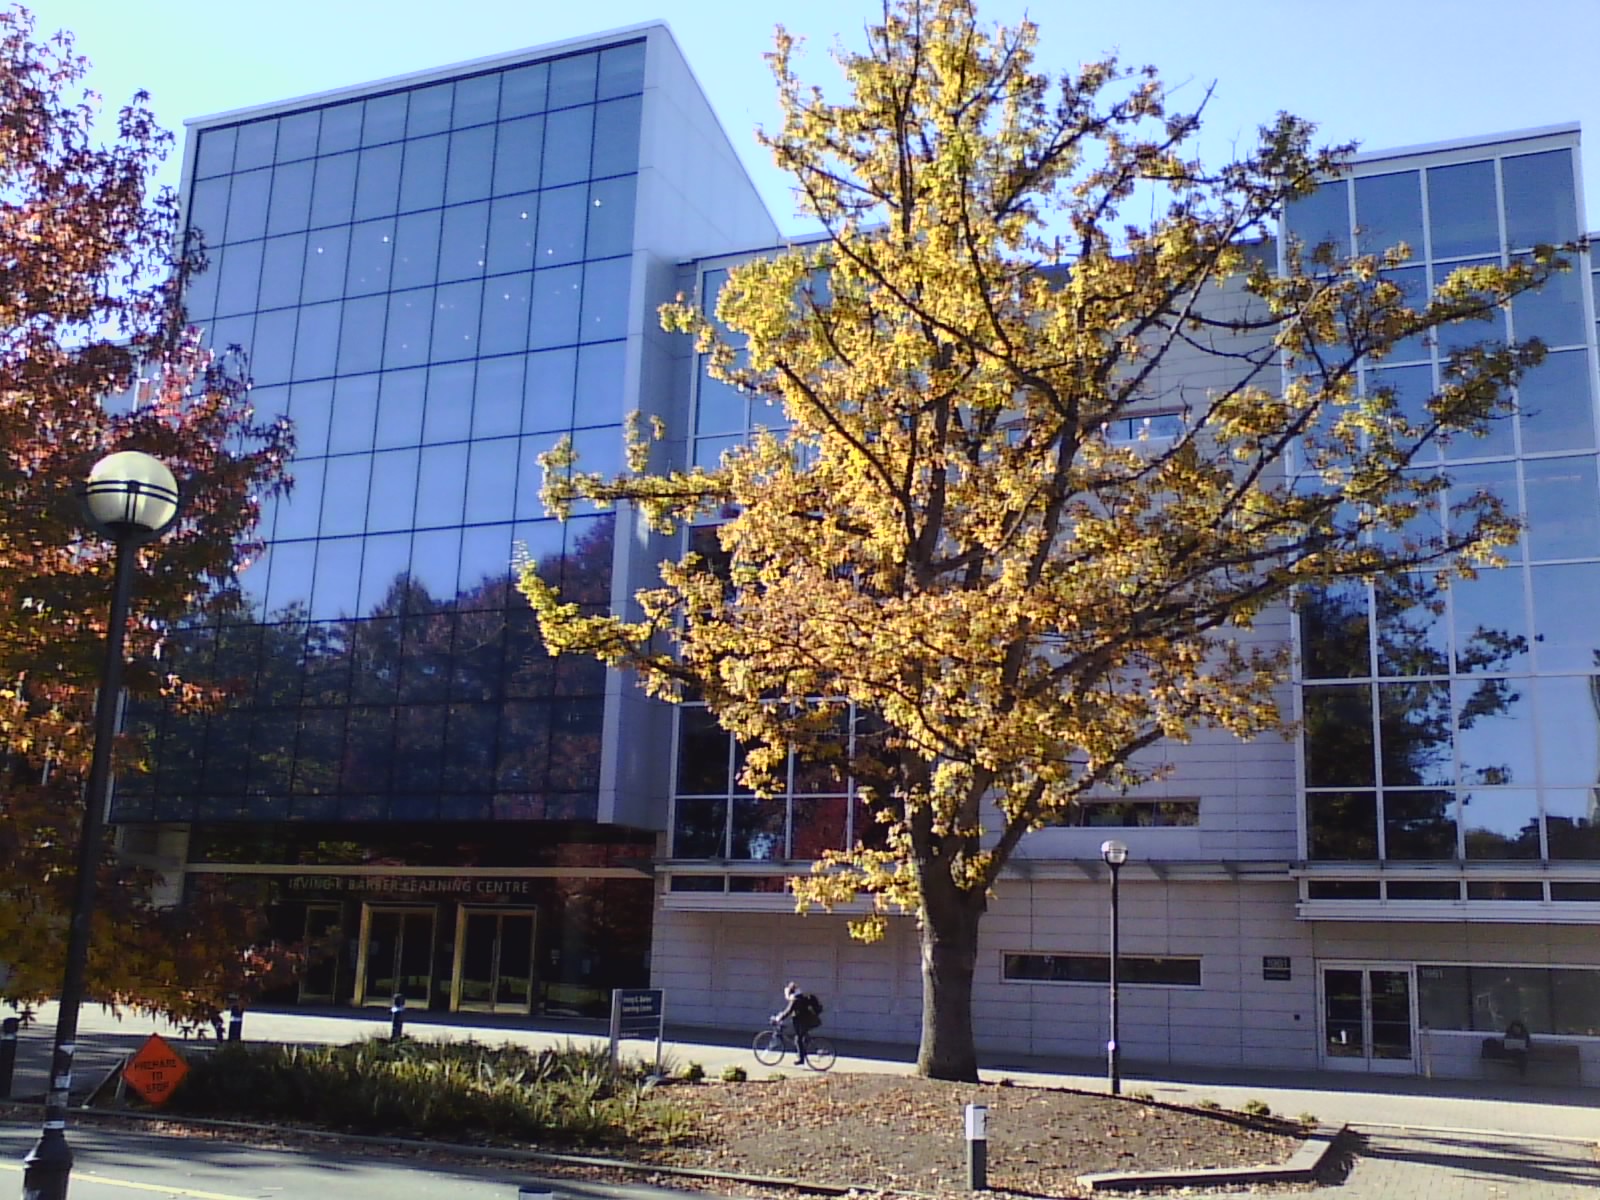
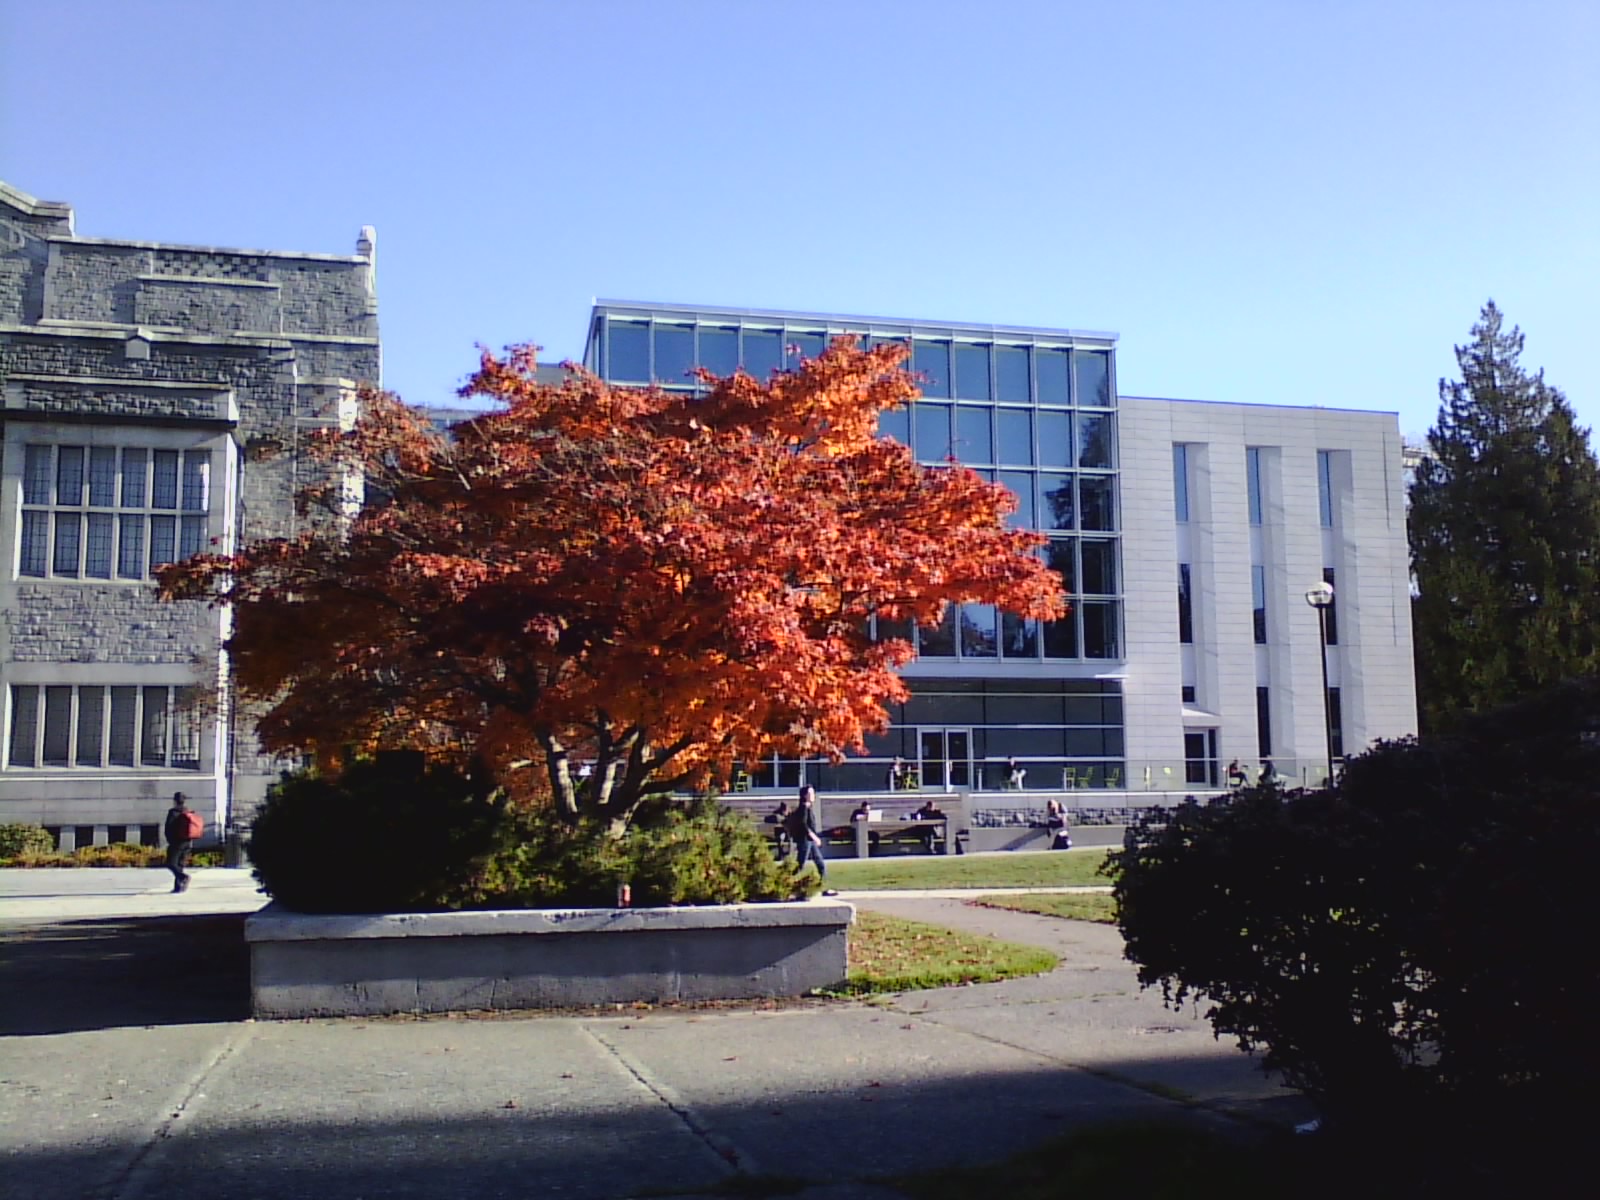
Irving K. Barber Library on UBC Campus
We have managed to set up a meeting time with Victoria and Liska, as well as our TA, Lorne. Judy has been in contact with them via email, and November 7th seems to be the best time for everyone. Our group would like to meet with Victoria to update her on the results of the survey, as well as discuss with her our plans for the audit of the GSVM (the current healthy snack vending model).
Resources to Start our Final Research Report
We are using previous LFS 450 reports and articles from the UBC library website to aid us in completing our project. We are also working to obtain the necessary information on sales and locations of the current GSVM on campus, which we will then audit and compare to BC’s Healthier Choices policy. In addition, we are relying on skills we gained in our previous LFS 252 statistics course to help us with the data analysis.
What’s To Come
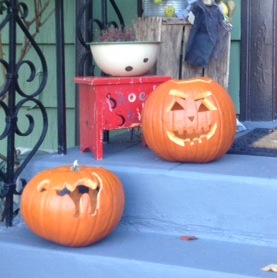
The Halloween Spirit
We still have a lot ahead of us, as we have yet to complete the audit of the current GSVM but, with the survey taken care of, we have come a long way. All we have left to do for to the survey itself is to analyze the results, and once everything is complete we will write our research paper based on all of our findings.
Hope everyone has a happy and safe Halloween!
Cheers,
Group 26
210 surveys!! Great, lot of data and tons of work. I look forward to read the results from your analysis.
Regards,
Eduardo