Monthly Archives: March 2015

SLA Webinar: Using Analytics to Understand Social Media Activity

A couple months ago the Special Libraries Association hosted a webinar: Using Analytics to Understand Social Media ActivityThe abstract for the event mentioned the lack of research into the success of social media use by libraries, and promised presenters would “suggest better strategies for user engagement,” as well as “tools and methods that can be used to conduct social media analytics.” Unfortunately I was unable to attend the webinar in real-time, but the SLA has made the webinar’s audio, a transcript, and the PowerPoint presentation available to view on its website.

http://www.google.co.uk/intl/en/analytics/features/mobile.html

http://www.google.co.uk/intl/en/analytics/features/mobile.html


Michelle Chen, an assistant professor at the School of Information at San Jose State University presented the webinar. Dr. Chen discussed two research projects. One was designed to facilitate an understanding of user behavior and its implications in online environments. Another used information visualization to enhance knowledge discovery.


Research Project #1:Twitter Sentiment Analysis for Understanding Citizens’ Trust in Government

    • Collected 1 million tweets from users reacting to official city, mayor, and police department accounts
    • Conducted sentiment analysis (also called “opinion mining”) to uncover citizen attitudes towards government

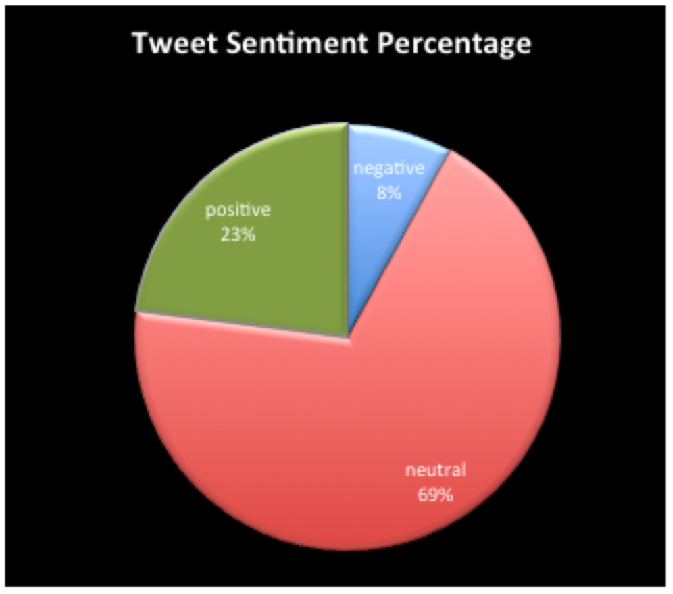
Sentiment Analysis, Michelle Chen. 

Research Project #2: Quantitative Analytics for Library User Engagement Strategies through Social Media: Pinterest and Twitter

  •  Studied 10 libraries using Pinterest and Twitter and categorized engagement in 4 categories: Literature exhibits, Engaging topic, Community building and Library showcasing.
  • Developed metrics for analyzing Pinterest (followers, re-pinning, liking, etc.) and Twitter (topic modeling- looked for patterns in topics) 

Some Recommended Tools

  • Many Eyes — a data visualization tool that is free and requires no programming or technical expertise (see a free video tutorial here)
  • KDNuggets — data mining techniques website
  • Splunk, an operational intelligence platform: “It enables the curious to look closely at what others ignore—machine data—and find what others never see: insights that can help make your company more productive, profitable, competitive and secure.”
  • R — a free, open-source statistical programming language that allows users to interpret, interact with and visualize data quickly and easily.

Conclusions about Ways Social Media Analytics Can Be Used: 

  • To understand library users’ attitudes and to identify trends
  • To manage online identity/reputation of a library
  • To predict user behavior / needs
  • To tailor social media campaigns and effectively target users
  • To identify “primary influencers” in social networks and target them

Altmetrics: Measuring Impact Using Web Data

In the field of scholarly publishing, the importance of a particular work has historically been measured by the number of times it is cited by other articles, known as citation impact. As scholarly work is increasingly shared and discussed online, we’ve seen the emergency of altmetrics: an alternative method of measuring the impact of academic works using web data. Altmetrics considers not only number of citations, but also other factors that indicate impact, including number of views or downloads and mentions in social media or news (known as social engagement data). According to altmetrics, this means that each time someone mentions a particular article on Twitter or Facebook, for example, the overall impact of that article is believed to increase. The logic (which makes sense to me), is that the more that people are talking about and sharing something, the more influential it is.

The issue of determining scholarly impact will be of interest to many academic librarians, especially anyone who works in the field of scholarly communications. Altmetrics is also worth exploring for librarians and other information professionals working outside of academic libraries, because altmetrics can also be used to measure the impact of individual people, organizations, videos, websites and more.

A few months ago, I came across Altmetric.com‘s list of 2014’s Top 100 academic papers online. The list aggregates the papers that received the most attention online and then ranks them, using article-level metrics (ALM). It’s fascinating to see the different places that the papers were mentioned, and how many times. As social media becomes an increasingly major way that people consume and share news and information, I think it’s entirely appropriate that the impact of an article take into consideration its spread on social media.

According to Altmetric.com, the top paper of the year was “Experimental Evidence of Massive-Scale Emotional Contagion Through Social Networks.” The article presents the results of an experiment the researchers conducted to demonstrate that Facebook users’ moods can be manipulated by adjusting what types of stories (uplifting, depressing, etc.) appear in their news feeds. I definitely remember hearing about this article multiple times through my own social media channels. The article was mentioned in:

  • 301 news stories
  • 130 blog posts (make that 131!)
  • 3,801 tweets
  • 10 peer reviews
  • 342 Facebook posts
  • 115 Google+ posts
  • 14 Reddit posts

Altmetrics is a fascinating new field that will likely grow more important in coming years. Librarians should consider the ways that they can use altmetrics to measure the impact of their own work, the work of faculty members, and perhaps the impact and use of library collections, particularly content available in open access institutional repositories like UBC’s cIRcle.