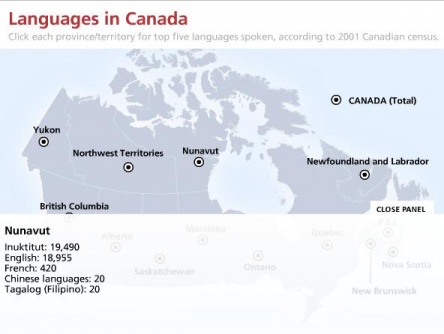
Check out this interactive language map of Canada, produced by the CBC. Click on a province to display the top 5 languages spoken at home for each province and territory of Canada, according to the 2001 census. BC’s top five? English (3,521,730); Chinese languages (208,080); Punjabi (125,920); French (53,615); and Tagalog, or Filipino (37,830).
Nunavut’s numbers give an interesting snapshot of the area:
– Inuktitut speakers outnumber English speakers, and,
– Chinese language speakers and Tagalog (Filipino) speakers are tied for 4th place with 20 speakers each.

If you’re looking for more detailed information on the languages of Canada, you can try Stats Canada Census 2001 Topic Based Tabulations and look for #6 in the list, Language Composition of Canada. Tables include:
These tables provide a comprehensive breakdown of languages by a wide range of variables such as age, gender, education, and income. If you use the 20/20 software that StatsCan provides, you can pull out the data for just the variables you are interested in (rather than looking at all the provinces or all languages, for example).
Statistical data can be challenging, so if you’re having trouble pulling out the numbers you need, please come down to the Koerner Library reference desk (2nd floor) and chat with a librarian. (Or contact me directly; details at the top left.)
