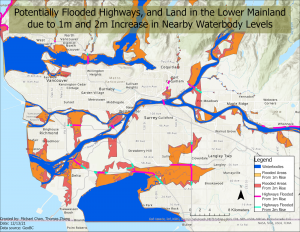
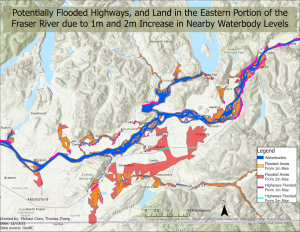
The final maps produced above were created using our model approximating the extent of flooding from a 1m and 2m increase in water elevation in rivers. The maps show the predicted extent of flooding along the Fraser River.
The results from our overlay analysis using the maps we created are as follows:
Table 2. Summarizes total area, population, and length of roads affected.
| 1m increase | 2m increase | |
| Total Area flooded | 221 km² | 416 km² |
| Population affected | 480,690 | 611,464 |
| Length of roads flooded | 1,508 km | 2,271 km |
| Length of highways flooded (Hwy 1, 7, 10, 15, 17, 91, 99) | 140 km | 174 km |
Flooded roads:
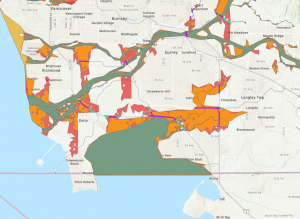
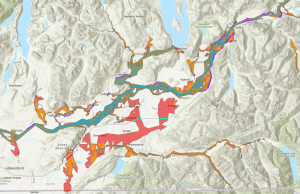
A layer of all road classes were intersected with our flooded area layer. This produced a layer of all the roads that would be flooded by a specific increase in the Fraser river level. Looking at the statistics for the road length field of this layer, the total distance of roads flooded can be revealed. To see the flooding extent for highways, Hwys 1, 7, 10, 15, 91, and 99 were selected as those were the major highways that ran across the Fraser Valley. Using the select by attribute function, and searching for those names with the OR operation, the flooded highways were selected. A new layer was created using the selected highways and was placed on our final map. Only the 4 major highways were selected to be shown on the final map to increase visual clarity and prevent all other road classes from cluttering the map. Closer inspection revealed that our DEM layer did not take the elevation of bridges into account. Therefore the final map would show that a bridge is “flooded” but in reality, this would not be the case, at least for the increments posed in this project. Updated DEM data would result in bridges to have a much higher elevation than the body of water it crosses.
Population affected:
A DA Census layer from 2016 was intersected with the flooded areas to produce a layer of census data that was directly affected by the flood. The statistics for the population then told the number of people affected by the flood. It should be noted that this number can be much higher as nearby areas could also evacuate. However, it is unknown what precautions would be suitable, but if known, a buffer could be used to increase the affected population’s area on the census layer.
Flooded area:
Map 2 and 3 shows the potential flooded area and as was mentioned earlier, also includes the water bodies. Therefore, the total area of land flooded was calculated by taking the difference in area between the waterbody layer and the total area flooded layer. A better option would be to clip the flooded layer with the waterbody layer, however when doing so, an error appears on ArcPro that prevents the attribute table from opening. This step was therefore omitted.
Lower Mainland (Richmond, Delta, Surrey):
| Richmond |
|
| Delta |
|
| Surrey |
|
Upper Fraser Valley (Mission, Chilliwack)
| Mission |
|
| Chilliwack |
|