Changing tides, by more (or less) than you might think

by Christopher Quick

Unless you are Fox News’ Bill O’Reilly, you probably know that rise and fall of the tides are driven by the forces of Sun, Moon and Earth’s rotation. In the time frame of our lives these forces stay pretty much the same.

Recent modelling studies like Pickering et al., 2012, however, have shown that things may not be so simple. There is good reason to believe that the behaviour of the tides will change as the climate continues to warm and the seas continue to rise.

The difference between water levels at the high and low tides is called the tidal amplitude. If the tidal amplitude were to increase then the threat of flooding would also increase. This becomes even more significant when you consider that if a storm hits during a high tide, the storm surge could be very damaging. That was the case with Hurricane Sandy’s large storm surge; Hurricane Sandy struck the New Jersey / New York City region during a spring tide, when we observe the very highest tides of the month. Sea level rise contributed to Sandy’s large storm surge, although probably only by a few extra centimetres.

The impact of sea level rise on tidal amplitude could be much greater in some locations because of the local bathymetry and water dynamics. In a modelling study of NW Europe, Pickering et al. project increase in tidal amplitude of up to 35 cm in certain areas with 2 meters of global sea level rise. These forecasts are for the “M2 tide”, the tide that varies on a 12 hour cycle and gives us the usual high and low tide levels. The periodic high spring tides would see even greater change in tidal amplitude with rising sea levels.

Other areas would get relief due to changing tides. For example, Newport, UK was modelled to have the range between high and low tides drop by 39 cm under a 2 m sea level rise. The largest change in tidal amplitude was at St. Malo in France, where a 49 cm decrease in amplitude is projected.

The project changes in tidal amplitude is good news for some areas since a reduction in the maximum height of the tide can help reduce the threat of rising seas. On the other hand, some areas would see increases in flood risk if this model is correct. Under a 10 metre sea level rise, tides could change in amplitude by about one metre relative to what we observe today. Granted, it is unlikely, but not impossible, that we will see a 2 metre rise by the end of the century, let alone 10 metres (at the upper-bound of models in the last IPCC report was about 1 metre by 2100). Sea level is likely to rise by 1-3 metres by the end of the 23rd century without any efforts to slow climate change.

Now a little bit of physics…

There are a few reasons why raising the sea level – and changing the water depth – could alter how tides behave. One is the physics of tides, which you can think of as slow, broad waves. Waves curl because the bottom of the moving water is slowed by friction as it enters shallow water while the top continues at the same speed and rolls over. For similar reasons, as you increase sea levels in previously shallow areas, the friction between the water and the ocean bottom is reduced so the waves reach greater heights than they would previously.

Another reason for the change in tidal amplitude is the interaction between the shape of our shoreline and the tide “waves”. In some situations waves achieve resonance, or a state where waves interact in such a way to make the waves bigger. This is why you see the world’s largest tidal amplitude in Canada’s Bay of Fundy. Sea level rise can impact resonance in two ways. First, as sea levels change, the points from which the tide waves appear to be generated from can shift. Second, the speed of waves can change, which alters how waves enter the bay and interact with each other. Both of these reasons lead to a change in resonance and either higher or lower tidal ranges.

So all in all, this is something else to consider when deciding how to respond to or minimize the effects of sea level rise. Pickering et al. point out how this information should be considered when building adaptation infrastructure like sea walls or even in renewable energy projects like tidal power.

Reference: Pickering, M.D., Wells, N.C., Horsburgh, K.J. and Green, J.A.M. 2012. The impact of future sea-level rise on the European Shelf tides. Continental Shelf Research, 35.

 

Thermostats in the mountain forests of Peru

by Meghan Beamish

Trees are amazing, in so many ways. We know that they play an integral role in the carbon cycle, where they help regulate atmospheric CO2 levels. But we don’t really know all that much about how exactly they act in the carbon cycle. Luckily, many scientists are studying just this. And the results of these studies are pretty cool. Take, for example, our recent post about how older trees actually accumulate more carbon than younger trees. And a recent study shows that tree roots help regulate earth’s temperature as well!

Christopher Doughty and colleagues’ paper in Geophysical Research Letters explores  how tree roots, along with their symbiotic fungal partners, can regulate the long-term global climate.

They studied how biotic weathering (the breakdown of rocks, soil, and minerals by organisms — in this case tree roots and fungi) rates change with soil temperature. Their analyses in the Peruvian mountains shows that with cooler temperatures, fine root growth decreases and organic layer depth increases, which means less weathering. The authors concluded that the opposite is also true: as temperatures rise, the soil organic layers shrink, and more roots grow in the mineral layers, thus increasing weathering. And with increased weathering comes an increase in atmospheric CO2 drawdown. The paper posits that this negative feedback between global temperature and biotic weathering has contributed to long-term climate stabilization during periods of CO2 changes in the Cenozoic era (the time period spanning 66 million years ago-present), such as in volcanic degassing events.


The pause in public understanding of climate change

by Simon Donner

The latest issue of Nature Climate Change just came out with a special focus on the current slowdown (or “pause”) in surface temperature change. Among the six commentaries published is “Pause for Thought,” which discusses how the subject has been communicated (the commentary has also been blogged on by one of the authors, Tamsin Edwards, here). This is a re-post from the old site in relation to this.

The Fifth IPCC assessment report on the physical science of climate change was released this past September. It is probably the largest, most comprehensive scientific assessment in history.  Not just of climate change, but of any scientific subject. Really. Try to think of any scientific report with more contributors, more citations, more reviewers, more pages, and more preparation time.

Unfortunately, the report was overshadowed somewhat by confusion about a perceived slowdown in the rate of global warming. The graph at right, is based on the GISS estimates of global average surface temperatures since the early 1970s. There is a clear signal of rising temperatures amidst the noise of natural variability.

The slowdown in surface temperature change is part of that natural variability.  The planet is still gaining extra heat due to human enhancement of the natural greenhouse effect. As we described in the previous post, the difference is that over the past decade or so, a larger proportion of that heat than normal has gone into the deep ocean. In a few years, the yin of deep ocean heating will give way to the yang of surface temperature warming. When conditions in the Pacific Ocean again allow the development of a strong, traditional El Nino event – a la 1997/8, or 1982/3 – we’ll see new global surface temperature records.

The media noise surrounding the perceived slowdown is part of the  natural variability of public understanding of climate change. Our research has shown that public attitudes about climate change in the United States ebb and flow with the climate. After a cool period, people tend to be less convinced and less concerned about climate change.

It’s worth imagining different labels on the axes of the temperature graph. The public conversation about climate warming follows a similarly noisy trajectory. There is a long-term trend towards greater public understanding, better reporting, and better informed discussion at the political level. There is also variability, due to the natural ups and downs of the climate, current events, etc.

This is the natural process of knowledge acquisition. We’re learning more and more about how the planet works over time. The path, however, is not smooth. There are also periods when the knowledge in the scientific community or the public barely changes, or even goes in the wrong direction before jumping back onto an upward trajectory. There is plenty of evidence for brief periods of “negative learning” in the recent history, including scientific understanding of the causes of ozone destruction.

Years from now, we’ll look back at this temporary slowdown in the rate of surface temperature warming and shake our heads. This is a temporary landing in the middle of the stairwell of rising air temperatures and rising public acceptance of the magnitude of the human role in climate change.

More heat is going into the ocean. Really.

by Simon Donner

You may have heard climate scientists, myself included, state that “global warming” has indeed continued with little interruption over the past 10-15 years, but that more of the heat trapped in the climate system by greenhouse gases has been “going into the ocean”.

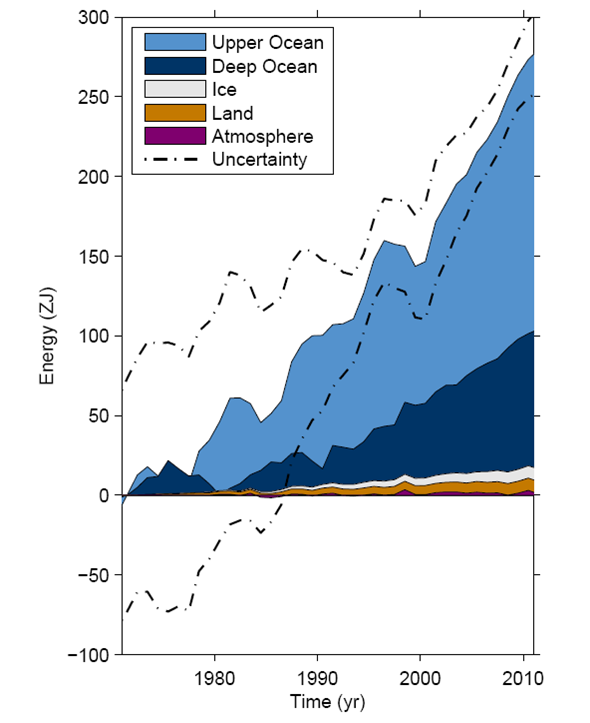
Change in energy content of different components of the climate system (IPCC, 2013)

This is not the rhetoric of irrational climate alarmists. This is what the measurements show.

The human enhancement of the greenhouse effect has reduced the outgoing radiation to space and increased the energy content of the climate system, as is shown on the graph to the right.

The best known manifestation of this energy budget change is the warming of the lower atmosphere: that excess radiant energy being converted into warmer air temperatures. However, in terms of the change in total energy, the famous change in the atmosphere (purple) pales in comparison to that of the oceans (light and dark blue).

It makes physical sense: the oceans are a big deep reservoir of a liquid with high heat capacity. A change in average ocean temperatures requires a lot more heat than an equivalent change in  average surface air temperatures.

The graph shows that >90% of the excess heat generated by enhancement of the greenhouse effect has gone into the oceans. Now, suppose that decade-scale natural variability in ocean circulation marginally increases the fraction going into the ocean (dark blue), say from 92% to 93%, at the expense of the atmosphere. You’d barely see it on the above graph, because the ocean slice is so big and the atmosphere slice is so small. But it would cause a noticeable change in the rate of atmospheric temperature increase.

Increased heating

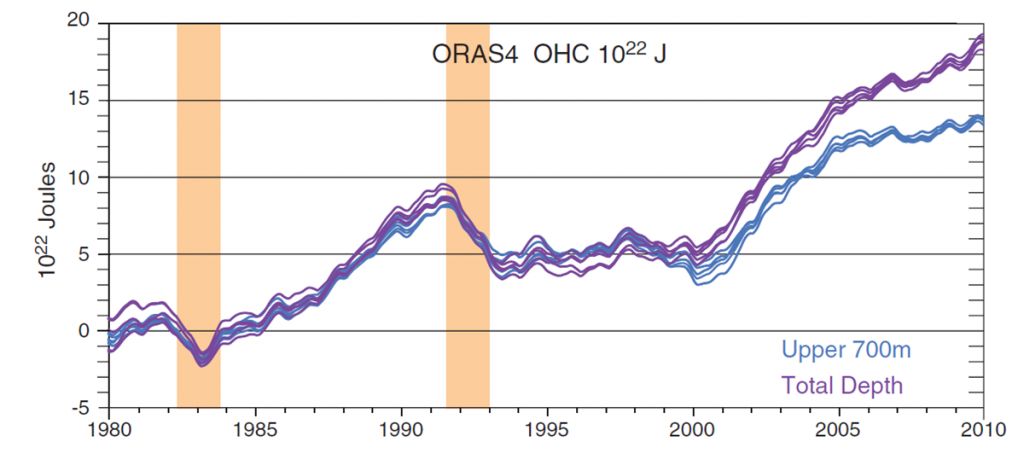
The ocean data suggests that has happened over the past 10-15 years. The next graph, from Trenberth and Fasullo (2013), depicts the change in ocean heat content only, expressed for the upper ocean (light blue) and the total depth of the ocean (purple).

This graph shows that in the late 1990s, right after the last strong El Nino event, ocean heat storage increased in part because ocean depths below 700 m began accumulating heat. The change in where heat is being accumulated was probably driven by the decade-scale variability in Pacific Ocean conditions.

Had this bump in ocean heat uptake happened when human activity was not warming the climate system overall, the global average surface air temperatures would have declined. The fact that the global surface temperature trend has been slightly positive since the late 1990s is a testament to the fact that human activity has been warming the whole climate system.

Of course, we don’t have gills. We all live on the surface. The most noticeable outcome to us air-breathers is the lack of those strong El Nino events since 1998. During a strong El Nino event, the equatorial Pacific Ocean essentially releases heat into the atmosphere (on net), driving changes in atmospheric circulation and weather around the world. In other words, as climate scientists are repeatedly trying to explain to the media, global warming has continued, but more of the heat has gone into warming the deep ocean.

It should then come as no surprise that climate scientists are so interested in when the Pacific Ocean pattern changes and/or the next strong El Nino event occurs. When that happens, maybe next year, maybe the year after, maybe four years from now, we’ll very likely to see new global surface temperature records and an end to the obsession with the supposed pause in “global” warming.

Next steps in the coverage of climate change: Vancouver Sun

by Simon Donner

I have an opinion piece in the Vancouver Sun responding to a deceptive column about climate change science and climate scientists published the previous week. My naïve hope in writing the piece was not to start a public fight (my twitter feed, and inbox are testaments to that naïveté). Rather it was to help end a public fight, by encouraging people, particularly newspaper editors, to ignore the misleading rhetoric of organized “contrarian” movement and move on to writing more about addressing climate change.

The problem with the public conversation about climate change is that not everyone plays by the same rules.

The majority of scientists follow the scientific method — a systematic approach to building knowledge. Starting in the 1820s, scientists began accumulating evidence, through the slow process of hypothesis testing and data collection, that adding carbon dioxide and other heat-trapping greenhouse gases to the atmosphere would warm the planet.

See the Sun for the rest of the article.