by Christopher Quick
Unless you are Fox News’ Bill O’Reilly, you probably know that rise and fall of the tides are driven by the forces of Sun, Moon and Earth’s rotation. In the time frame of our lives these forces stay pretty much the same.
Recent modelling studies like Pickering et al., 2012, however, have shown that things may not be so simple. There is good reason to believe that the behaviour of the tides will change as the climate continues to warm and the seas continue to rise.
The difference between water levels at the high and low tides is called the tidal amplitude. If the tidal amplitude were to increase then the threat of flooding would also increase. This becomes even more significant when you consider that if a storm hits during a high tide, the storm surge could be very damaging. That was the case with Hurricane Sandy’s large storm surge; Hurricane Sandy struck the New Jersey / New York City region during a spring tide, when we observe the very highest tides of the month. Sea level rise contributed to Sandy’s large storm surge, although probably only by a few extra centimetres.
The impact of sea level rise on tidal amplitude could be much greater in some locations because of the local bathymetry and water dynamics. In a modelling study of NW Europe, Pickering et al. project increase in tidal amplitude of up to 35 cm in certain areas with 2 meters of global sea level rise. These forecasts are for the “M2 tide”, the tide that varies on a 12 hour cycle and gives us the usual high and low tide levels. The periodic high spring tides would see even greater change in tidal amplitude with rising sea levels.
Other areas would get relief due to changing tides. For example, Newport, UK was modelled to have the range between high and low tides drop by 39 cm under a 2 m sea level rise. The largest change in tidal amplitude was at St. Malo in France, where a 49 cm decrease in amplitude is projected.
The project changes in tidal amplitude is good news for some areas since a reduction in the maximum height of the tide can help reduce the threat of rising seas. On the other hand, some areas would see increases in flood risk if this model is correct. Under a 10 metre sea level rise, tides could change in amplitude by about one metre relative to what we observe today. Granted, it is unlikely, but not impossible, that we will see a 2 metre rise by the end of the century, let alone 10 metres (at the upper-bound of models in the last IPCC report was about 1 metre by 2100). Sea level is likely to rise by 1-3 metres by the end of the 23rd century without any efforts to slow climate change.
Now a little bit of physics…
There are a few reasons why raising the sea level – and changing the water depth – could alter how tides behave. One is the physics of tides, which you can think of as slow, broad waves. Waves curl because the bottom of the moving water is slowed by friction as it enters shallow water while the top continues at the same speed and rolls over. For similar reasons, as you increase sea levels in previously shallow areas, the friction between the water and the ocean bottom is reduced so the waves reach greater heights than they would previously.
Another reason for the change in tidal amplitude is the interaction between the shape of our shoreline and the tide “waves”. In some situations waves achieve resonance, or a state where waves interact in such a way to make the waves bigger. This is why you see the world’s largest tidal amplitude in Canada’s Bay of Fundy. Sea level rise can impact resonance in two ways. First, as sea levels change, the points from which the tide waves appear to be generated from can shift. Second, the speed of waves can change, which alters how waves enter the bay and interact with each other. Both of these reasons lead to a change in resonance and either higher or lower tidal ranges.
So all in all, this is something else to consider when deciding how to respond to or minimize the effects of sea level rise. Pickering et al. point out how this information should be considered when building adaptation infrastructure like sea walls or even in renewable energy projects like tidal power.
Reference: Pickering, M.D., Wells, N.C., Horsburgh, K.J. and Green, J.A.M. 2012. The impact of future sea-level rise on the European Shelf tides. Continental Shelf Research, 35.
 “Since the start of the industrial revolution, mankind has been burning fossil fuel (coal, oil, etc.) and adding its carbon to the atmosphere as carbon dioxide. In 50 years or so this process, says Director Roger Revelle of the Scripps Institution of Oceanography, may have a violent effect on the earth’s climate…
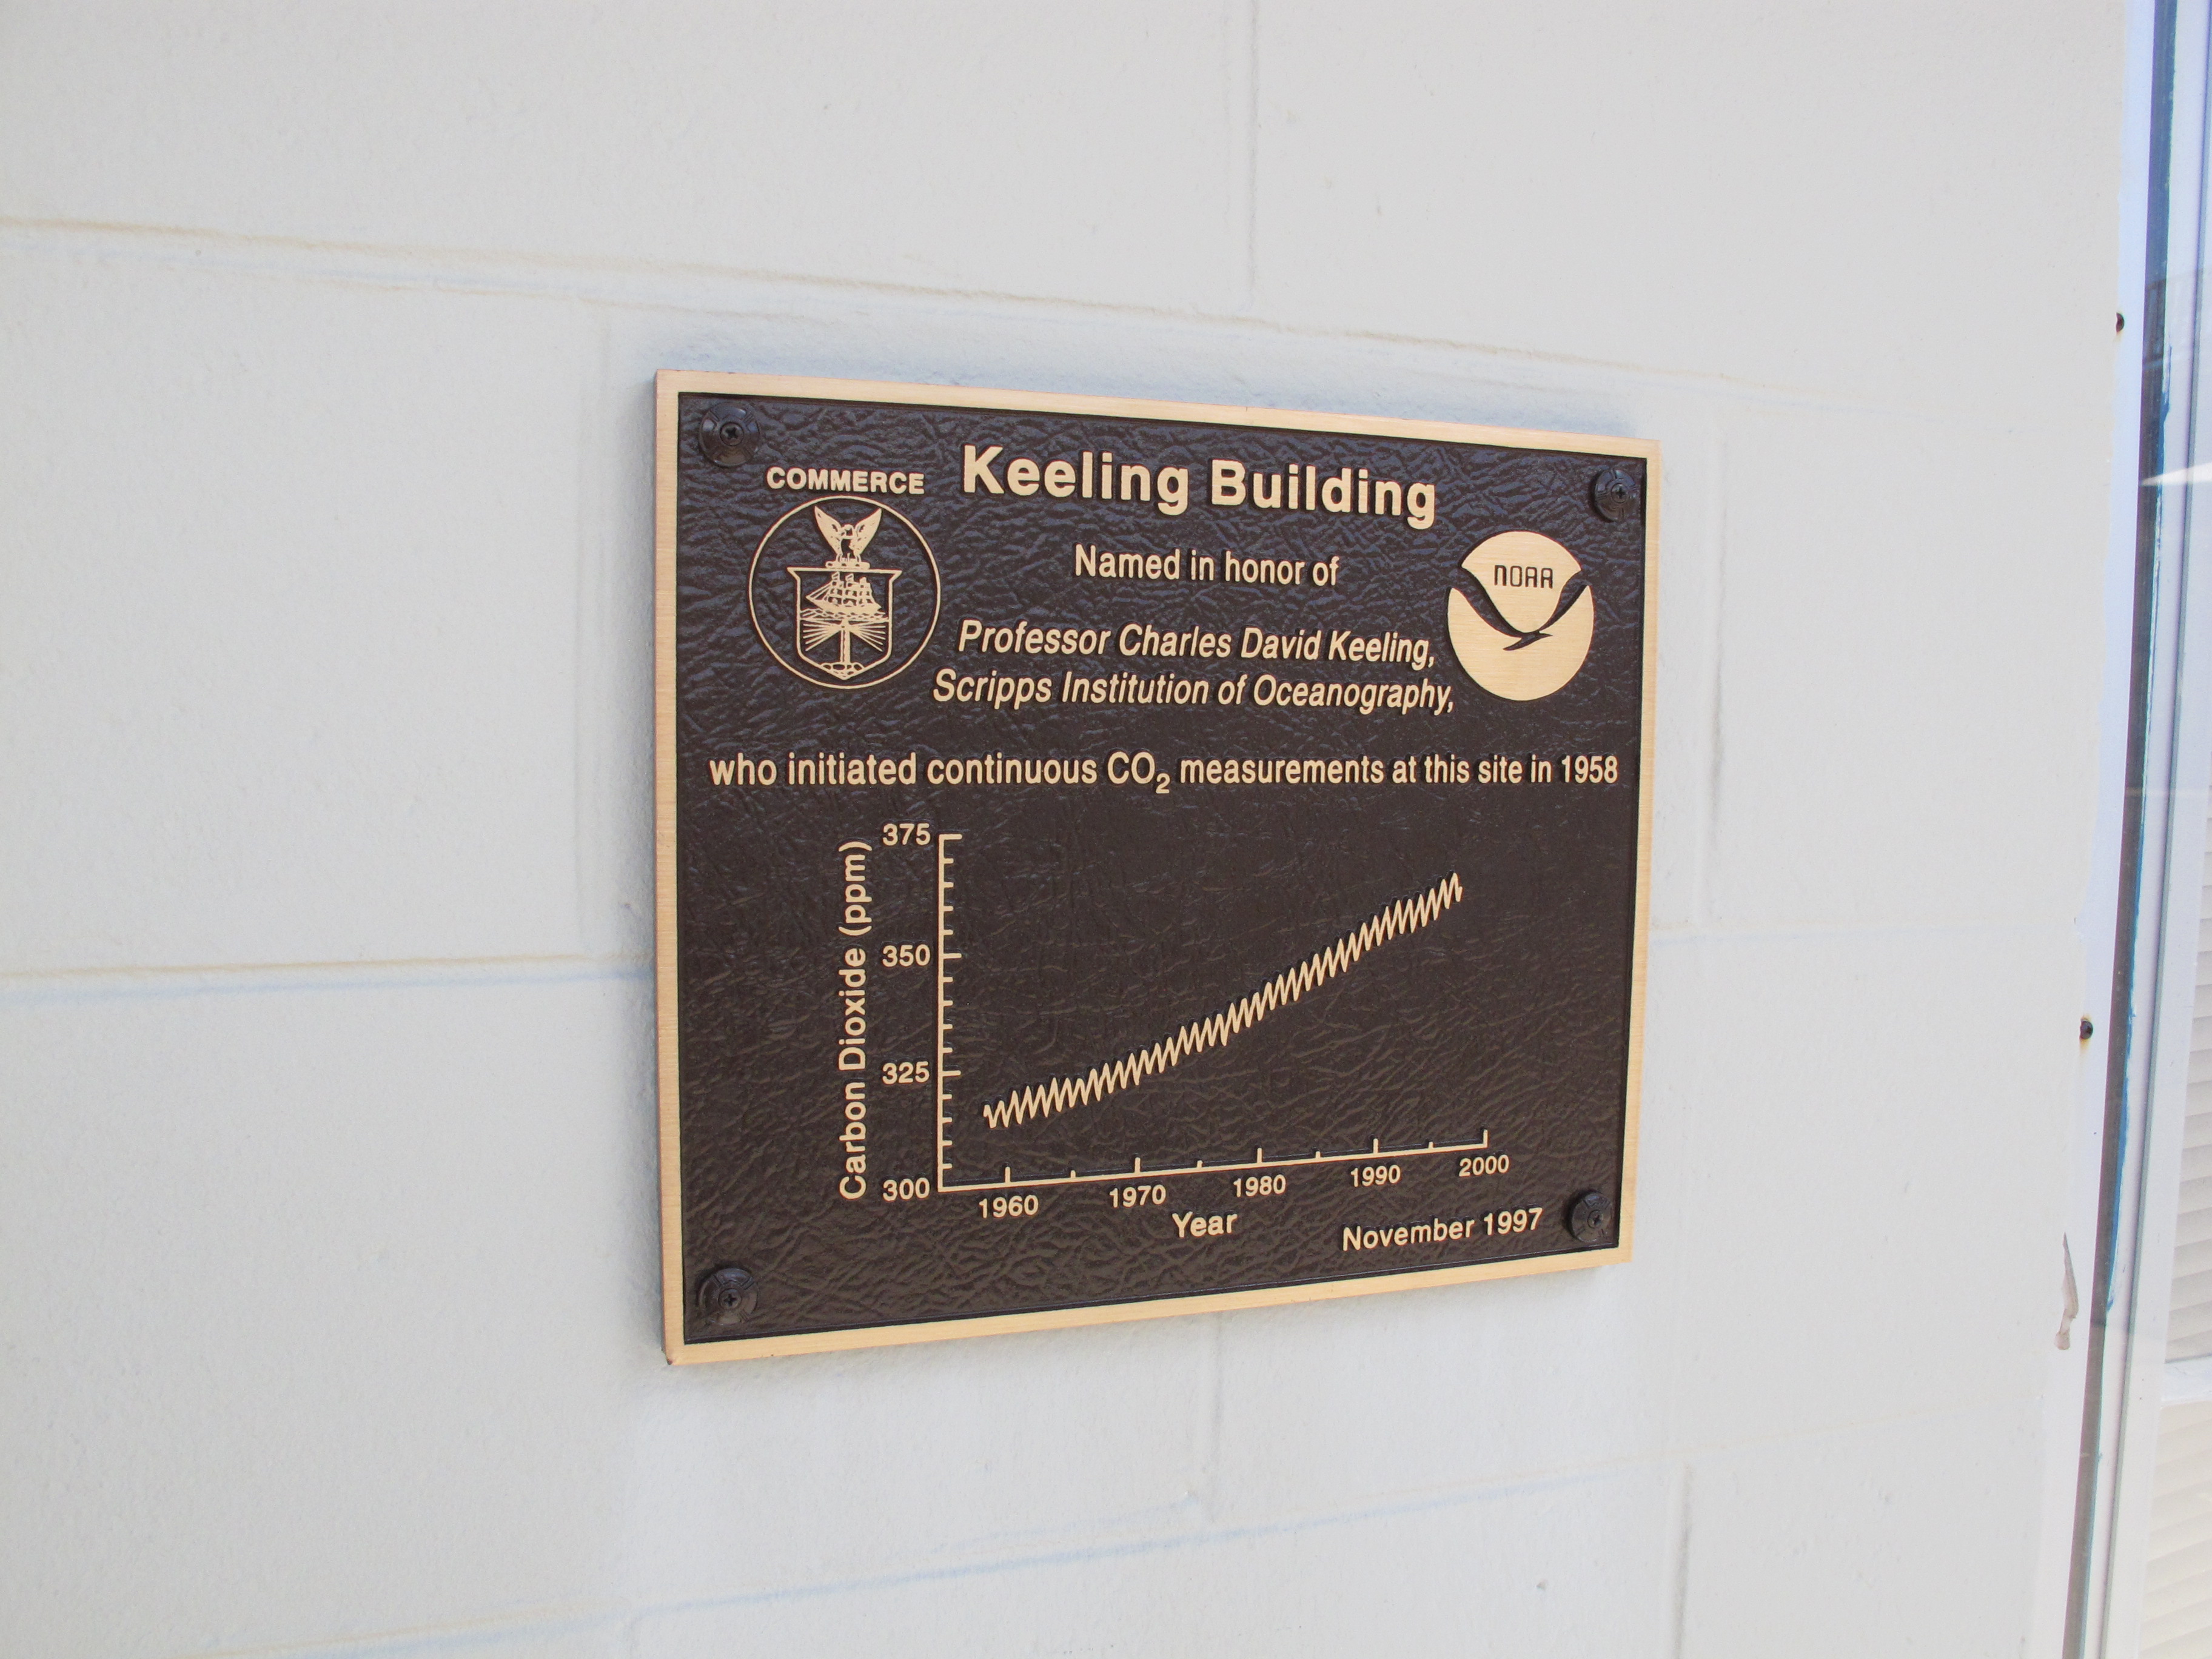 studied, they may be able to predict whether man’s factory chimneys and auto exhausts will eventually cause salt water to flow in the streets of New York and London.”