by Simon Donner
You may have heard climate scientists, myself included, state that “global warming” has indeed continued with little interruption over the past 10-15 years, but that more of the heat trapped in the climate system by greenhouse gases has been “going into the ocean”.

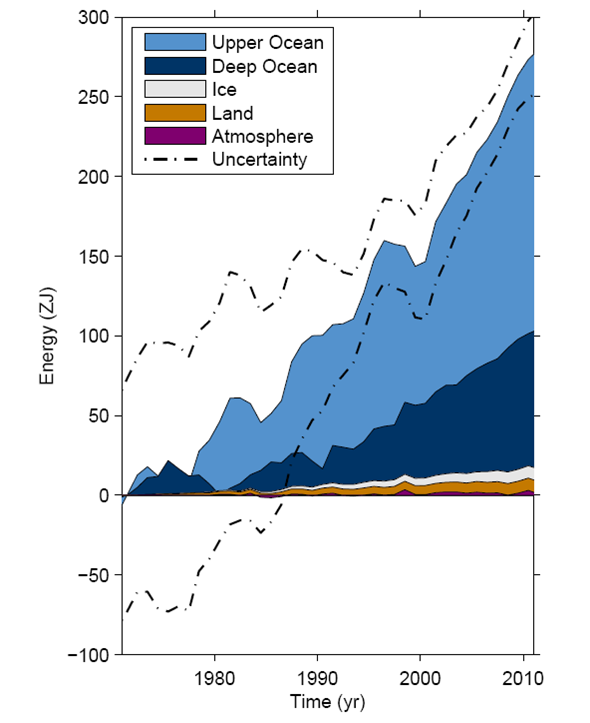
Change in energy content of different components of the climate system (IPCC, 2013)
This is not the rhetoric of irrational climate alarmists. This is what the measurements show.
The human enhancement of the greenhouse effect has reduced the outgoing radiation to space and increased the energy content of the climate system, as is shown on the graph to the right.
The best known manifestation of this energy budget change is the warming of the lower atmosphere: that excess radiant energy being converted into warmer air temperatures. However, in terms of the change in total energy, the famous change in the atmosphere (purple) pales in comparison to that of the oceans (light and dark blue).
It makes physical sense: the oceans are a big deep reservoir of a liquid with high heat capacity. A change in average ocean temperatures requires a lot more heat than an equivalent change in average surface air temperatures.
The graph shows that >90% of the excess heat generated by enhancement of the greenhouse effect has gone into the oceans. Now, suppose that decade-scale natural variability in ocean circulation marginally increases the fraction going into the ocean (dark blue), say from 92% to 93%, at the expense of the atmosphere. You’d barely see it on the above graph, because the ocean slice is so big and the atmosphere slice is so small. But it would cause a noticeable change in the rate of atmospheric temperature increase.

Increased heating
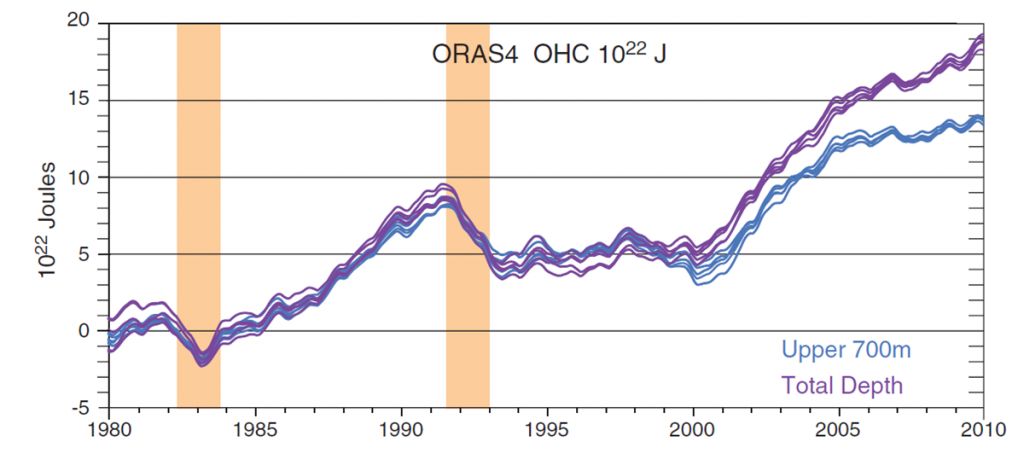
The ocean data suggests that has happened over the past 10-15 years. The next graph, from Trenberth and Fasullo (2013), depicts the change in ocean heat content only, expressed for the upper ocean (light blue) and the total depth of the ocean (purple).
This graph shows that in the late 1990s, right after the last strong El Nino event, ocean heat storage increased in part because ocean depths below 700 m began accumulating heat. The change in where heat is being accumulated was probably driven by the decade-scale variability in Pacific Ocean conditions.
Had this bump in ocean heat uptake happened when human activity was not warming the climate system overall, the global average surface air temperatures would have declined. The fact that the global surface temperature trend has been slightly positive since the late 1990s is a testament to the fact that human activity has been warming the whole climate system.
Of course, we don’t have gills. We all live on the surface. The most noticeable outcome to us air-breathers is the lack of those strong El Nino events since 1998. During a strong El Nino event, the equatorial Pacific Ocean essentially releases heat into the atmosphere (on net), driving changes in atmospheric circulation and weather around the world. In other words, as climate scientists are repeatedly trying to explain to the media, global warming has continued, but more of the heat has gone into warming the deep ocean.
It should then come as no surprise that climate scientists are so interested in when the Pacific Ocean pattern changes and/or the next strong El Nino event occurs. When that happens, maybe next year, maybe the year after, maybe four years from now, we’ll very likely to see new global surface temperature records and an end to the obsession with the supposed pause in “global” warming.


