Before beginning my analysis, I wanted to examine the spatial distribution of the mental health care sites. In the map below, the mean centre and standard deviation elipse (1 standard deviation) is displayed. All but four sites are located within one standard deviation of the mean centre. I used a Nearest Neighbour analysis to determine the mean distance (816.216 m), the expected mean distance (846.984 m), Nearest Neighbour Ratio (0.964), and Z Score (-0.332). Click here to see the Nearest Neighbour output report.
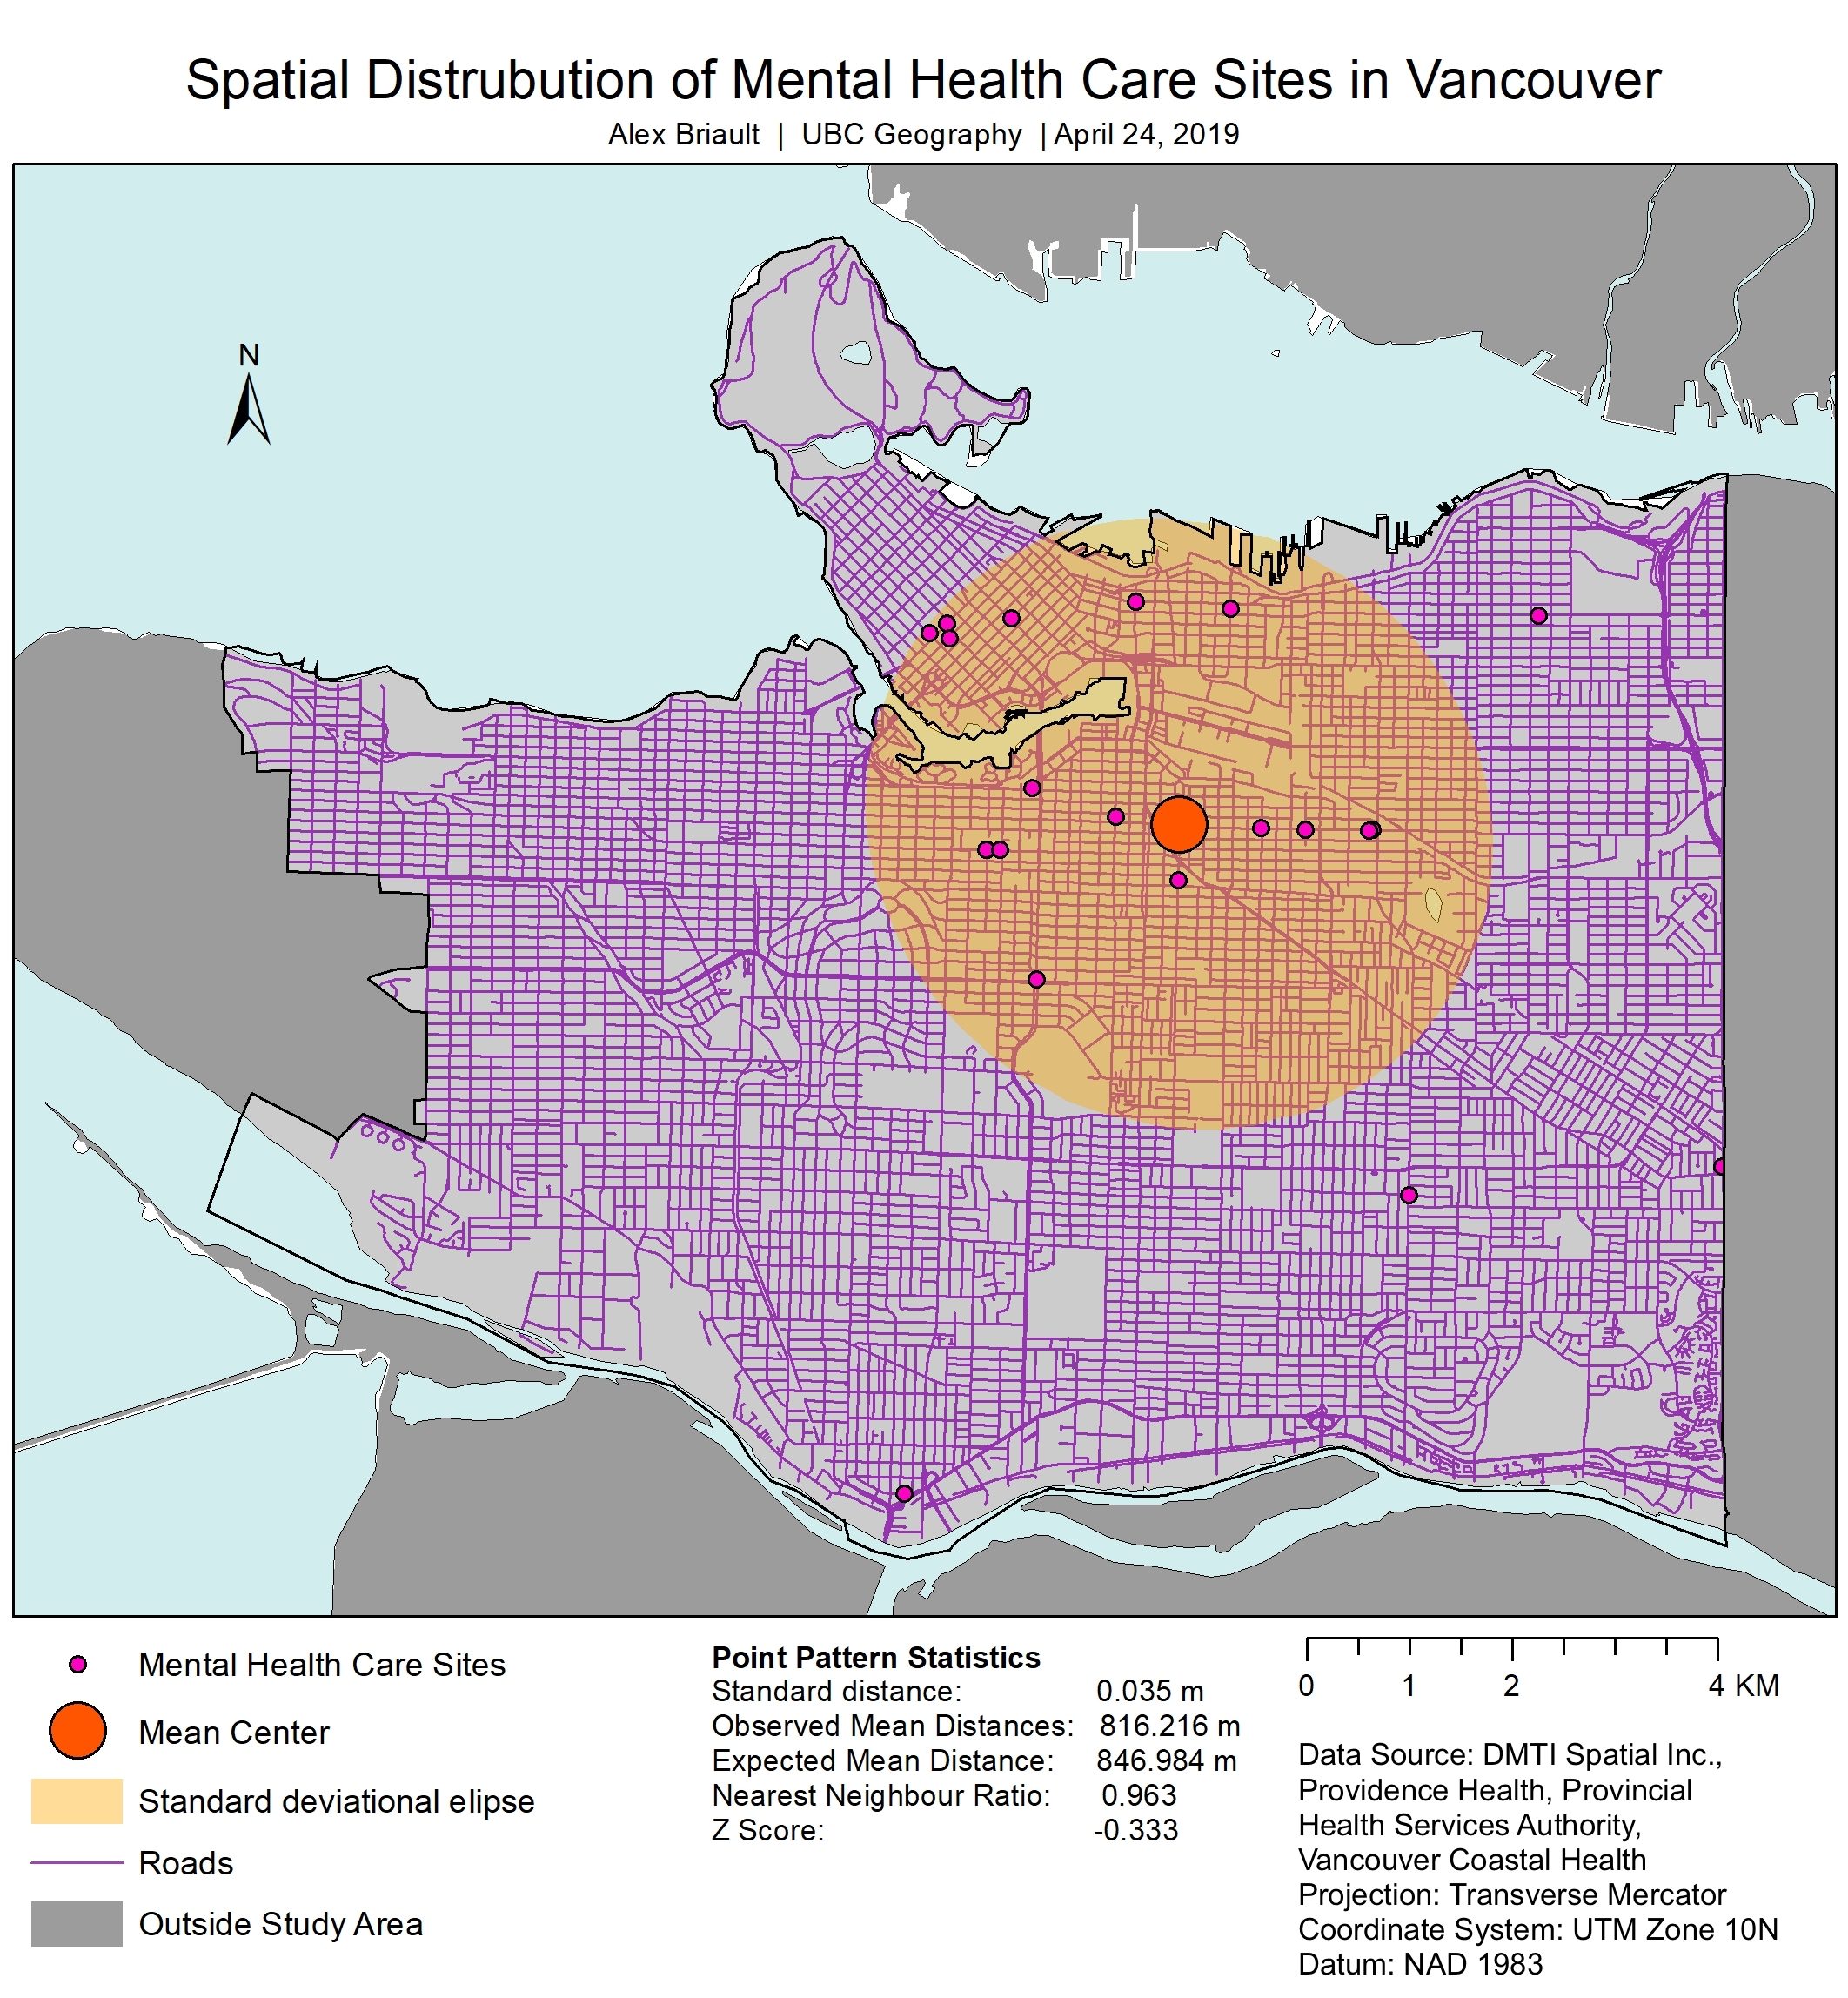
Figure 2: Spatial distribution of mental health care sites in Vancouver.
This analysis relied on two methods: road network analysis using ArcMap’s Network Analyst and a Two-Step Floating Catchment Area (2SFCA) analysis. The road network analysis was necessary before completing the 2SFCA analysis.
Network Analysis
The road network analysis was completed by creating service areas for each mental health site and for the centroid of each dissemination area at distances of 500 m, 1 km, 2.5 km, and 5 km. Each service area resulted in a polygon encompassing the required area. As this project originally intended to look at Vancouver, Burnaby, New Westminster, UBC, and Richmond, below is the network analysis map showing distances of 500 m to 10 km for the original study region. Based on this map, there are few areas within the region that are not within 10 km by road of a mental health site. As the focus of this study was on mental health care sites accessible to the general public with BC MSP coverage (i.e., possessing a valid Care Card or Personal Health Number), student mental health services located at post secondary institutions (e.g., UBC, SFU, Langara…) were not included.
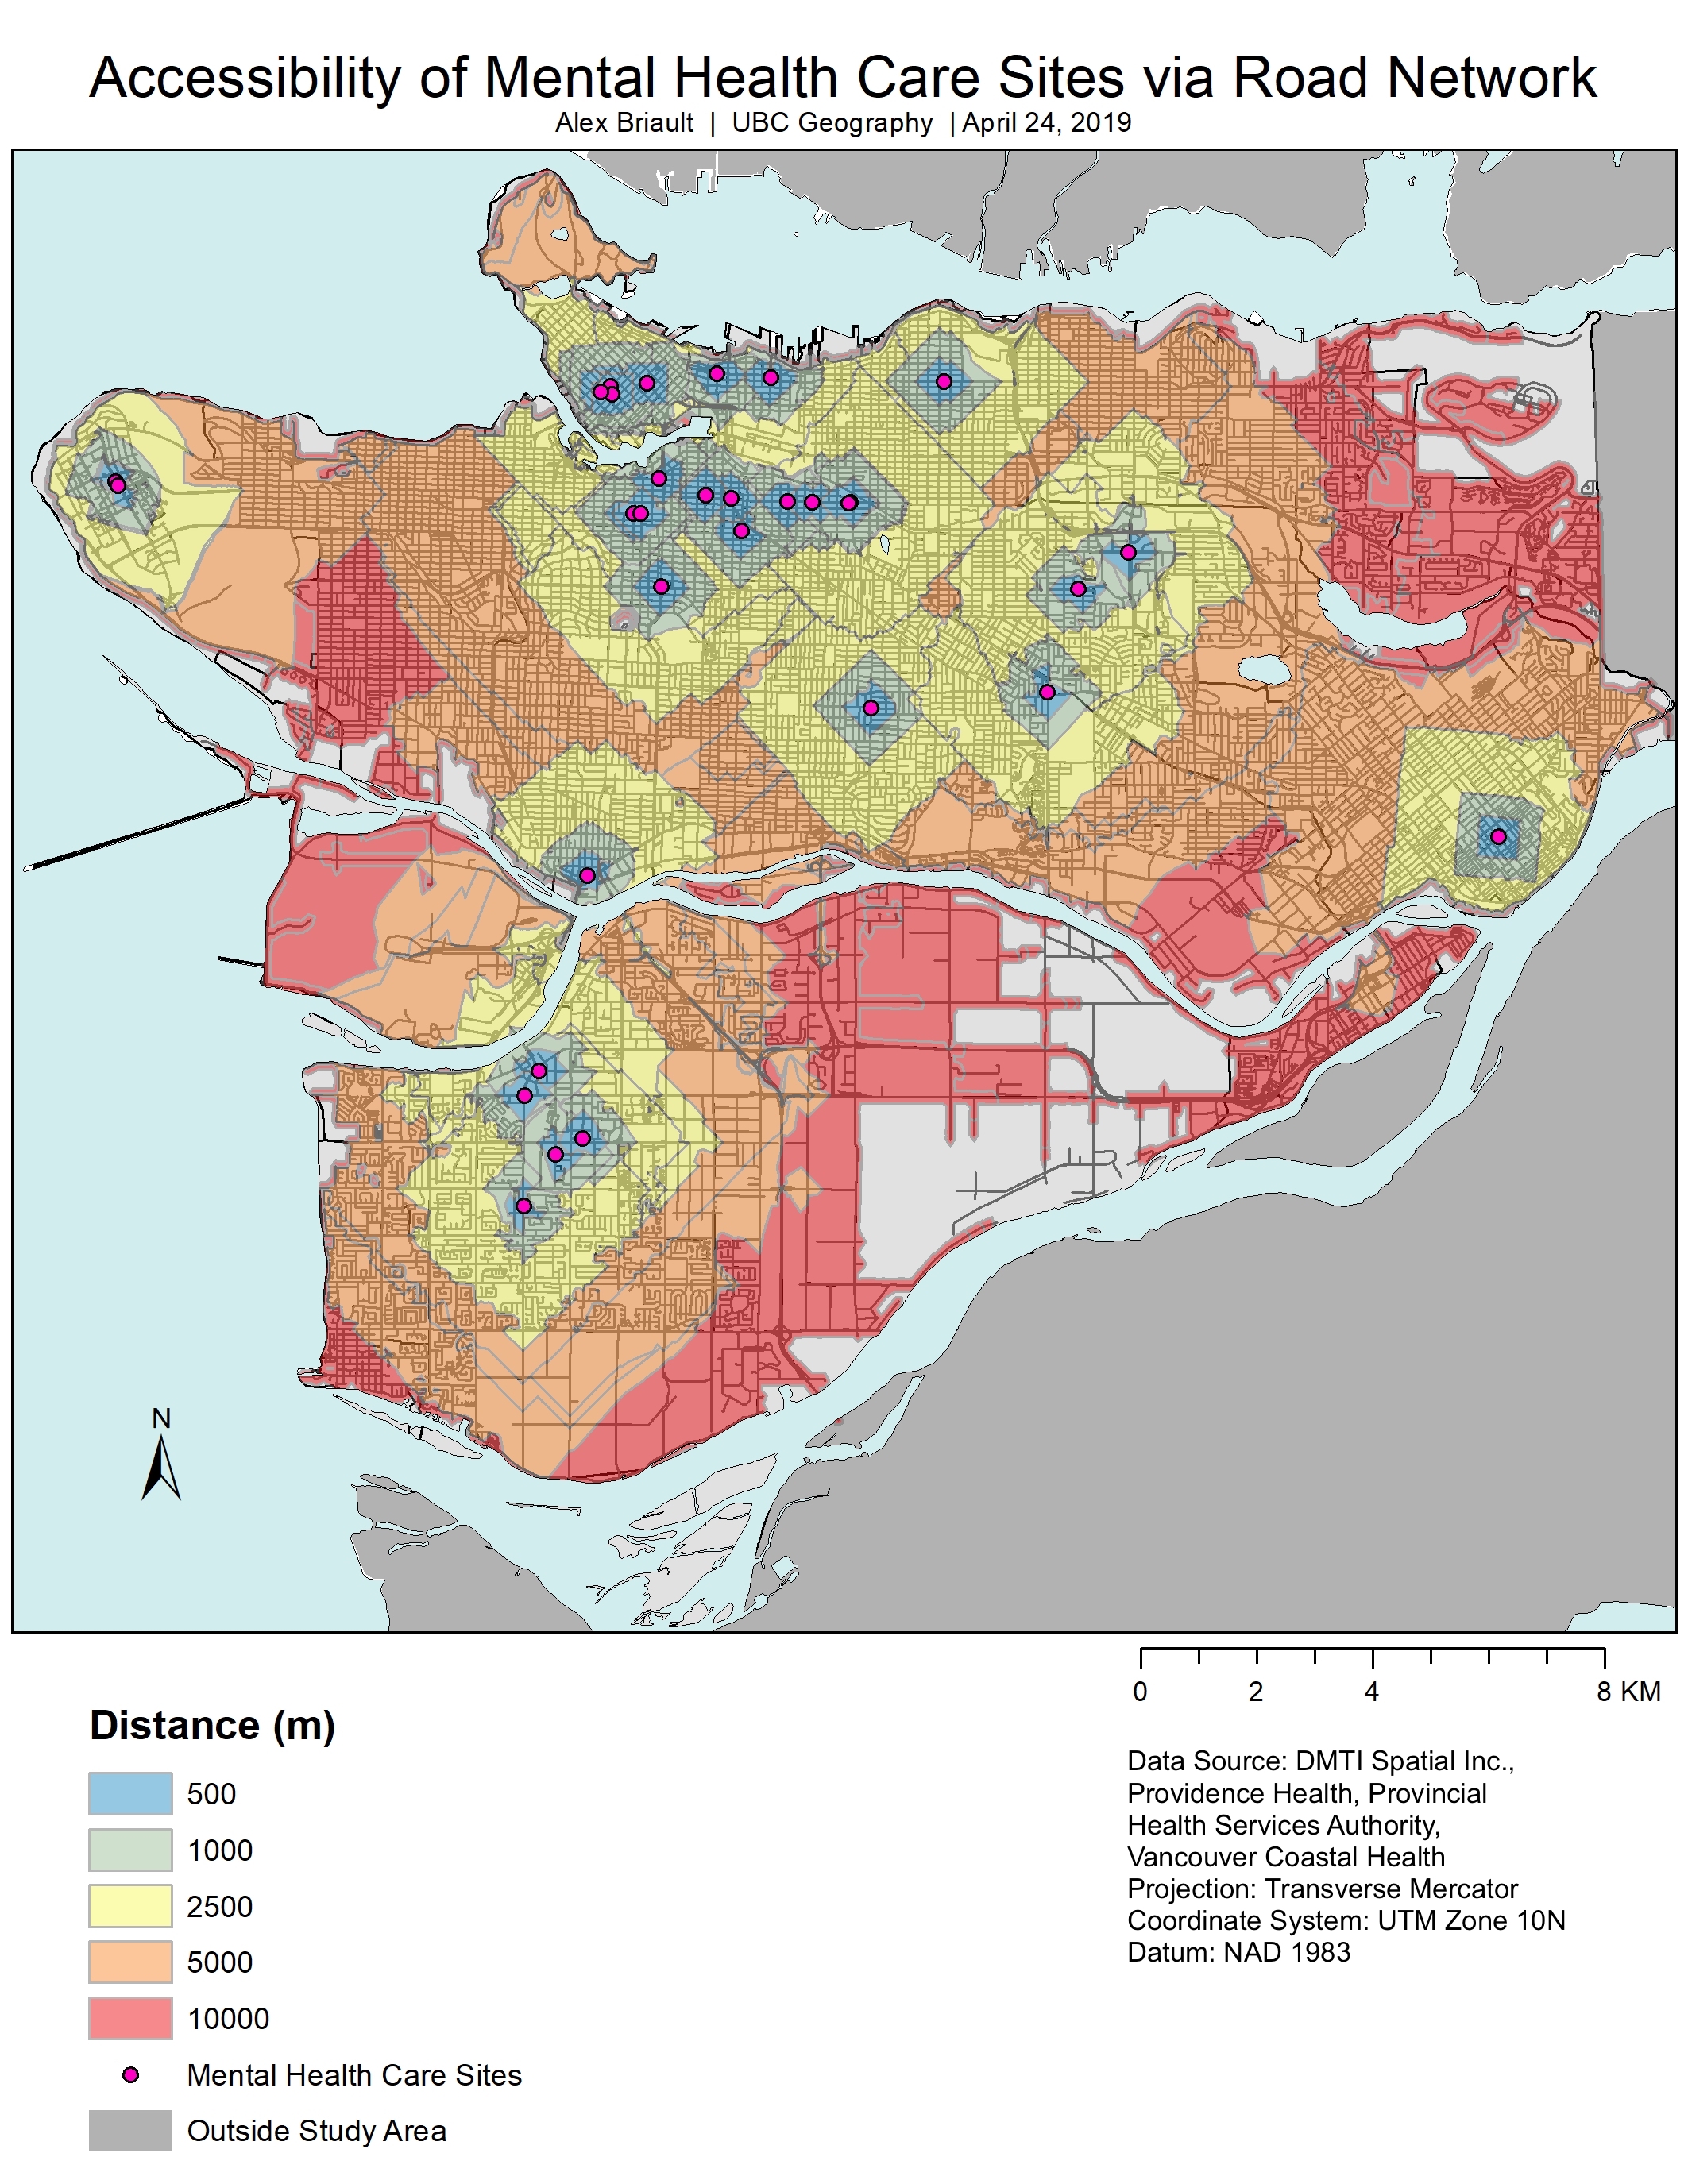
Figure 3: Accessibility of mental health care sites by road network for Vancouver, Burnaby, New Westminster, Richmond, and UBC.
After narrowing the scope of the project to only Vancouver, I created a similar service map showing accessibility by road network at distances of 500 m to 5 km from the mental health care sites. The results of this network analysis are not surprising given the spatial distribution of sites in Figure 2 showing that most sites are located towards the centre of the map and none exist on the west side of the city.
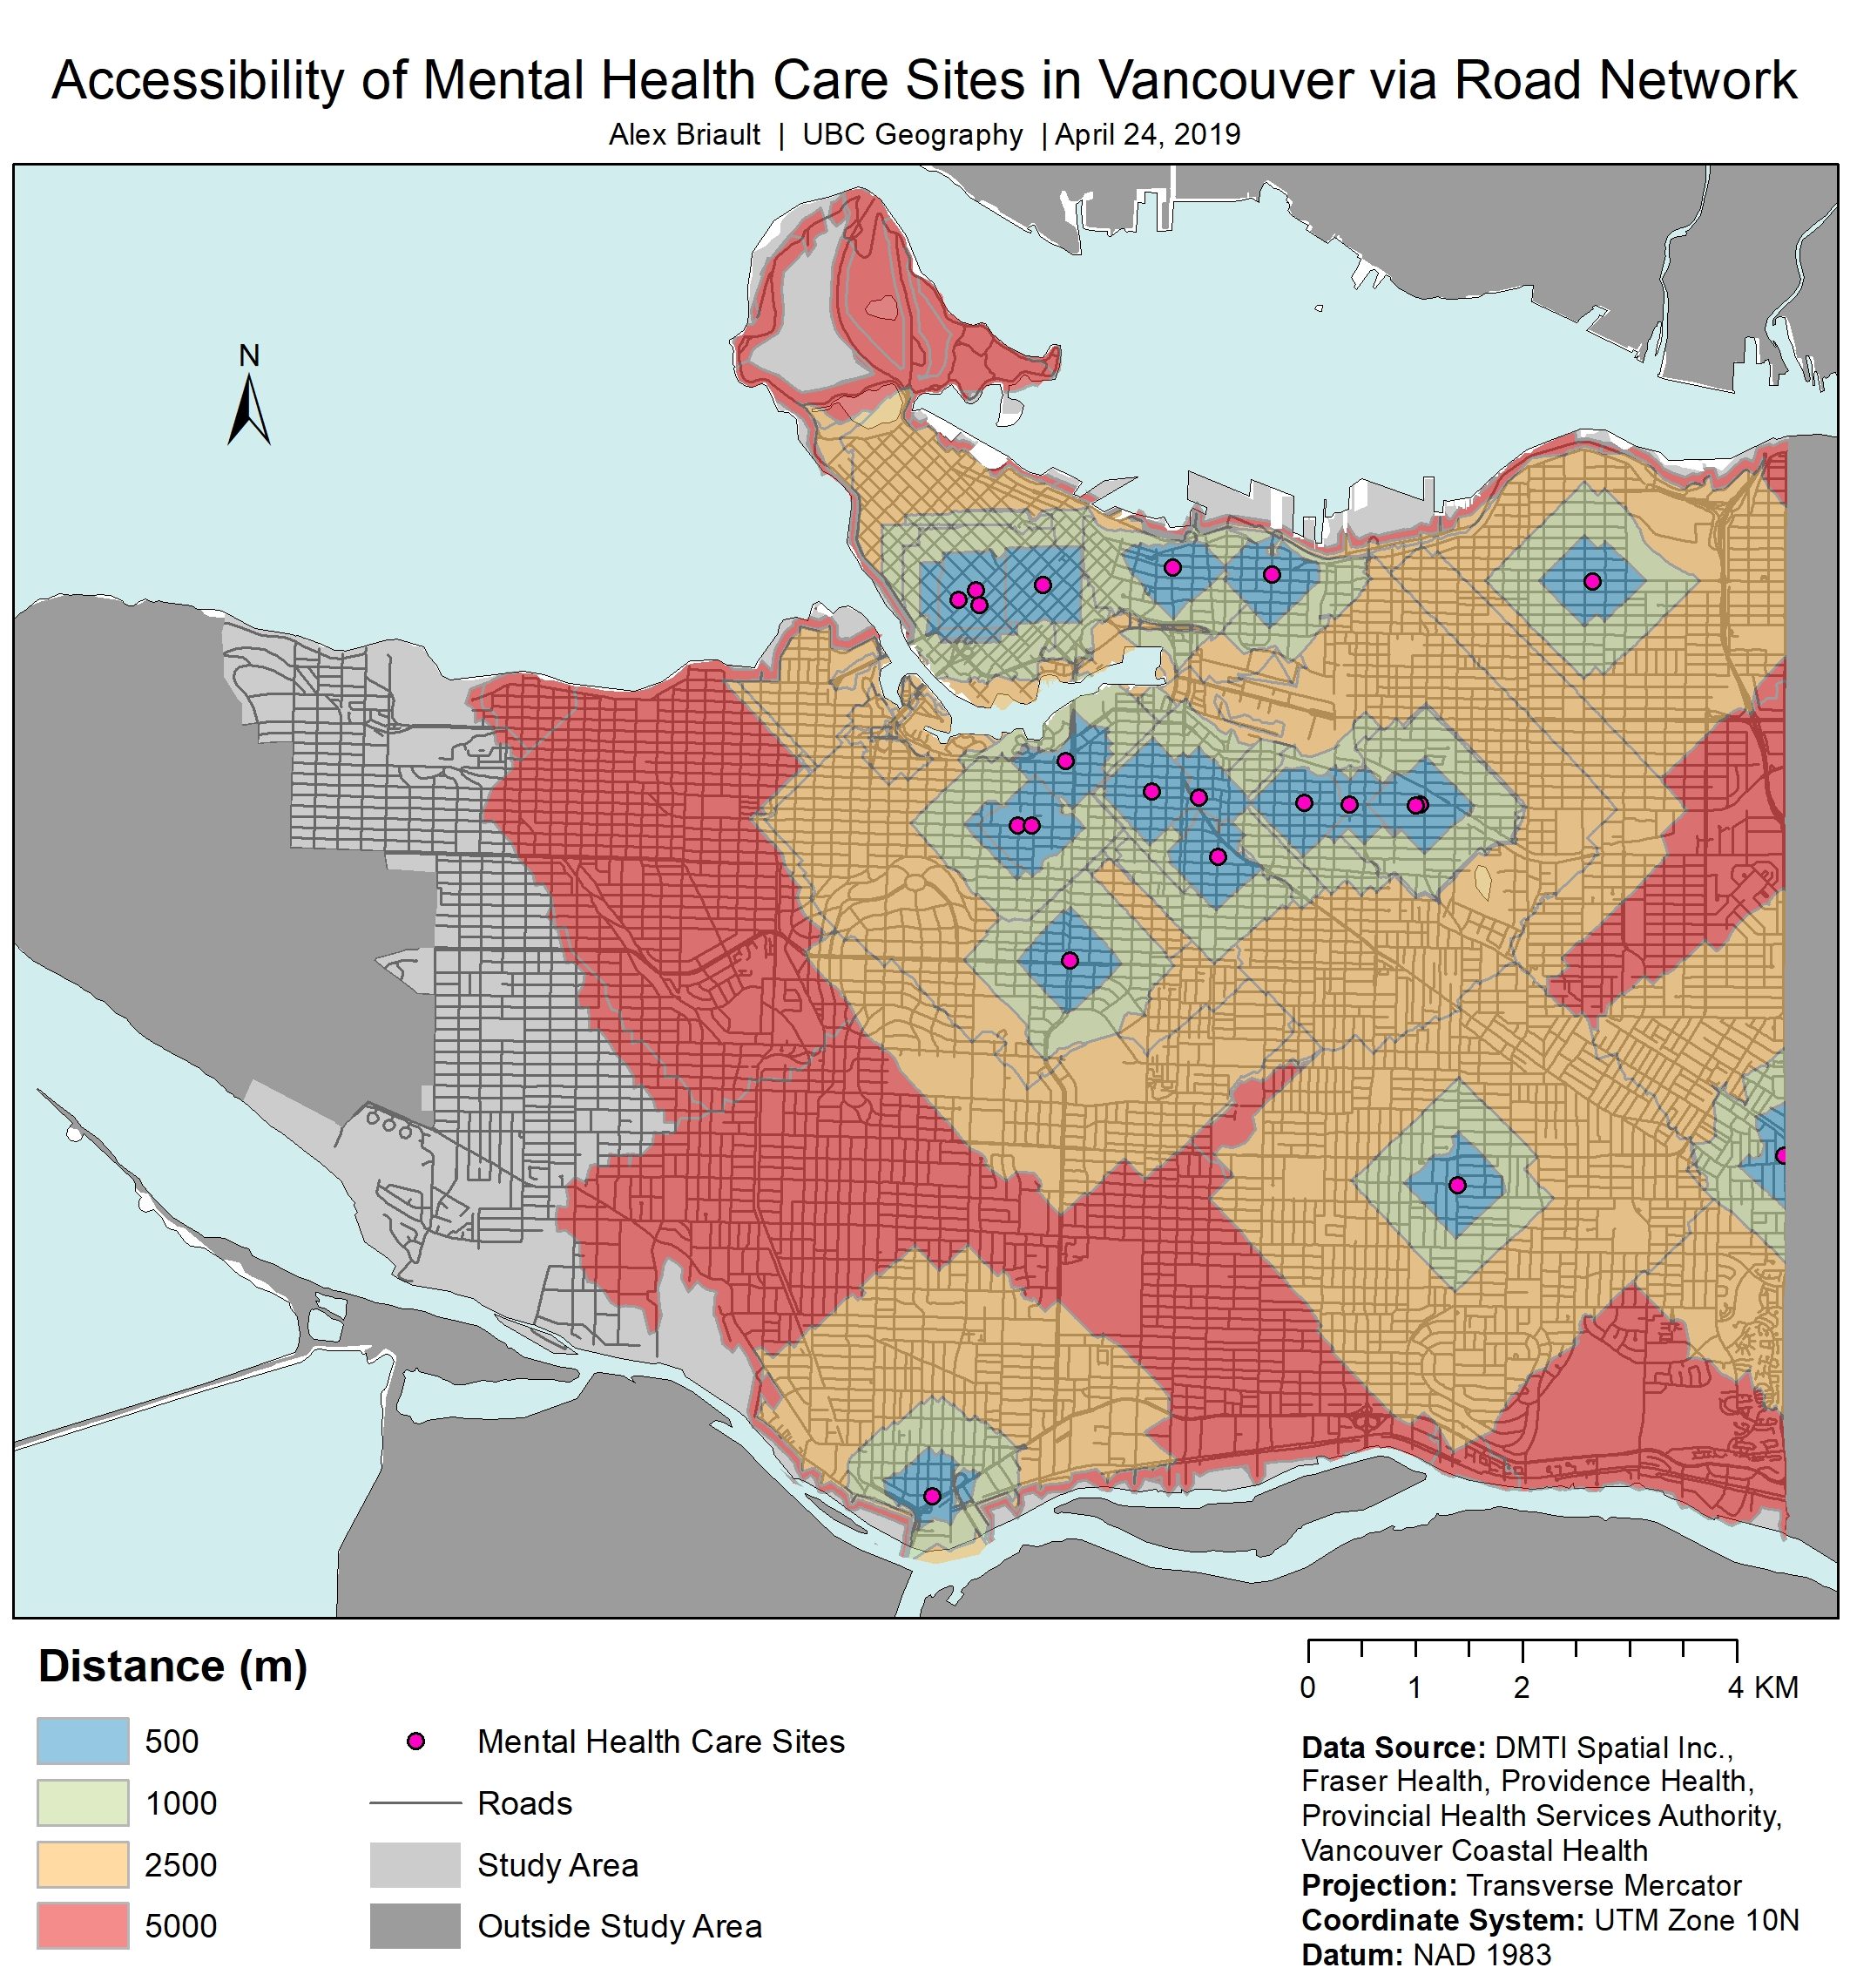
Figure 4: Accessibility of mental health care sites by road network for Vancouver.
2SFCA
Before beginning this step, all mental health sites needed to have a capacity assigned. Because health care data can be difficult to access in BC and because capacity information was generally only available for in-patient care sites (i.e., the number of beds available), I chose to set the capacity at 250 for each site. This has undoubtedly influenced my results but this analysis would easily be replicated with the actual site capacity numbers if ever available.
Using the 2SFCA analysis allows for both the supply and demand to be considered (Ngamini Ngui & Vanasse, 2012). Three parameters are needed to perform this analysis: the supply (the mental health sites), the demand (the population of each DA), and the accessibility measure (road network analysis) (Ngamini Ngui & Vanasse, 2012). By searching the Providence Health, Provincial Health Services Authority, and Vancouver Coastal Health sites, a list of 23 mental health care sites was compiled (click here for site list). The City of Vancouver is 119.32 km2 and contains 996 DAs with populations ranging from 68 to 8778 in each (mean of 636) and a total population of 633,138.
The first step of the 2SFCA analysis is to calculate the accessibility score for each mental health site. This is done by using ArcMap’s spatial join to join the mental health site distance polygon (500m 1000m, 2500m, 5000m) and the DA centroid point layers. The mental health site distance polygons were exported from the network analyses layers to their own catchment area layers (see Figure 5 for an example of this output showing the 500 m catchment for the DAs). Before starting the spatial join, it is necessary to calculate the provider to population ratio and this is done using the field calculator within the attributes table and dividing site capacity by population of each DA. The spatial join layer is then joined to the mental health sites layer and exported as a new layer: the first catchment area. This step was done for each distance threshold resulting in 4 separate polygon layers representing the mental health catchment areas at 500 m, 1 km, 2.5 km, and 5 km.
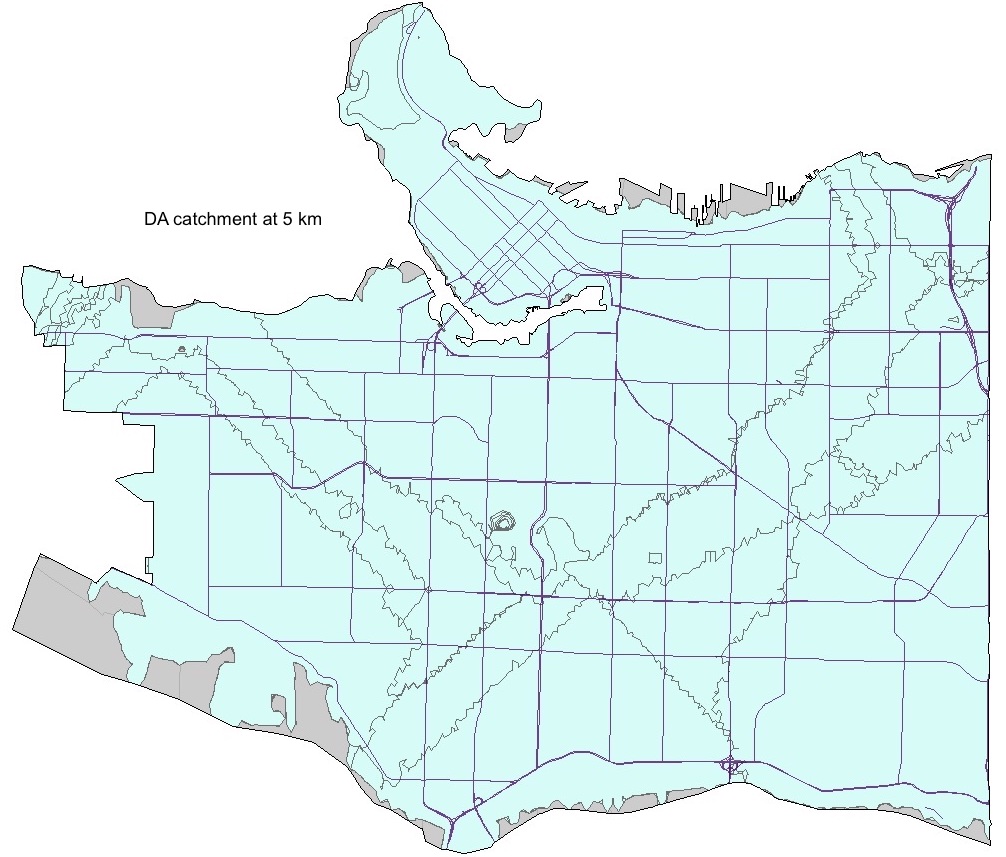
Figure 5: Sample catchment area showing 5 km catchment of DAs.
The second step is done in roughly the same manner as the first but instead of using the mental health sites to create the distance polygons, the DA centroids are used. The centroid of each DA was calculated using ArcMap and was set so that each centroid would be entered within the DA. This resulted in 996 polygons for each of the 4 distance thresholds. The DA centroid polygons were then joined via spatial join to the layer with the mental health provider to population score and then this data is symbolized on the map.
For a thorough explanation of how 2SFCA works and is completed, see here.