Accessibility was assessed at four distances: 500 m, 1 km, 2.5 km, and 5 km. As is visible in the four maps below, the overall accessibility of mental health in Vancouver is very poor. The greatest levels of accessibility are predominantly within the standard deviation ellipse at all distance thresholds. The table below shows the results of the accessibility analyses. Predictably, the accessibility score is highest at the 500 m distance and decreases at the distance increases. Scores do not improve as the catchment area increases because while a larger catchment area means there are more services , it also means that there are more people attempting to access these services.
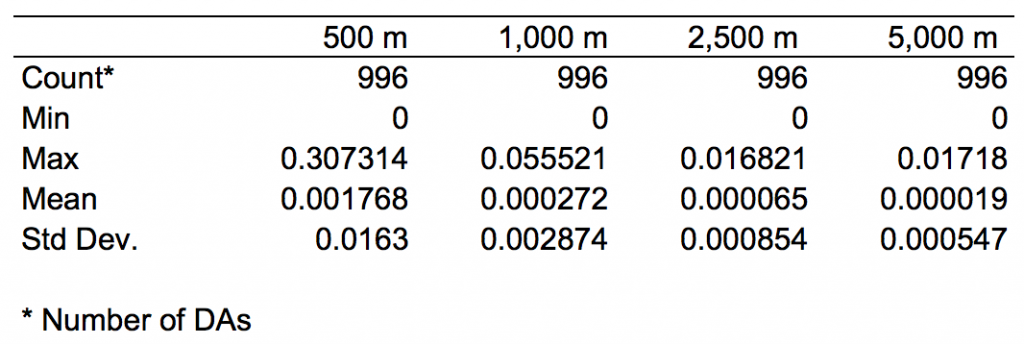
Table 1: Results of accessibility scores across distance thresholds
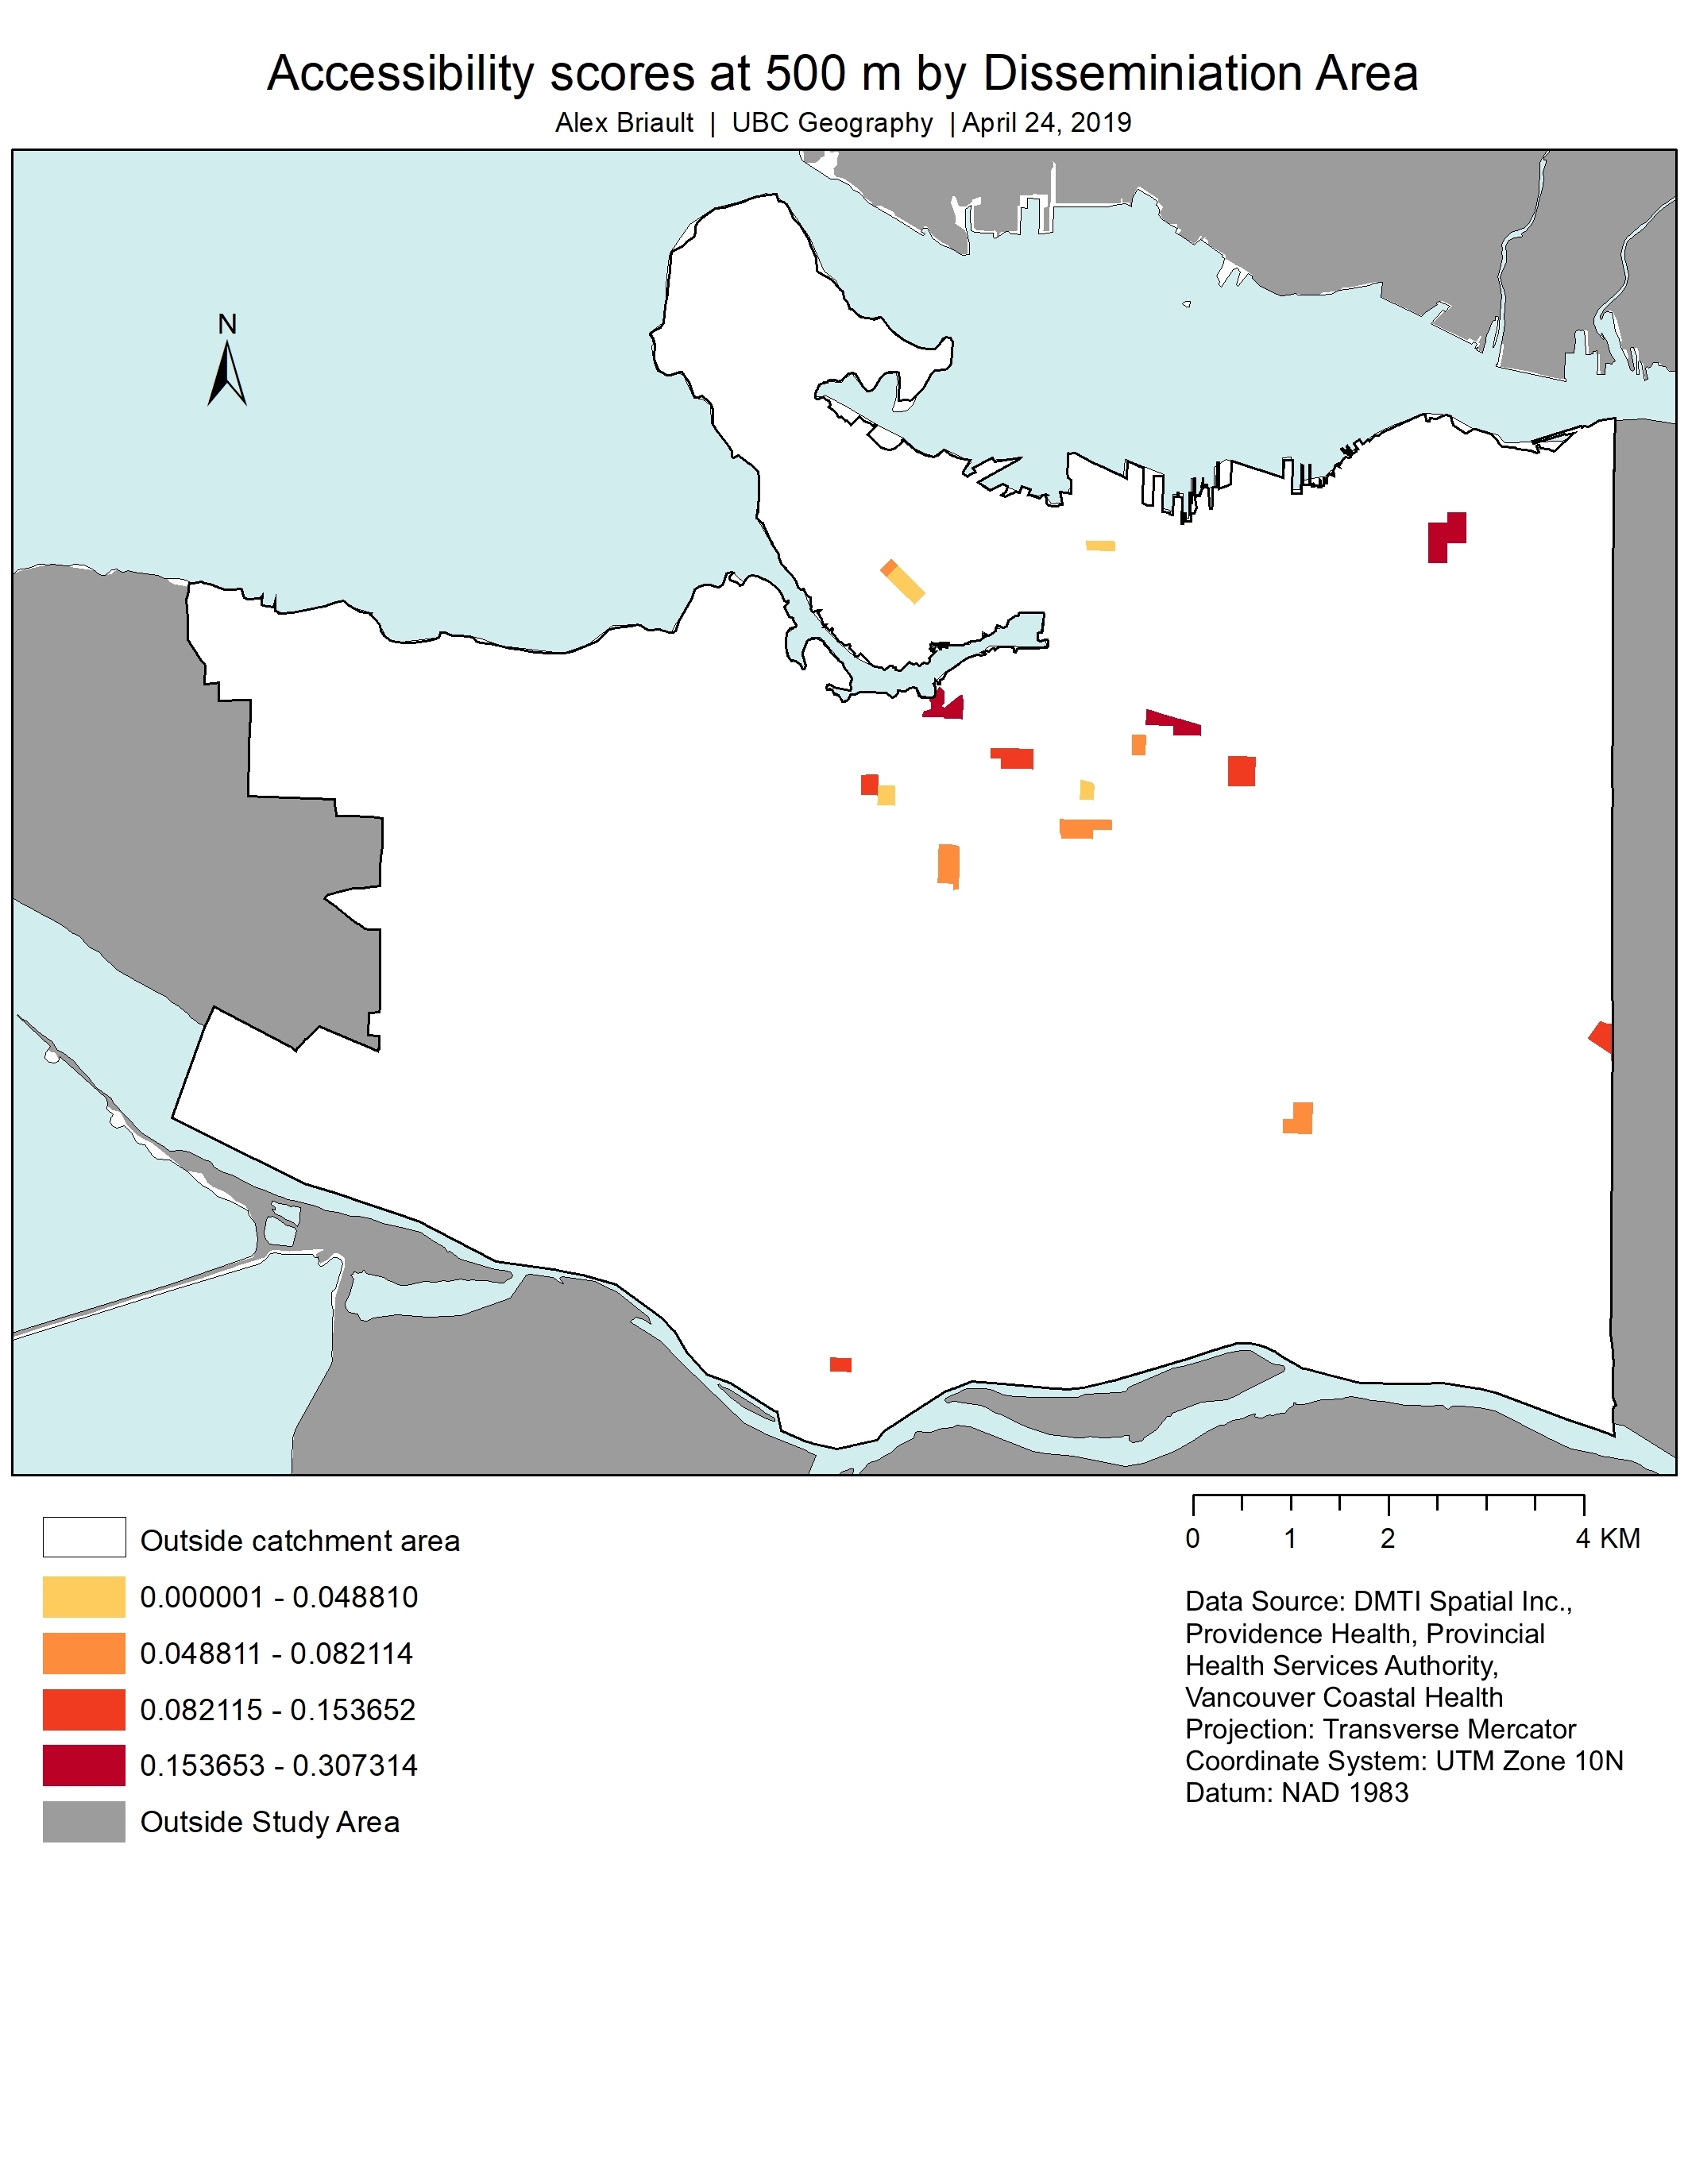
Figure 6: Accessibility Scores at 500 m distance
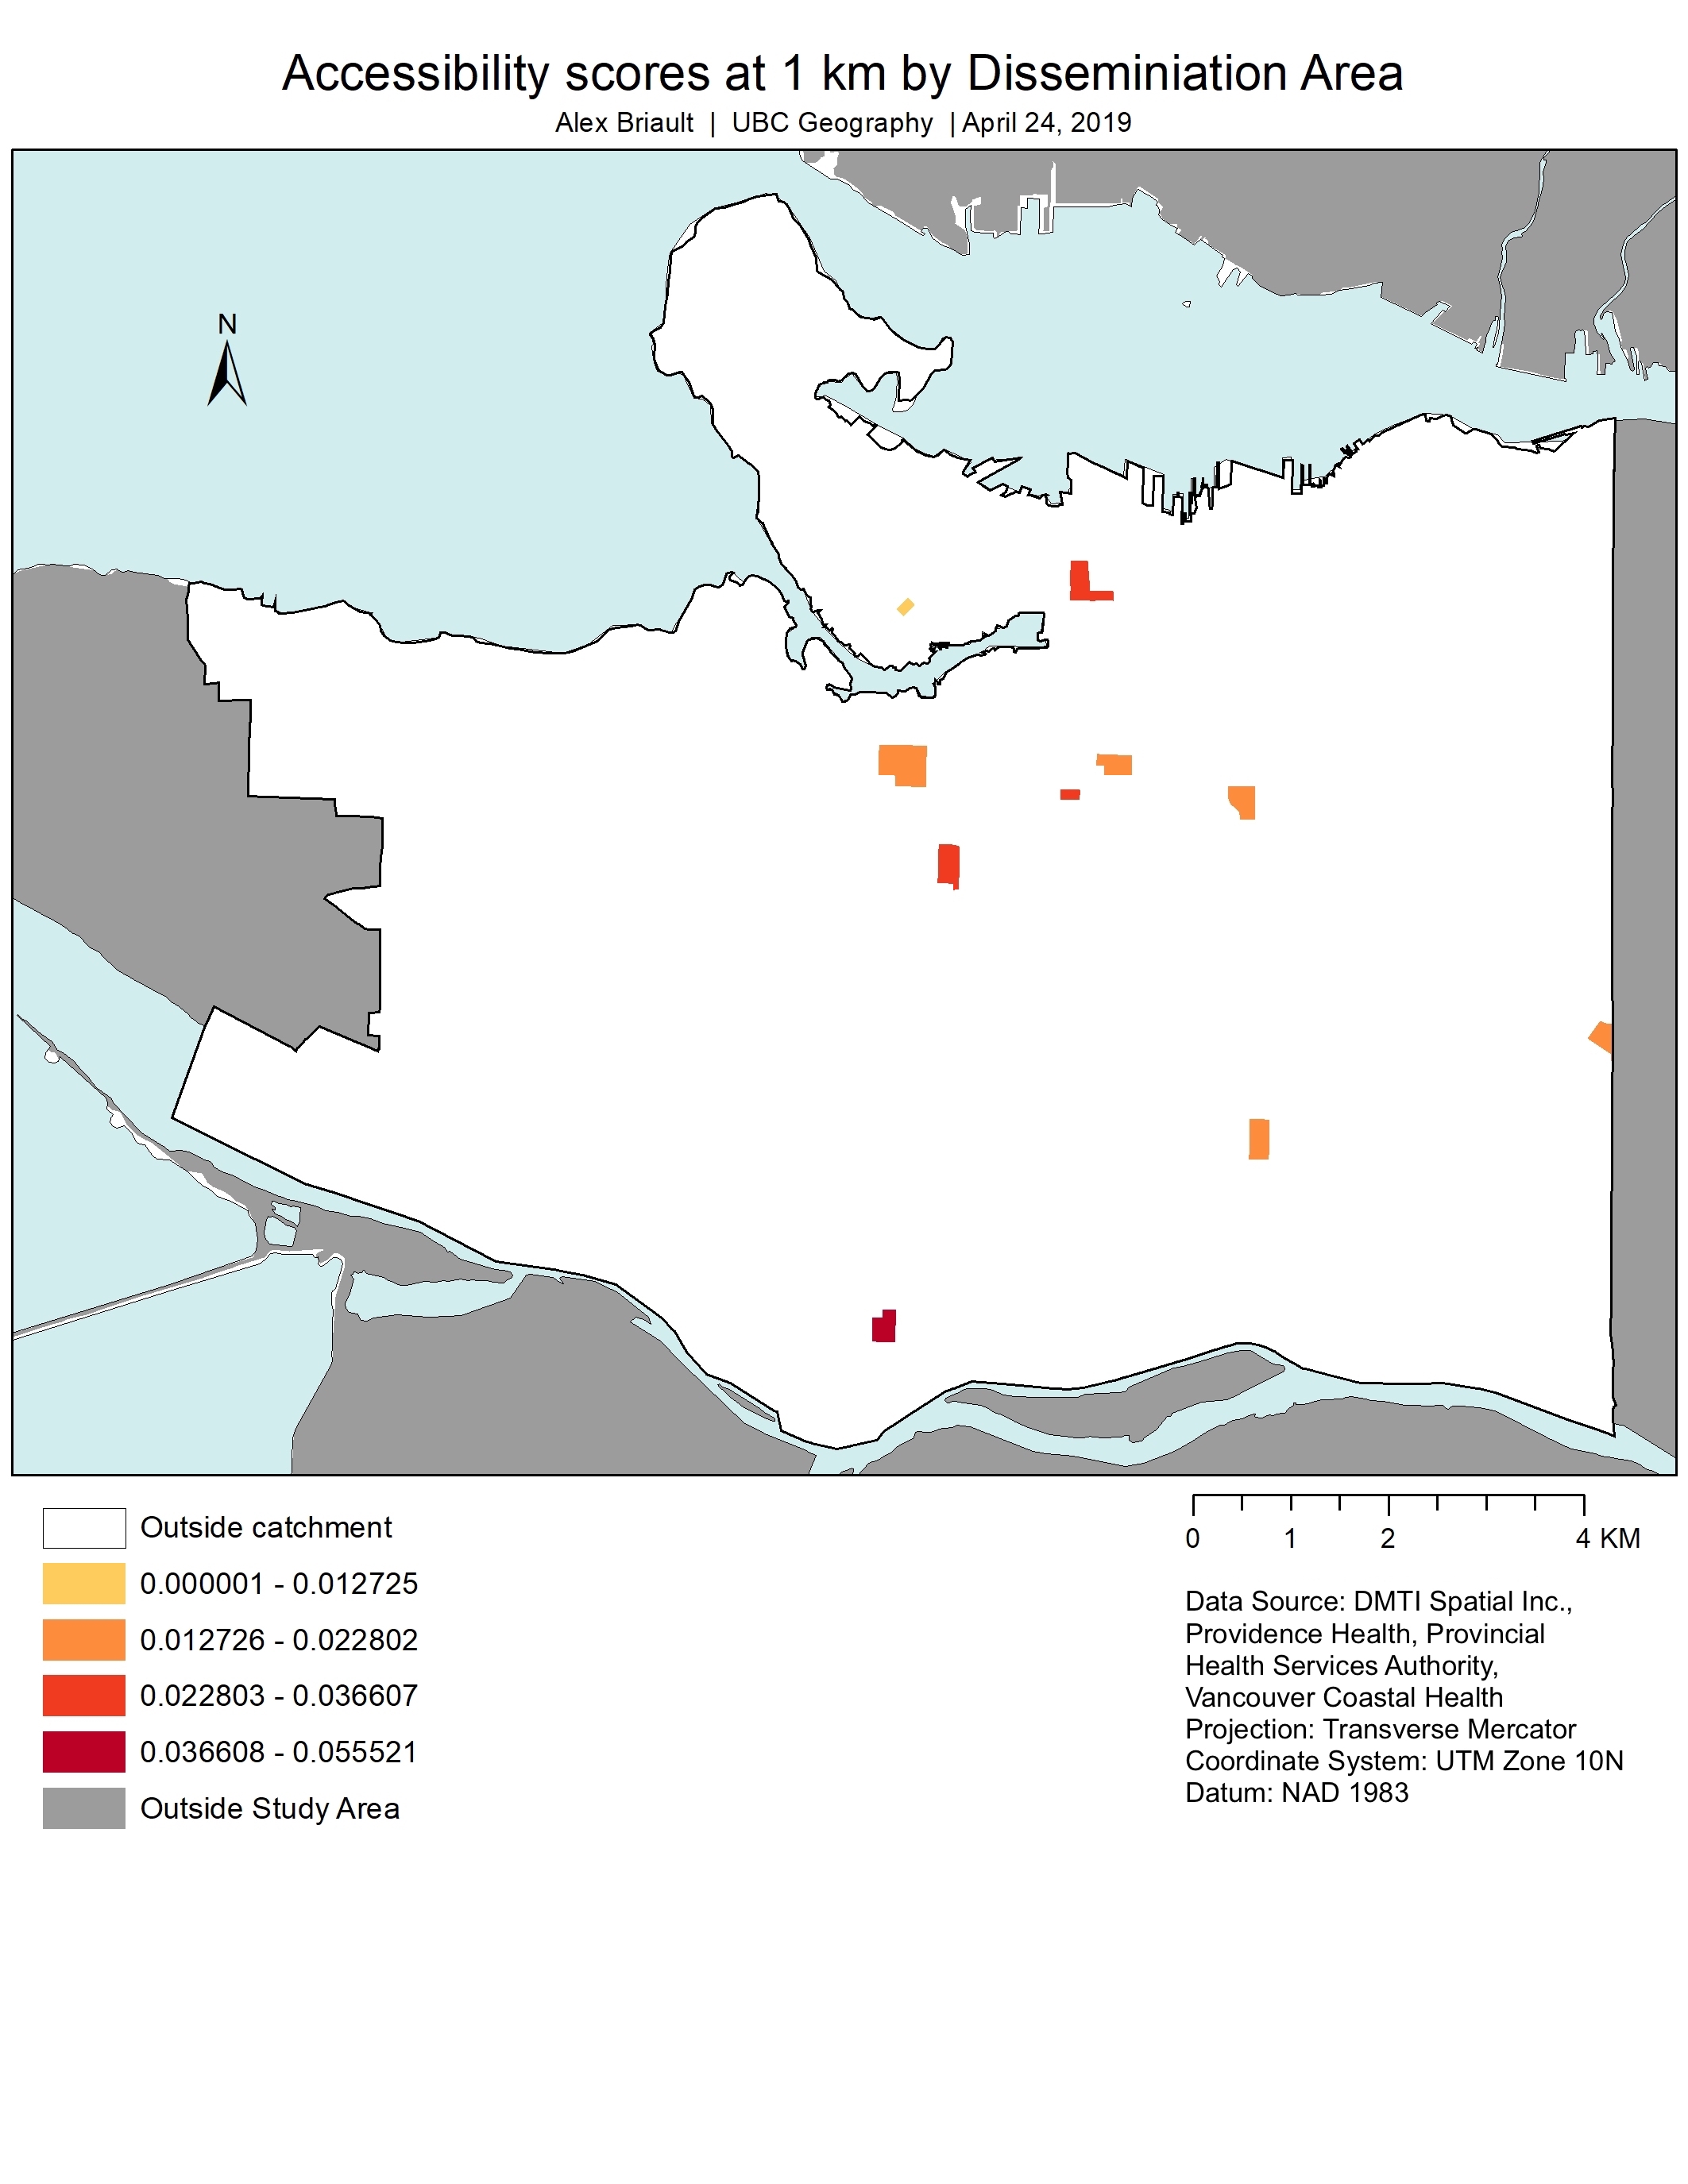
Figure 7: Accessibility Scores at 1 km distance
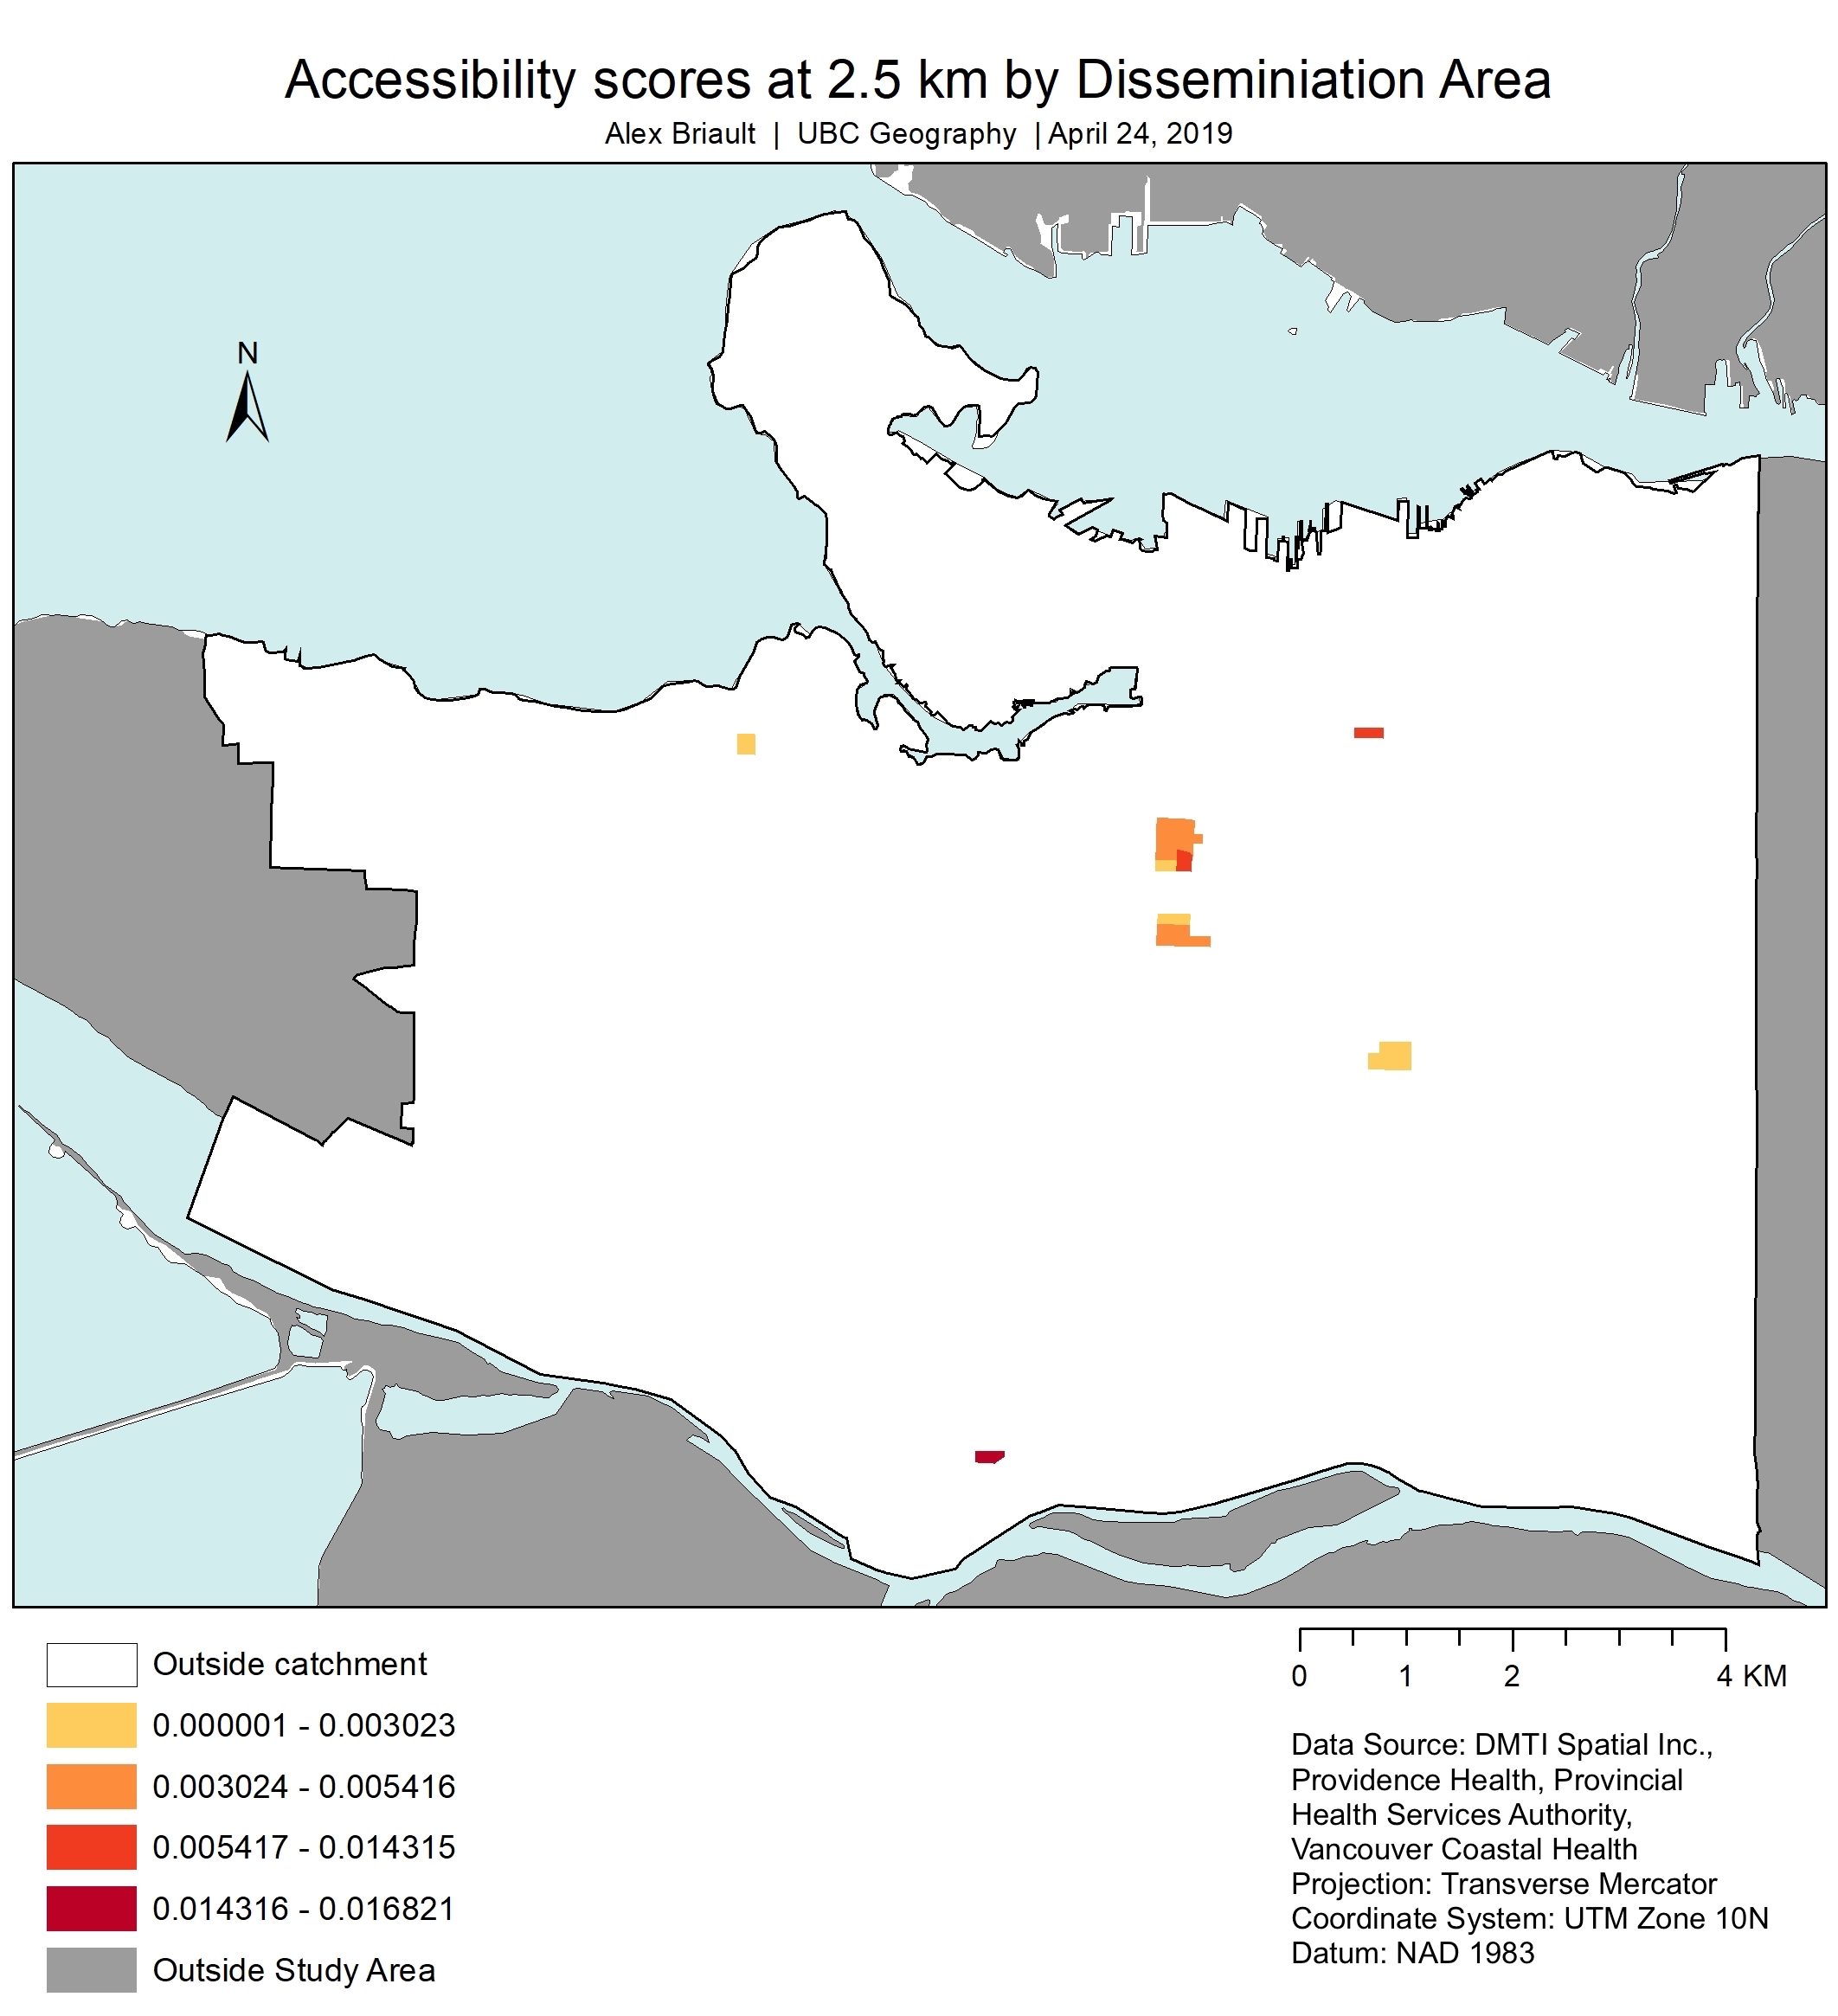
Figure 8: Accessibility Scores at 2.5 km distance
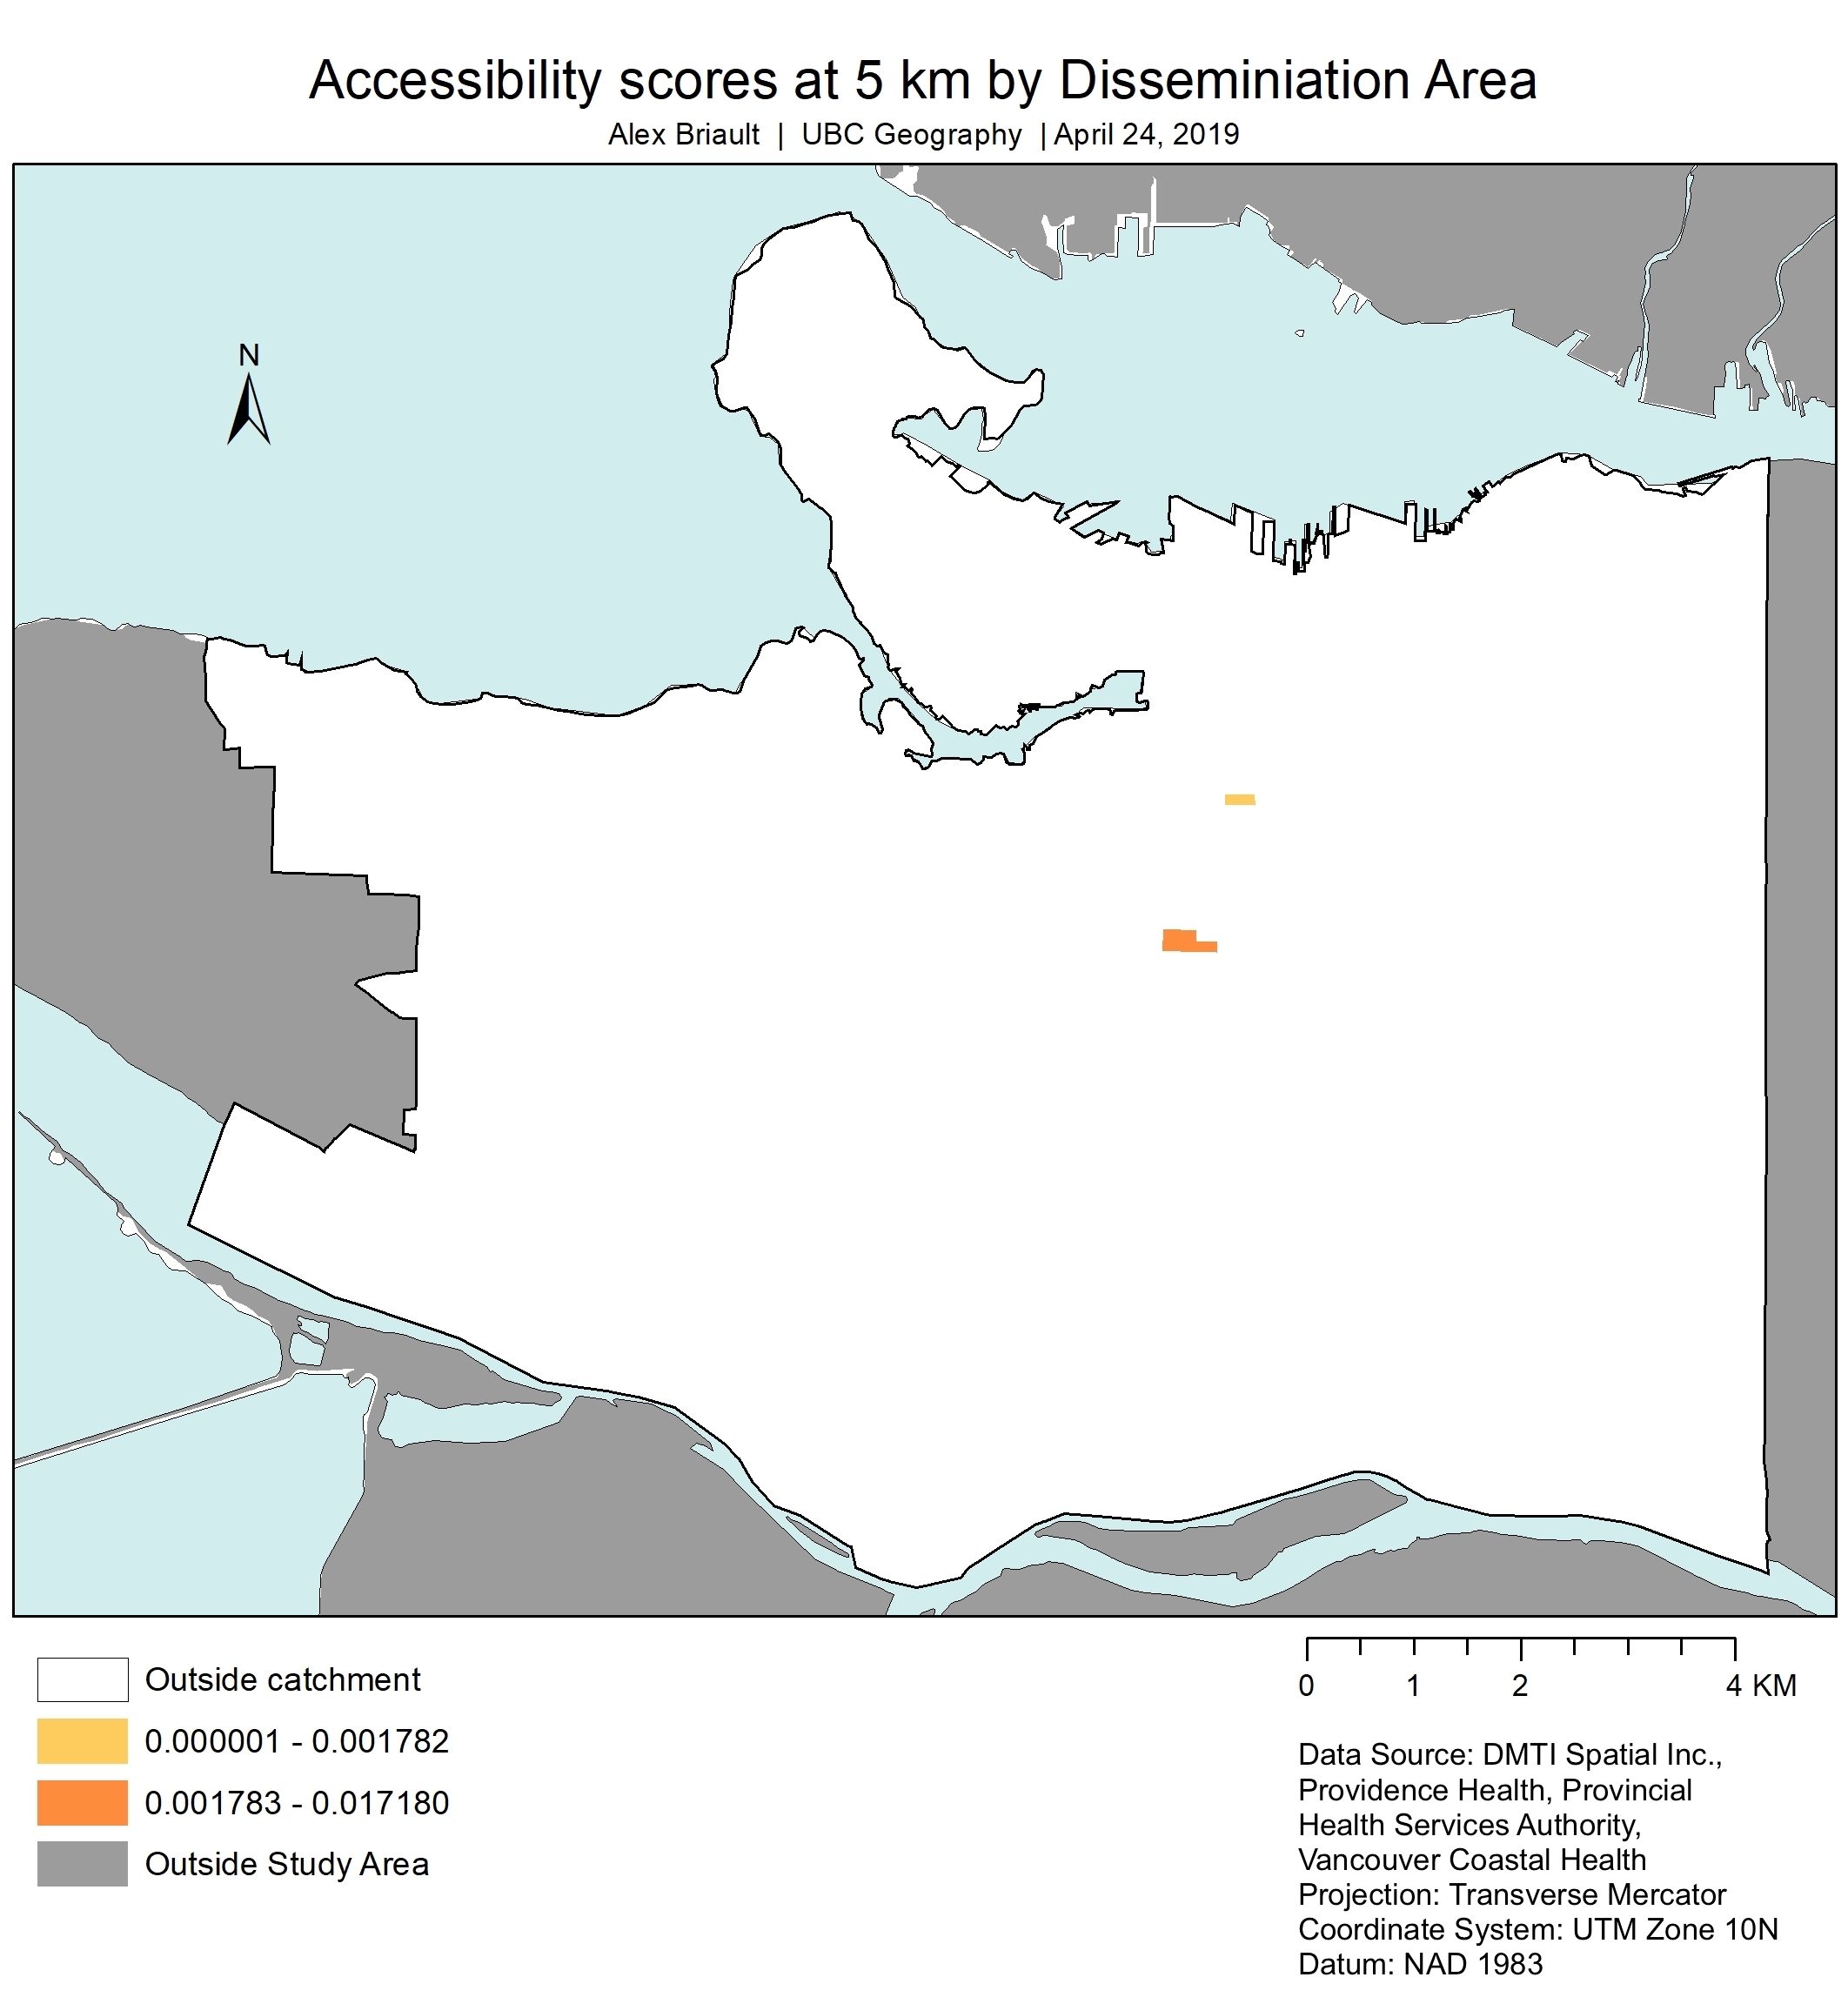
Figure 9: Accessibility Scores at 5 km distance
This animation shows the results of the above maps in a way that quickly shows how accessibility changes with distance.
Figure 10: Animation of accessibility results