
Need more data analytics capability over your product’s Mixpanel data?
Are you one of those product managers or data analysts who always feel the lack of right data or tools when data need arises. Do you ever fell that though you have invested countless hours in designing with the development team to collect product usage data, still when the time comes we feel handcuffed by the limitation of the data tools? Well, I did! Product manager roles come with lot of responsibility, but the most important of all is generating consensus among the various stakeholders. For me, data has always been the priced weapon when it come to communicating and arriving at a consensus.
Needless to say, creating systems that foster such data-informed decision making culture is hard to develop and maintain. Working as a PM with mybazinga.com, a cloud based strata/condo management solution, I too had hit a roadblock when it came to amount, time or resources we can invest to satisfy our data analysis needs.
Fortunately these exists a simple solution to fill this gap especially if you are currently using Mixpanel to record and analyze your product usage metrics. This blog will help you set up your own data analysis and reporting system on a your own desktop or laptop. For the sake of simplicity, I have divided the blog into multiple segments
Before we move ahead, here are list of resources you would need:
- Windows desktop or laptop with .NET framework installed.
- Make sure there lot of empty space on your disk-drive. We would be downloading all the events from mixpanel servers onto our machine.
- MongoDB : https://www.mongodb.org/
- Tableau Desktop: http://www.tableau.com
Other useful resources:
- Simba Mongo ODBC driver : http://www.simba.com/connectors/mongodb-odbc
- Robomongo mongoDb management tool: http://robomongo.org/
1. Need more data analytics capability over Mixpanel data – Solution Architecture
Below is the rough architecture of the solution I am proposing:
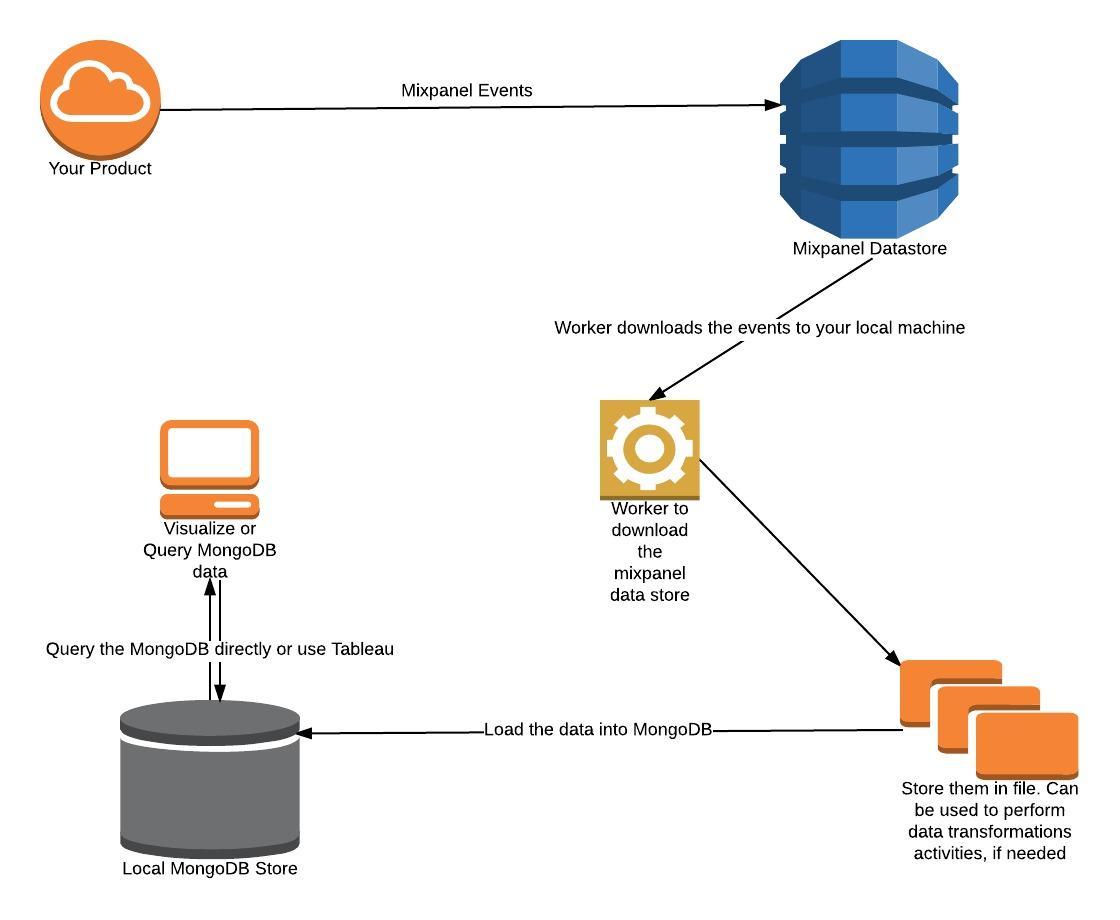
As designed, your product would be sending tracking data to Mixpanel. This data can be either directly sent to Mixpanel or through integration services like Segment. We at mybazinga.com use Segment.io to manage our integrations which gave a huge deal of flexibility in trying out new tools for our business needs.
One of best things about Mixpanel is that it exposes your product data which can accessible and ready for download. To know about the Mixpanel’s data export capabilities refer : https://mixpanel.com/docs/api-documentation/data-export-api. we can leverage these endpoint to extract our product’s data. The raw data pulled is in JSON format.
This data can now be used to feed our analysis requirements. As mentioned earlier, we would be MongoDb to store and query the data. MongoDB has a effecient query processor with a capability to parse NO-SQL data (in our case JSON data). Once we push the data in MongoDB, we can either use off-the-shelf data visualization tools or query mongoDB directly to analyze this data.
Here are few off-the-shelf solutions that can directly connect to MongoDB:
- Tableau (Free trial desktop version)
- Qlik (free)
To directly query MongoDB, use can use an open source tool -Robomongo
If your needs are complicated, you can even develop inhouse dashboards and graphs from the MongoDB data.
2. Setting up worker to download product’s mixpanel data and loading the data into MongoDB
Use can use any language depending upon your familiarity to access Mixpanel’s APIs. Being comfortable with C#, .NET was my immediate choice. Here is a sample code/project in C# that will allow you to download data from Mixpanel between specified date ranges. Make sure you replace app.config file’s Key and Secret field with your Mixpanel Key and Secret.
Sample code: https://github.com/spidermanadda/MixpanelRawDataDownloader.git
Currently, the application does not run as a job or a scheduled execution. If you are using a windows machine can achieve this by creating windows job. The project I shared downloads the data from Mixpanel and saves them into files by dates. After downloading the data, it pushes the data into MongoDB and moves the file into a “Archive” folder
3. Go crazy with Tableau and MongoDB or if you wish to be a nerd, directly query mongoDB.
Last and most easy step is simply configure Tableau to connect to MongoDB and access this data (collections). Only the windows version of Tableau has capability to connect to MongoDB using ODBC drivers. If you do not already have MongoDB ODBC driver, you can get one here: http://www.simba.com/connectors/mongodb-odbc
If done correctly using the sample code provided, the whole implementation would take less than a day to set up and see first wave of data to start playing with. Hope you find this article useful and will help you fill your immediate data needs.
If you like the post or like to provide feedback, please leave a comment. Got nothing to say, well just leave a ‘Hi’. Its always great to meet new people.
Live long and prosper!!
Thank you.