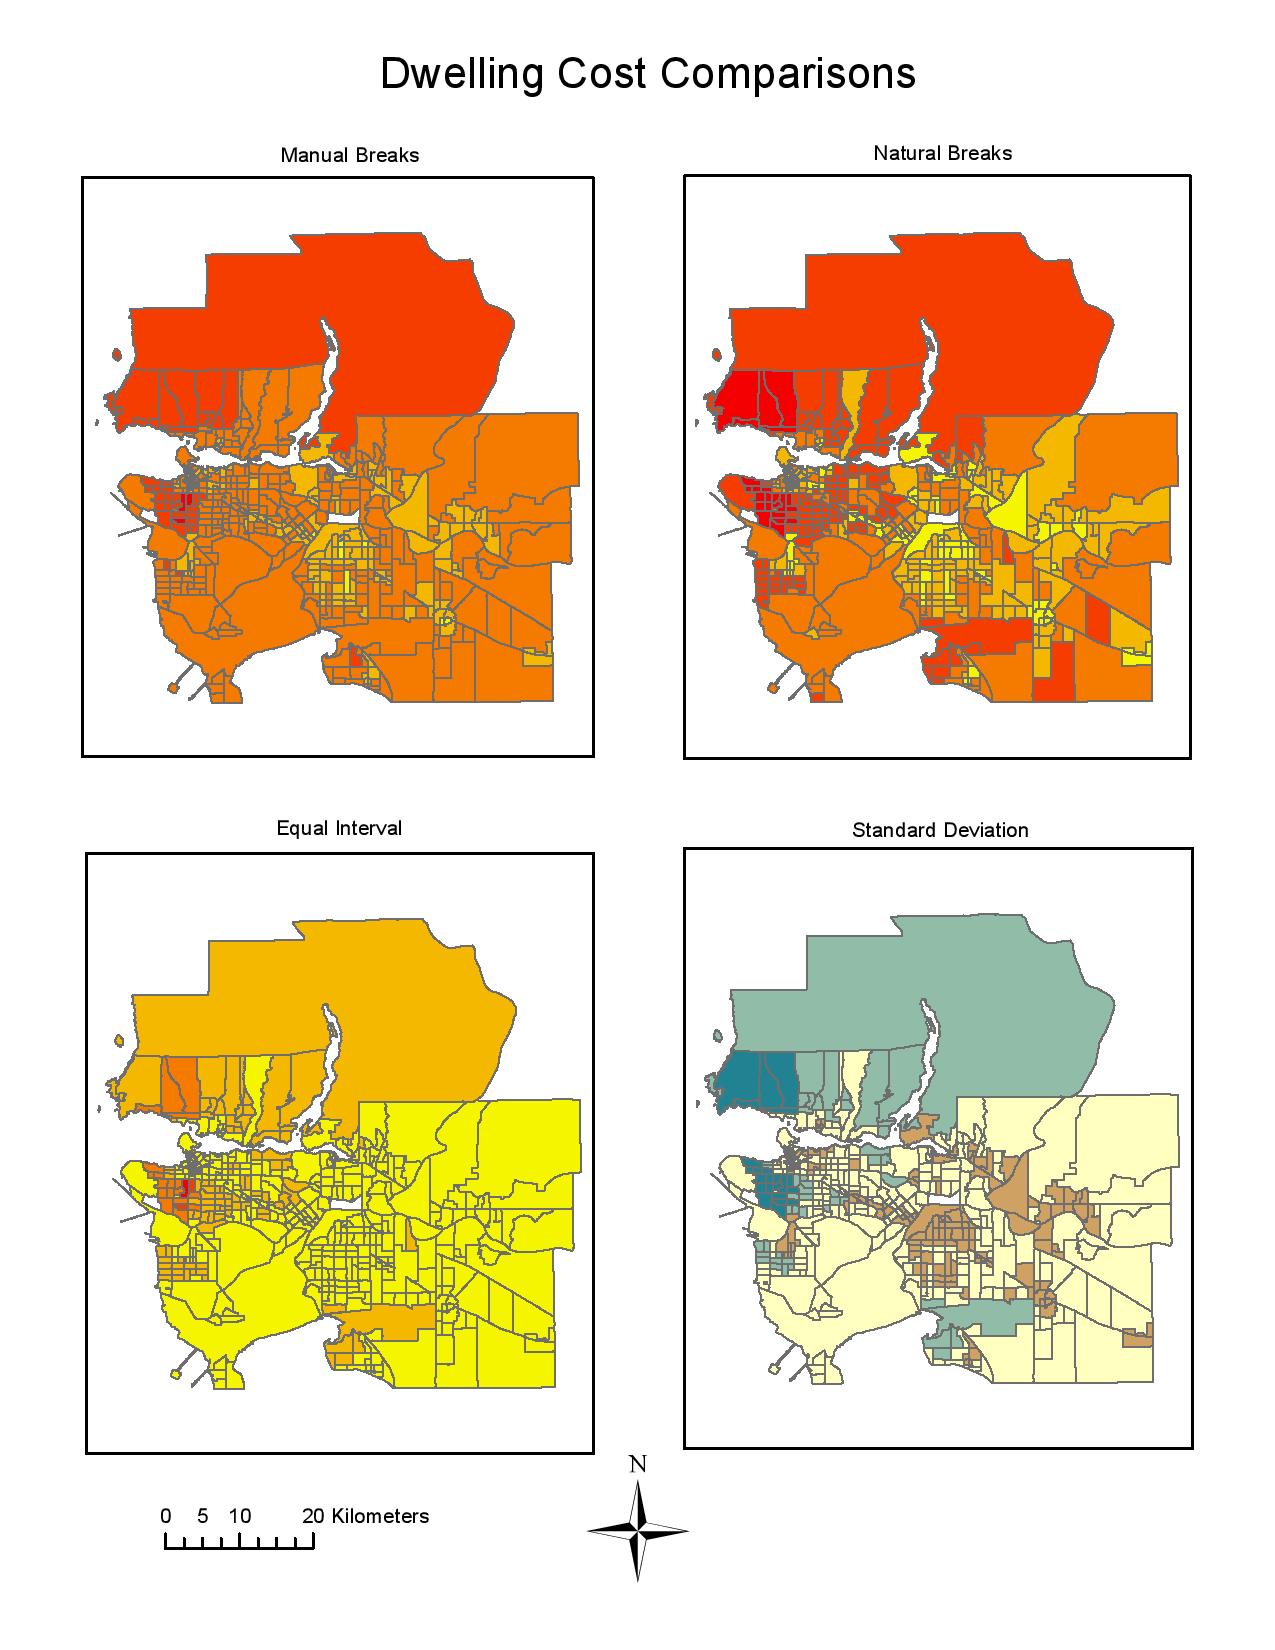
The four classification methods above: manual breaks, natural breaks, equal interval, and standard deviation, are data classification methods that influence the interpretation of data in maps. Depending on the situation, certain data classification methods can be favoured over others and at times they can be unethical.
As a journalist, I would choose the natural breaks classification method because it shows exactly where there are natural breaks in the local area. To the audience, the prices are being portrayed accurately and it shows a range of prices over the Vancouver area, especially the places where the housing costs are the highest.
Where, as a real estate agent, I would choose the equal interval classification method because the house costs appear to be more evenly spread out and lower in cost. There are ethical implications for the choice of classification method because most real estate agents would probably want to sell as much as they could, therefore they would present a map as affordable to spark interest in the buyer in a certain area, when in fact, the area is probably more expensive than what they expect.

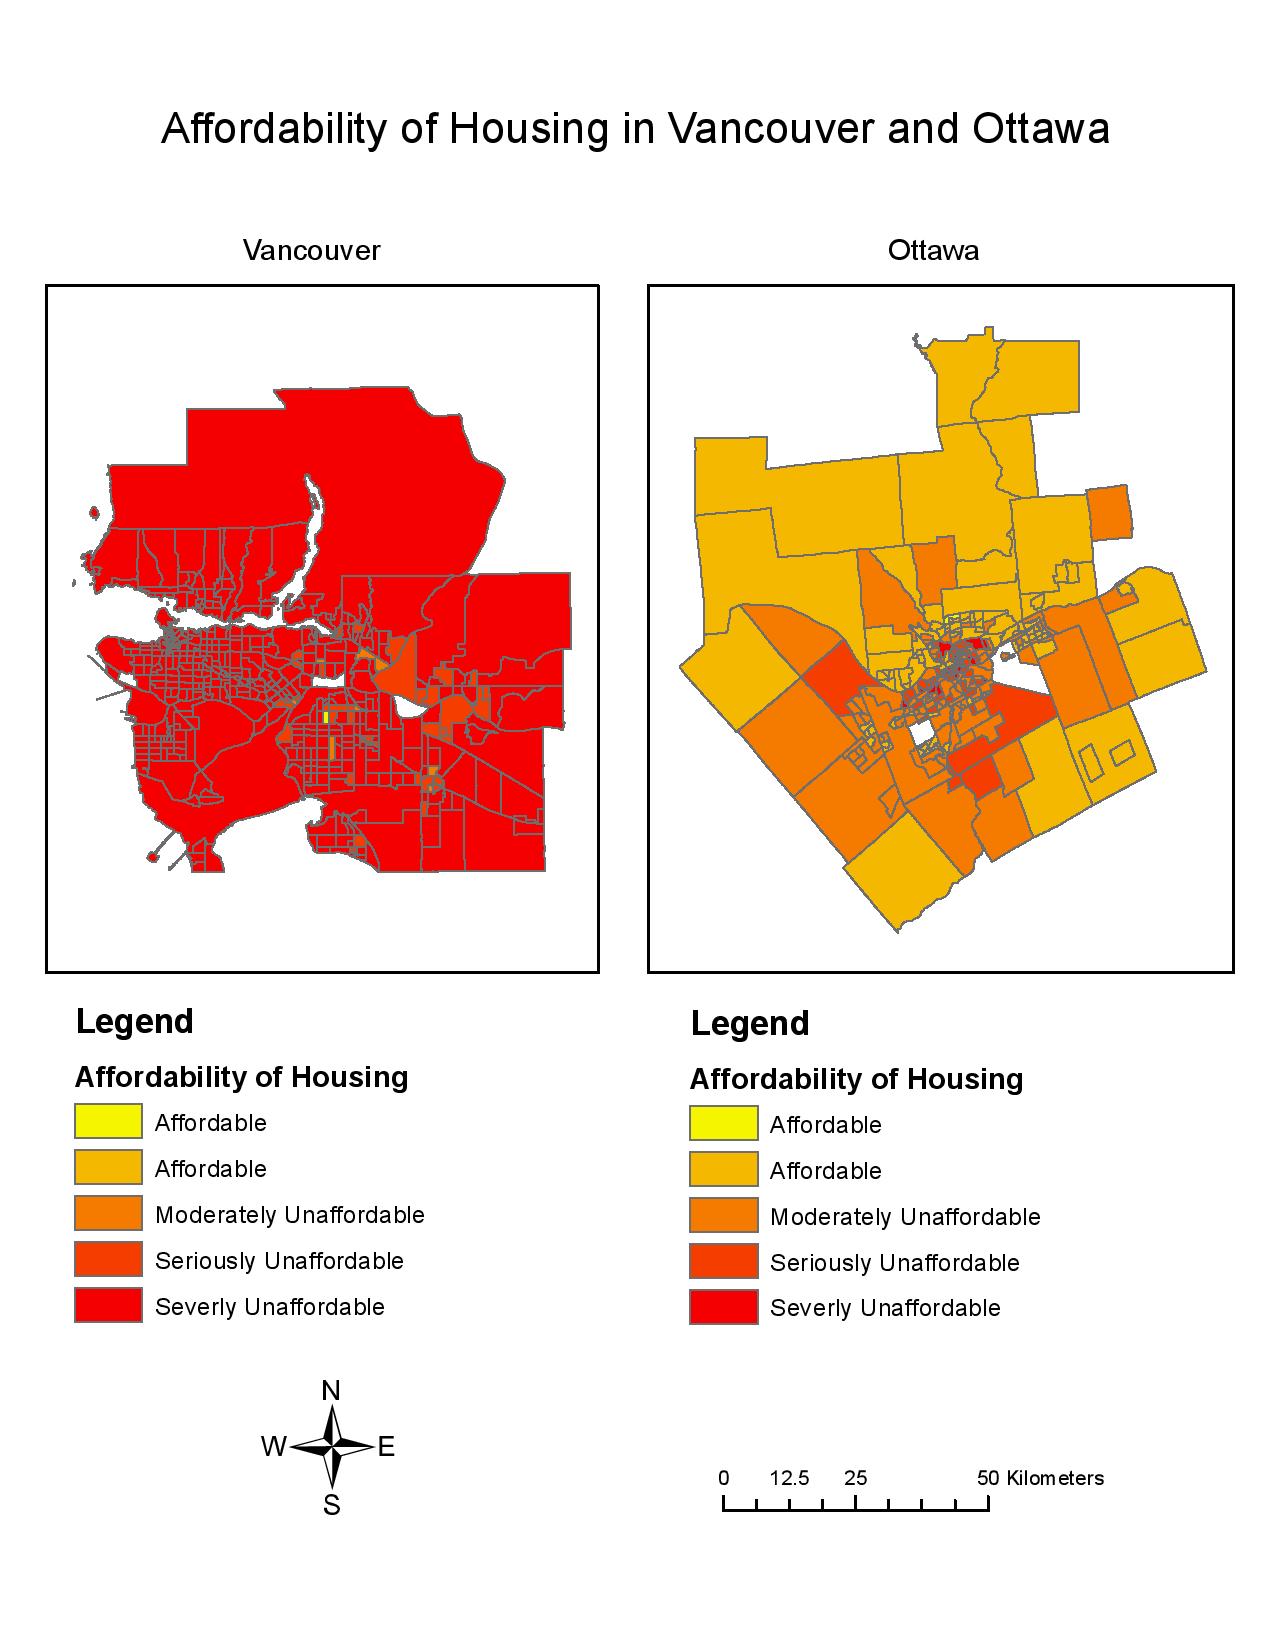
Affordability is measuring the ratio of the cost of housing to the median household income. This is a better indicator of housing affordability than the housing cost alone because each city has a different median income. Larger cities tend to have a higher median household income than smaller cities, therefore, comparing this to the housing cost is a more rational way of measuring housing affordability. The housing affordability rating categories as determined by the 12th Annual Demographia International Housing Affordability Survey of 2016 are Affordable (3.0 and under), Moderately Unaffordable (3.1 to 4.0), Seriously Unaffordable (4.1 to 5.0), and Severely Unaffordable (5.1 and over). Since the data was collected by professional urban planners and is recommended by the World Bank and United Nations, it is to be trusted. It is important to note that affordability cannot be said to be a good indicator of a city’s livability. The affordability of a city does not account for socioeconomic factors and many factors that people would consider crucial to live, i.e. education and access to health care.
ACCOMPLISHMENT STATEMENT
Worked with census data to classify, normalize and visualize the affordability of housing in two cities in order to compare and analyze the differences between Vancouver and Ottawa.
