
Alberta Achievement Test 2012 (AAT)
We have been doing the AAT since before we began the Leadership for Literacy Initiative in 2007-2008. It is useful for us to look at the data in context of multi-year results and averages in order to more clearly focus on the trends. The Alberta Achievement tests are aligned to the WCP curriculum outcomes, but there has been discussion regarding implicit cultural bias in the test for northern aboriginal students in particular. Below I attach some analysis of our AAT results. Our participation in this test continues to be good – over 80% in the elementary grades, however the high school participation rate remains low.
Lutsel K’e Dene School AAT Analysis 2011-2012
GRADE 2007

GRADE 2012
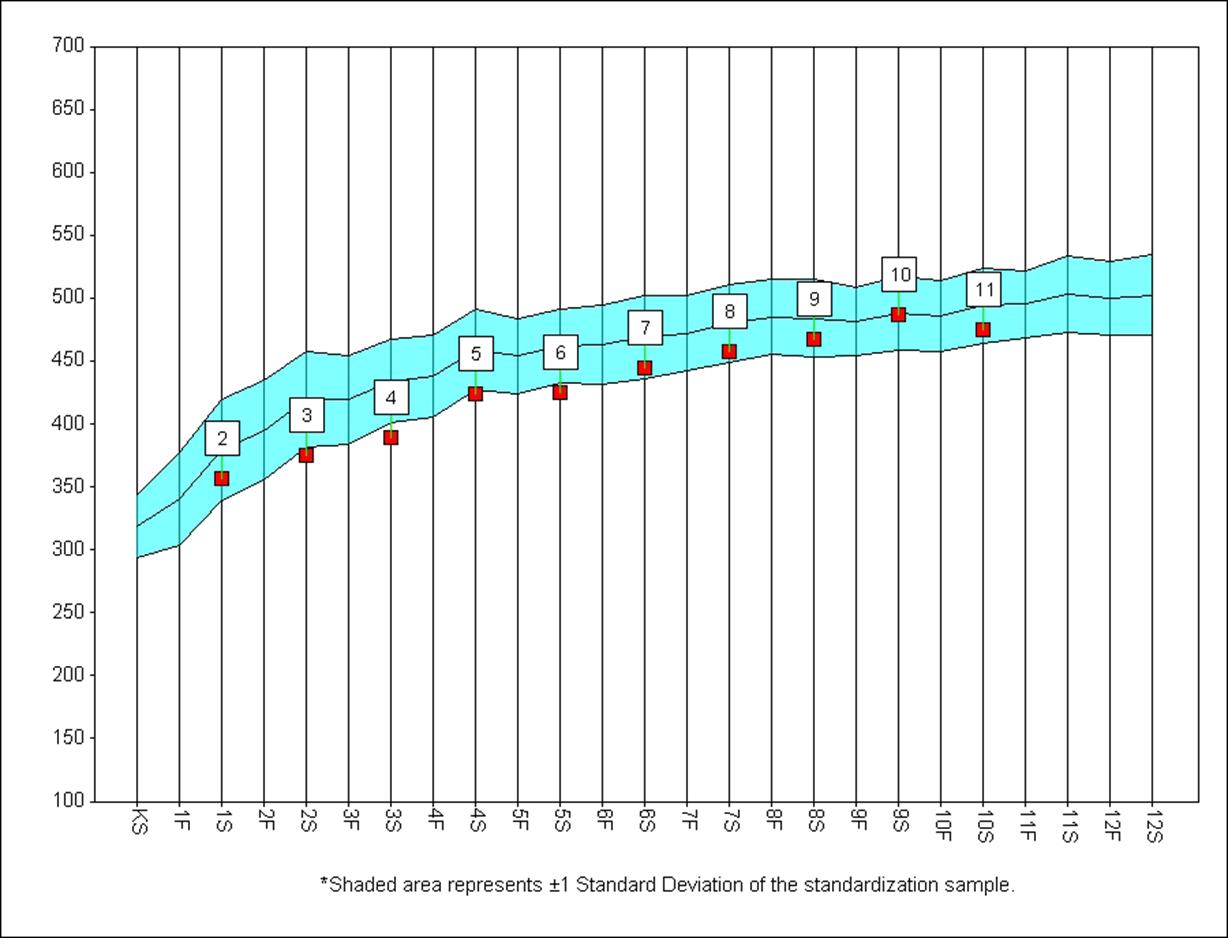
These two graphs show Lutsel K’e Students GSV (Growth Scale Value) in comparison to the Canadian norm. The GSV tracks reading progress over time. It can be used to compare a students’ reading progress to other students across Canada in the same grade. It is clear that great progress in reading growth has occurred from 2007 baseline year to this past year’s results. Overall participation rates for last year was 85%. participation rate was very high in all grades except Gr. 10 with 25%; which again reflects our overall attendance and commitment issues in that Grade.
GRADE 2012 Classroom teacher responses May 2012
CAT4
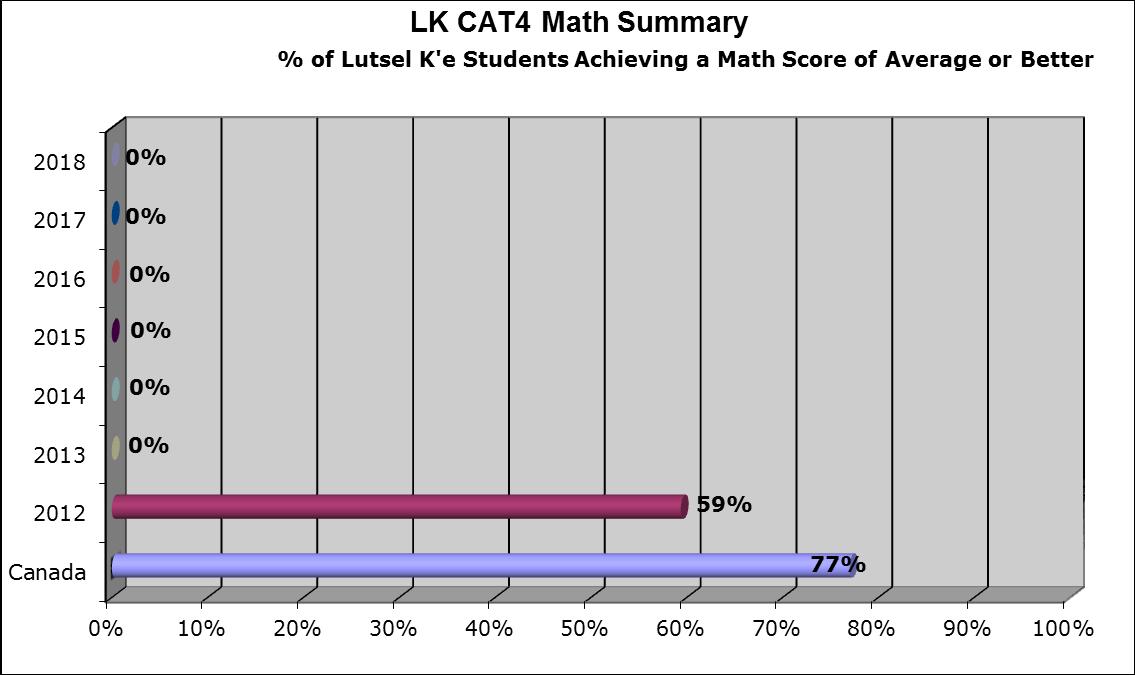
Fall 2012 was the first baseline data for this test for mathematics skills. Our students performed very well on the test that was given late in September, however, less than 50% of our students wrote the test. At that time some students were on the Fall Community Hunt out in the Barrens, some students were demonstrating poor attendance even in September. It is most likely that our results would have been less impressive if all the students had written the tests. We find at the school that students with good attendance tend to be the high achievers as well.
The chart below shows Lutsel K’e students (purple) compared to the Canadian norm:
Data in stanine format:
