Lab 2: Introduction to Geographically Weighted Regression
This study examines the relations between a child’s social skills and a set of variables related to the child and to their neighbourhood using Geographically weighted regression (GWR). GWR is a local statistical technique that extends from traditional regression framework. It tests statistical models of the relationship between two variables—dependent and independent variables—over space. When compared to global models such as OLS, GWR performs better for spatially heterogeneous data such as the social skills score because of its capability in accommodating spatial correlations. Three variables were used to conduct this analysis. It is found that income and gender are strong predictors of a child’s social skills score on the east side of Vancouver, while language abilities generally have a positive influence of social skills score throughout Vancouver. While the grouping analysis shows a stark East vs West division in Vancouver, GWR provides a more nuanced explanation to the spatial variation of social scores.
Ordinary Least Squares (OLS)
The residuals from OSL display a clear structure, meaning that the relationships I modelled change across the study area. GWR was then used to accommodate spatial correlations by fitting a regression equation to every feature in the dataset.
Geographically Weighted Regression (GWR)
The coefficient surfaces generated using the GWR tool, combined with the results of grouping analysis, were helpful in identifying the spatial patterns in the study area. A higher value of R2 and a larger circle shown in map 1 means that the variables served well in explaining the social skills score. R2 was mapped over the coefficient raster maps in order to identify where the GWR model worked well. This model explains 61% of the variation in the dependent variable in east Vancouver, Downtown, and Kitsilano, where dramatic results were obtained. R2 in West Vancouver, on the other hand, is significantly lower for all three variables, meaning that the local model is performing relatively poorly. This is also the area with higher income.
Income
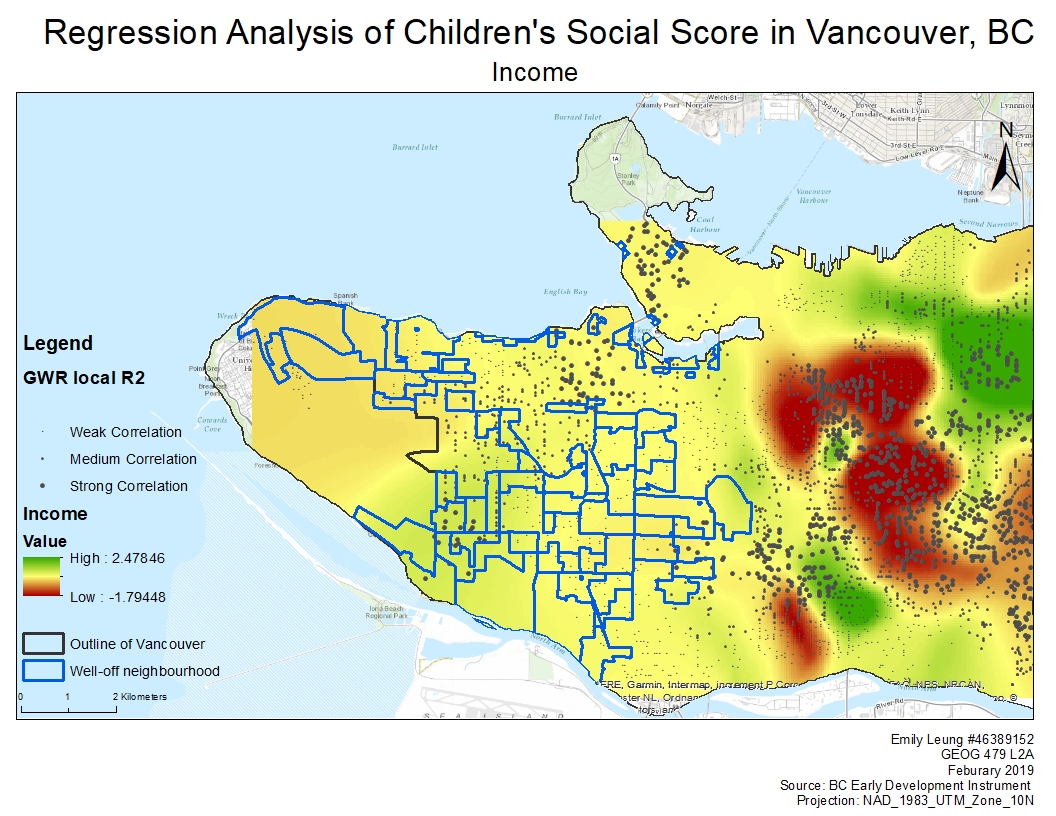
Map 1. Geographically Weighted Regression on income and social scores
Changes in income have weak influences in West Vancouver and Downtown. It is reasonable because families in these areas a have a high income, to begin with (as identified in the grouping analysis), thus, the marginal effect of income increase to children living in these households is minimal. On the other hand, changes in income have significant influences on the east side, both positively and negatively. Red areas in map 1 indicate low social cohesion due to gentrification in Mount Pleasant and Kensington. Although well-off families move in that neighbourhood and raised the average income in that area, they do not mix well with the people who have lived there for a long time. Hence, 1 unit increase in income results in 1.8 unit decrease in social score. On the contrary, green areas indicate a significant positive influence income increase has on the social score. These areas are associated with cheap housings where families can improve their living conditions relatively easy even with a small increase in income.
Gender
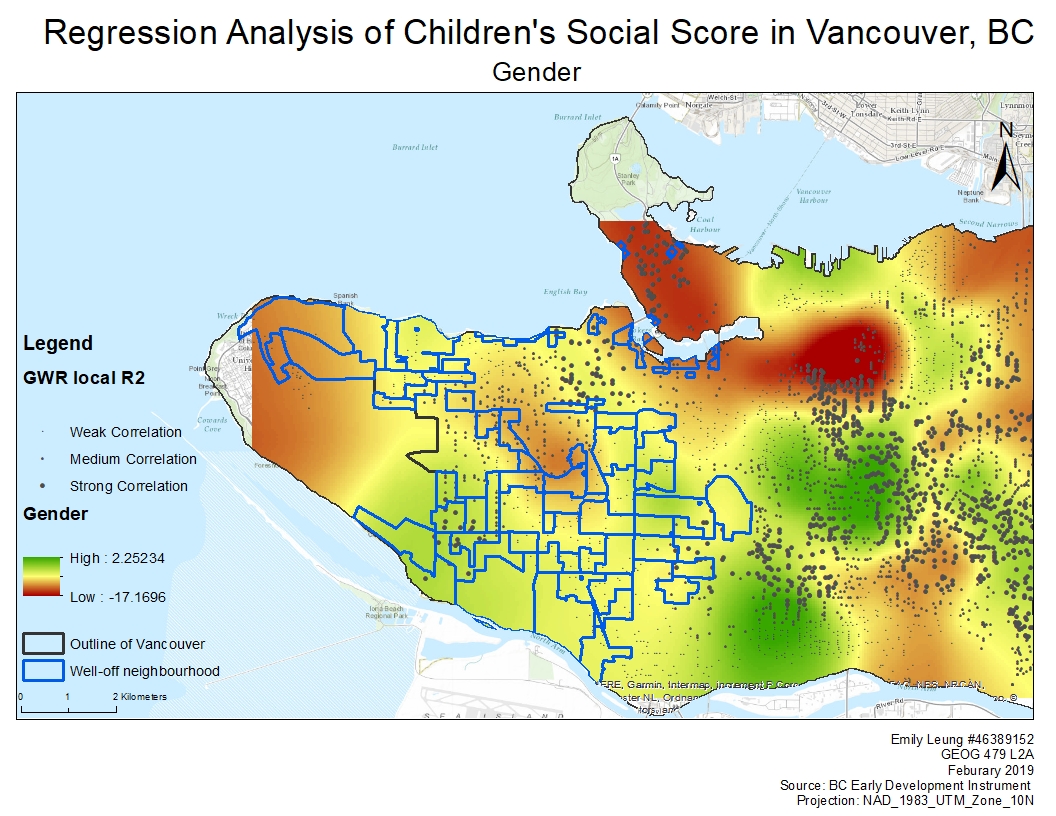
Map 2. Geographically Weighted Regression on gender and social scores
The variable gender exhibits a strong negative influence over social score downtown and Strathcona. Being a female in these areas could result in as low as -17 social scores (map 2). An opposite relationship is found in Sunset, Kenington, and Collinwood where social score increases for female by 2 units. The positive influence, however, is much lower than the negative one. Gender is a weaker predictor of social scores in the majority of well-off areas. This shows the ability of socio-economic status in compensating the disadvantage of gender and narrowing the gender gap.
Language abilities
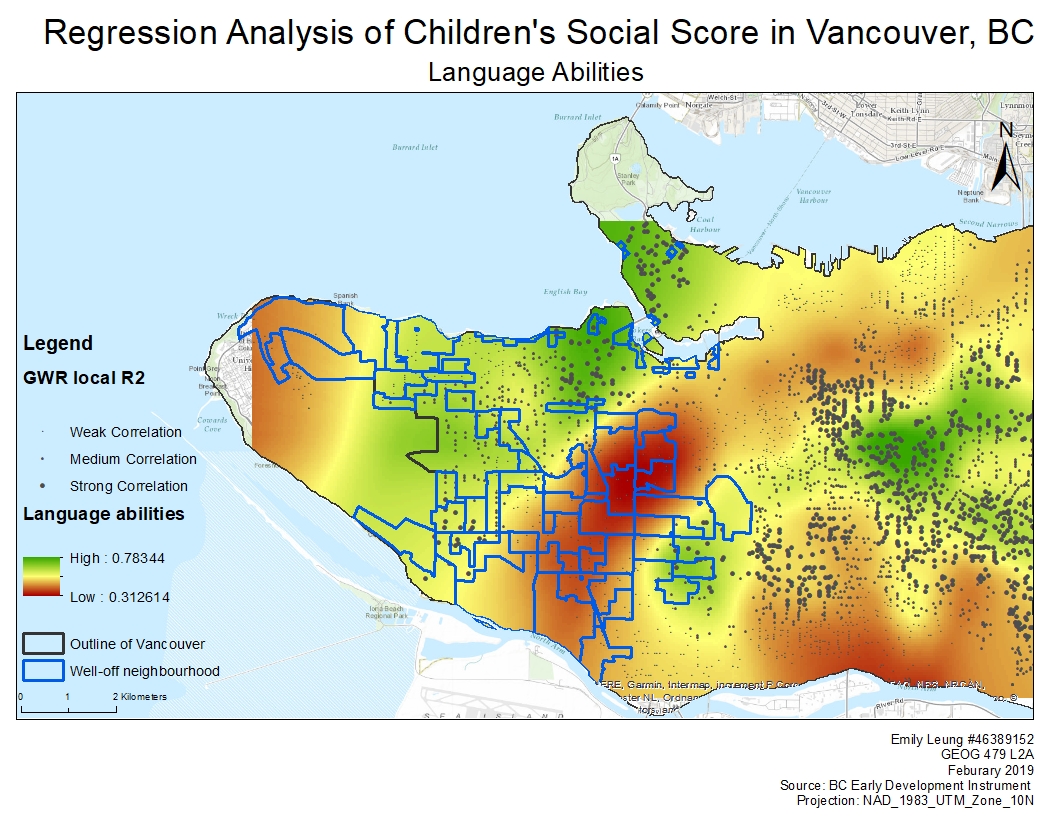
Map 3. Geographically Weighted Regression on language abilities and social scores
Compared to the other two variables, language score is a weaker predictor of the social score as the difference between high and low values is small (map 3). In general, an increase of language abilities raises the social score as all the values are positive. A clear spatial difference can be identified by the magnitude of influence. A 1 unit increase in language score only makes a 0.3 unit increase in social score in well off regions, but a 0.7 unit increase in Downtown, Kitsilano, Dunbar, and Renfrew-Collingwood. However, it is important to recognize the natural bias in language score. This explanatory variable is highly subjective as some teachers may be stricter and report students as less successful and active than teachers in other schools.
GWR Applications
GWR is used in various fields to analyze complex data that can be used to make informed decisions. GWR has found important usage in various fields, such as transportation, real estates, ecology analysis and health geography. It is a powerful tool to challenge dominant broad-brush policy approaches and push for differentiated policy implications that take into consideration geographical differences.