The Maps and report included below are taken from Lab 5 of my Geob 270 Class. Out of all the labs, this lab, and the resulting map and report was my favorite to produce, as well as some of my best work from this class. As background, the report is written from the perspective of a natural resource planner working for the project proponents. The report is meant as an environmental impact assessment, in order to advise the proponents on how to continue in the face of environmental concerns. I will first present the map, report and hillshade, followed by a conclusion after the fact. Hope you enjoy.
The Garabaldi at Squamish Project is a ski resort development project located on Brohm Ridge just outside of Squamish. The ski resort includes 124 ski trails and 21 lifts, along with resort accommodation and multiple commercial developments. There are a number of past criticisms of the project’s environmental impacts from the BC Environmental Assessment Office, as well as Whistler Ski Resort. The BC EAO found the original proposal lacking in information as to potential effects on vegetation and wildlife habitat, while Whistler cited climatological considerations which had been overlooked, such as the scientific climate projections which would make skiing unreliable or not possible on the lower 600m of vertical.
As a natural resource planner hired by Garabaldi at Squamish project, I hope to evaluate in this report, previous criticisms of the project as well add my own opinions and assessment to light. I will first explain my analysis of the development and its environmental concerns as well as present the results of this analysis. I will pair this with a discussion what I personally believe to be the most important of the environmental concerns presented, as well as my thoughts on what options the project developers have as to mitigating these environmental concerns.
Analysis:
My analysis and assessment of this project is situated around a map I created in order to visualize the cumulative effect of all environmental concerns which pertain to Garabaldi at Squamish. Each concern will be also be discussed and analyzed on its own, in order to show the relative weight of each of these concerns.
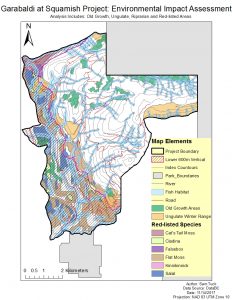
In order to analyze the proposed projects effects on the natural resources and ecosystem services that Brohm Ridge provides, I first obtained data from the BC Government as to relevant environmental concerns in the area. These included: Ungulate Winter Ranges, Old Growth Management Areas, Terrestrial Ecosystems, Rivers and a digital elevation model and landscape contours to highlight climatic change concerns. I then combined all relevant layers and clipped them so that only the environmental concerns which existed within the project boundary were addressed:
The first concern addressed was climatic. I used a digital elevation model to find just how much of the proposed resort would be in danger of un-skiiable conditions, based on climate change models indicating significant loss of snow pack on the lower 600m of vertical by the time this resort would be built and operational. According to my analysis, the lower 600m makes up 31.789% of the total project area.
I then moved to analyze what animals and vegetation would be impacted by the project; specifically, species and habitats which are already endangered, redlisted or protected under environmental law. I found, through comparing the area that these protected habitats and species take up to the total project area, that:
Old Growth Forests make up 6.78% of the total project area.
Ungulate Winter Ranges account for 7.89% of the total project area (mule deer = 4.24%, and mountain goat = 3.65%)
Fish bearing streams and associated riprarian habitats make up 28.43% of the total project area.
Red-listed species habitats make up 24.83% of the total project area. (Falsebox, Salal, Cladina, Kinniokinnick, Flat Moss and Cat’s Tail Moss)
Response and Suggested Mitigations:
Not including the lower 600m of vertical, the total amount of project area which is taken up by protected areas is 53.7%. As you can see from the map, many of these protected areas overlap, and thus a key element to analyzing environmental impact is the cumulative effect that the project could have on protected flora and fauna, especially in these key areas of overlap. As such it is important to not think of these environmental concerns as existing as mutually exclusive from one another, but as acting interdependently, as all of these elements of concern such as vegetation and animals exist as part of an ecological system where effects on one ripple throughout, to impact the whole system.
That being said, if I had to point to what I believe to be the two greatest environmental concerns to the projects development, I would choose 1. Climatic change models affecting snowfall and 2. Red listed species habitats.
I choose climate change models due to the fact that climate change is a very real process which is very difficult to mitigate in a short period of time. Assuming the models presented are correct, then by the time the project is completed and open to the public, actually having snow for guests to ski on may threaten the viability, and profitability of the initial investment to build the project.
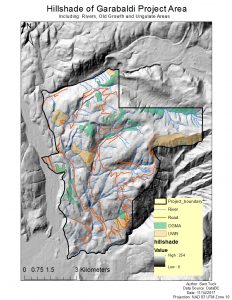
Red-listed species I also believe to be one of the greatest concerns due to the fact that, based on the map, these species exist generally within the lower 600m of vertical. Furthermore, and possibly of greater importance, as vegetation they can be easily disturbed or threatened from not only the massive construction, logging and general resort development, but also the continued use of the area as a ski resort. As they are species which are already significantly threatened, and due to the fact they take up such a large percentage of the project area; I would argue they are of greatest concern to the projects environmental impact.
Conclusion:
While the first concern I have presented really has no way of being mitigated directly through the building of the project, the second concern might be mitigated in a number of ways. First, I would suggest that these areas be identified and marked so that construction surrounding them is minimized or controlled so as not disturb their growth. I would also suggest creating environmentally sensitive boundaries for skiers and resort guests so as to further protect these species from disturbance.
For this Lab I was assigned the role of a natural resource planner who was hired by the people in charge of Garabaldi at Squamish. Thus, while in the report I try and stress the importance of addressing environmental concerns; I inevitably have to side with the project and assume that it will continue as planned. However, personally I do not believe that this project should go through; not only because of the environmental concerns associated with it (which, from my analysis and resultant map seem to be overwhelming) but also, as hinted in my suggestions, simply not economically viable for the project proponents. It seems to me to be absurd to be building a completely new, and incredibly ecologicaly distruptive ski resort at a time when science is overwhelmingly in agreement of the empirical truth of climate change and global warming. Not only will temperature levels continue to rise along with the number of extreme weather events, but these are only estimates based on our current consumuption levels, and are not able to predict the cumulative effects of continued consumption over the number of years it takes to slow down our current rates of growth. Furthermore, earths climate cycles are slow in relation to human cycles of development. It is possible that we are only seeing the tip of the iceberg when it comes to climate change, and that all we do to stop our consumption will still not have and effect on the resultant warming levels. Thus; not only is it irrational to build this resort in the face of this science and the predictions for snowfall on the lowest 600m of vertical, but it is also seems absurd to pair this fact with the large-scale ecological disruption needed to build such an inevitably doomed project. While the project proponents may make their money back, the time frame in which it will take to complete the project, attract visitors and begin making profit is just too long to fit inside the short window climate change has allowed us to continue our current lifestyle. Thus I believe it is not only absurd from the point of view of a resource conservationist or environmental scientist; it is also economically irrational and unviable as an idea.
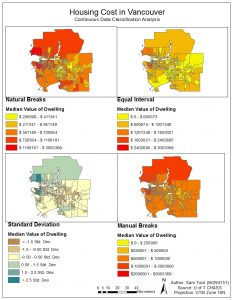
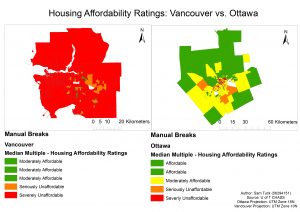
The classification of quantitative data in an extremely important process in GIS. However, it is also a process which involves ethical questions relating to what information are you trying to get across to the reader. Because it is displaying how social data interacts with the physical environment (and possibly a combination of social data sets such as in the maps for this lab), it is necessary to take into account whether the classification you have chosen is the right one for presenting your data.
For example, the above map shows the same data displayed using four different classification methods; for each one, different conclusions can be drawn simply based on the mode of analysis. Therefore, understanding the purpose of the map is paramount. For example, if I was a journalist and I wanted to choose a classification in order to present this data to my readers, the map I would choose would depend on what the point of my article was. If I wanted to present Vancouver’s ‘livability’ being exaggerated due to the unaffordable housing in the city then I would probably choose Natural Breaks as a classification method. This is because it would have the most shock value in terms displaying just how unaffordable it is to live in certain areas of Vancouver.
Or, if I was a real estate agent and wanted to use these maps to convince my client to buy a house near UBC, my choice of data classification would ultimately depend on the prospective buyer and their situation. If they had a lot of money, I would probably show them the Manual Breaks. This would be to show them that, as shown on the map, housing prices near UBC, while expensive, give them the best location and access based on price. Furthermore, according to this representation they are not the most expensive. If they were lower income, I would probably present the Equal Interval map, as it makes it seem as though housing costs in that area are lower than they actually are.
From these examples the idea that there is no such thing as ‘true’ data or ‘true’ maps. How I present the data to the buyers or to the public has ethical implications as really it is just a representation, which can be used or skewed in order to argue a point, or present a situation a certain way.
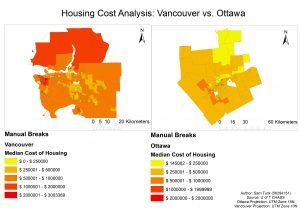
These points relate strongly to the question of housing affordability, especially in a city such as Vancouver. Housing affordability is defined as the ratio of household income to cost of owner dwelling. This is an example of a mix of social data sets, which represents affordability better than just having, say, housing cost alone, due to the fact that it takes into account the socioeconomic factors of the population in that area. If housing costs are very high in a city, but people in that city are, on average very rich, it may make sense to call that area “affordable”. Thus, we can see from the above two maps how this combining of data has an effect on the issue it displays.
However, what is “affordable” also depends on the accepted standards. The housing affordability ratings in the above map is determined by the “13th Annual Demographia International Demographia International Housing Affordability Survey”; a survey produced by leading researchers from Australia, Canada, China (Hong Kong), Ireland Japan, New Zealand, Singapore, United Kingdom and the U.S. I would argue that this rating can be trusted as it is created by leading researchers from around the world. However, these countries still represent a small fraction of the world; representing mainly the West, and countries which are largely “developed”. Thus I would stress the importance of only analyzing the affordability of regions which fall into a similar category of development.
Moreover, the question arises as to what housing affordability really represents in terms of the city. Is affordability a good indicator of a city’s ‘livability’? I believe that yes; It is a good indicator generally speaking. However, it would be wrong to take it as the only factor in determining ‘livability’; a number of other factors must necessarily enter into the picture. Take Vancouver for example. While housing is deemed ‘unaffordable’, the city is deemed (or at least promoted as) ‘livable’. Therefore there is a further question of what ‘livability’ is, and who gets to define it.
If anything, these maps and their analyses point to a need to look at maps a simply a representation, and to question categorizations of data or things as easily distinguishable from one another. These spatial analyses of qualitative data are inherently related to the political and social message which accompanies their representation of phenomena across space.
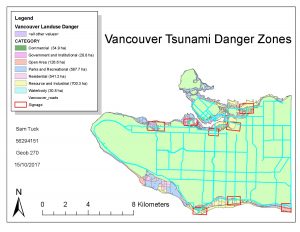
In this lab, we were tasked with making a map indicating the effects of a tsunami on Vancouver. While we have Vancouver Island to protect us from the majority of the flood damage, Vancouver would still be affected. The analysis asks: what areas would be deemed ‘danger zones’ for flooding, or ‘zones’ which are at least one kilometer from the shoreline, and are 15 meters or less above sea level. The above map includes land use type and roads for these areas which would be affected, as well as areas indicating a need of signage in the event of a tsunami in order to communicate the danger to the general public.
I found from my analysis that a total of roughly 15% of Vancouver’s total area is in danger of being affected. To find this figure I completed a number of analysis steps in Arc Map:
Reclassified the areas below 15 metre elevation
Performed a buffer analysis of areas 1 kilometre from the shore
Used the intersect tool to combine the two factors into one polygon summarizing the total area at tsunami risk.
Using this polygon, I was then able to clip the landuse data to it and determine the landuse categories which existed in this ‘danger zone’ as well as their individual areas.
For further analysis, I also identified healthcare and educational facilities which exist inside this zone by clipping city data on the location of healthcare and educational facilities to this ‘danger zone’ polygon, and identifying the location from there.
The facilities in danger from a Tsunami I found to be:
Healthcare = BROADWAY PENTECOSTAL LODGE, COAST WEST COMMUNITY HOME, FALSE CREEK RESIDENCE, VILLA CATHAY CARE HOME, YALETOWN HOUSE SOCIETY
Education = EMILY CARR INSTITUTE OF ART & DESIGN (ECIAD), INSTITUTE OF INDIGENOUS GOVERNMENT (IIG), HENRY HUDSON ELEMENTARY, FALSE CREEK ELEMENTARY, ST FRANCIS XAVIER, VANCOUVER MONTESSORI SCHOOL,ST JOHN’S INTERNATIONAL, HERITAGE 3R’S SCHOOL, ST ANTHONY OF PADUA, ECOLE ROSE DES VENTS
Some skills I gained as a result of this analysis:
Reclassified DEM data from the City of Vancouver in order to identify low-elevation areas in risk of flooding through a proximity buffer analysis.
Created vector polygons in Arc’s edit feature, delineating zones in need of tsunami danger signage, based on above areas of elevated flooding risk.
Calculated area of risk through using attribute query functions to identify specific land use types affected by flooding.
Hi everyone! As term 1 is nearing its end, I will be uploading parts of the labs I have been working on throughout the term. Throughout this course we have had a lot of hands on experience in lab, building our understanding of ArcGIS software, its uses and properties. I hope some of what I learned comes across in these posts, and I hope you enjoy the maps and final project that I have created along the way.
Coordinate Systems:
Coordinate Systems are basically arbitrary designations for spatial data. They provide a common basis for communication of a particular place or area on earth (for example, conic projections vs azimuthal projections). The reason why you can’t combine data with different coordinate systems to analyze it is that when data is projected into a different coordinate system, properties of Shape, Area, Distance and Direction can all be affected. In lab, we were given a number of misaligned or improperly referenced spatial data and we had to fix these in order to analyze the data properly. There are two methods to achieving this, both with distinct pros and cons:
Projection on the fly: this is a built in feature of ArcMap, where the software makes it look like the two data layers are in the same coordinate system, when actually they may not be. Projecting on the fly also allows you to go into the properties of a layer and change the information in order to make this happen manually.
Arc Toolbox: Project Command – While the above method works for display, for spatial analysis it is better to use Arc Toolbox’s ‘Project’ Command to actually go in an transform the data in order to create a new layer under a common spatial reference system.
Landsat Data:
What are the advantages of using remotely sensed data for geographic analysis?
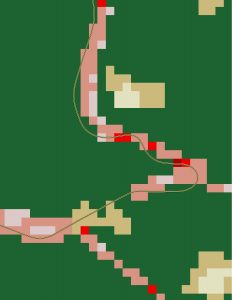
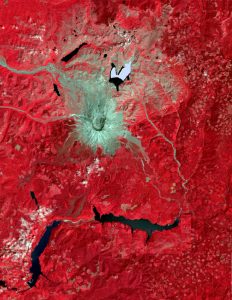
Landsat Data is basically data gathered using a satellite to scan and capture images of earths surface. This data can be very powerful, as, due to the nature of satellites in relation to earth, a very large number of images can be captured over a long time frame. This is great for large scale raster analysis; for example analyzing land use change over time. However, one disadvantage is the fact that because it is satellite imagery, localized analysis of features such as roads are inaccurate. This connects to the mixed pixel problem, which states that in raster at low resolution, all variation within a pixel is lost. I have included a number of images created in lab showing the pros and cons of this data. The image in red is a landsat analysis of landuse change for Mount St. Helens, while the green shows the mixed pixel problem at work; the vector line is the actual position of a road, while the pink and red raster pixels also represent the road; albeit a less accurate version from raster landsat data.
As a continuation from my last post, a peer of mine Blakely Brown and I have created an info graphic presentation outlining the DPSIR model framework (Drivers, Pressures, State of the Earth, Impacts and Responses) for large scale dams. I think that it provides an interesting and accessible way to understand the complex inter dependencies of humans and nature in the context of dams. I hope you enjoy! It is in PDF form and you can view it here:
The following is a term paper I submitted for my Geography 211 class on the state of the earth. This project I found to be really interesting, as researching it revealed just how interconnected and interdependent all of the human systems are to natural systems, specifically hydrological cycles and their effects on ecosystems. You dont really realize the extent to which you are wrapped up in all of lifes intricate cycles in daily life; technology has a way of taking us out of this down to earth, geographical frame to put us on a sperate, or higher plane. I believe the DPSIR framework is really helpful to putting us back into thinking about these important cycles of nature, and how our daily action may be harming not only other forms of life, but the future of human life. However, with any way of trying analyze interdependencies between incredibly broad, abstract cycles encapsualting all of nature and ecology, it is hard to focus in on specific examples that demonstrate issues in more tangible ways. I would thus hope that what you take away from reading this, is a frame of thunking about the world that increases your awareness of how essential water is in daily life; noticing the little things and understanding their working on a much larger scale in terms of our progress.
Because this is a blog I took the liberty of including some multimedia which help in the visual exploration of the scale of the environmental impacts of dams that I discuss. Feel free to check out the youtube video as well as the NASA site below before reading the paper; both are really helpful in providing some background context from which to start thinking about theses global environmental issues.
Progress of the Dammed: A DPSIR Framework Analysis of Dams and their Environmental Consequences
Environmentalist Patrick Mc Cully states in the opening section of his book, Silenced Rivers: “Dams… are concrete, rock and earth expressions of the dominant ideology of the technological age: icons of economic development and scientific progress” (2). Indeed, they embody humanity’s seemingly complete control over the external environment so integral to life on earth. By controlling our environment, humans are able to use the life forces of such environmental systems to further our progress. Dams play an integral part of this process by controlling arguably the most important force of nature: water. Water connects all living organisms on earth through providing the means for them to grow and adapt, as well as playing an essential role in the shaping of our physical environment. This ecological link of water to land is played out in a system called a watershed (Horner). The UNEP Global Environmental Outlook 5 defines them as “A group of linked water systems that can include rivers, lakes, reservoirs, wetlands, underlying aquifers and downstream marine systems.” (Gaddis, 100). Humans plants and animals are all also included in the watershed in the sense that the water provides a multitude of ecosystem services that are essential to life (Horner). The river is by far the most important to humans inside of the watershed system, as it is point in the water cycle at which humans have the maximum amount of control over the flow of water. Thus, dams serve to control not only the flow of water but more broadly, the ability of the watershed as a system to provide ecosystems services. The amount of control we have, and need over these ecosystem services is determined by a number of “drivers” and is dependent on society’s physical and ideological needs in furthering human progress (Kristensen, 2). However, by attempting to control such large, natural life forces, there are immediate observable consequences to the ecosystem services and the state of the environment, which in turn impact humans. While the control of rivers through large scale dams are beneficial to humans in a number of ways, I will argue that our ideological idea of ‘progress’ involving our ‘control’ of the environment is extremely problematic, and in many cases is actually detrimental to humanity and to life everywhere on earth.
In order to explore this complex human-environment interaction, some sort of system of analysis is needed. One such framework, adopted by the European Environment Agency (EEA) is the Driver-Pressure-State-Impact-Response framework (DPSIR) (Kristensen, 1). This framework separates the causal chain of human-environment relations into five parts. In this paper I will use DPSIR as a guide to trace the web of connection between human action and environmental response in terms of dams. I will first move to a deeper examination of the drivers aspect of DPSIR, as the reason that we build dams and attempt to control the forces of nature is ultimately the reason why we care about how the environment responds. Through this I will show how the magnitude and scale of drivers have accelerated in the recent past, and move into an analysis of the pressures that such development has had on the state of the environment in present day through scholarly research separated into three broad categories in relation to dams: Hydrology/Floods, Biodiversity and Human/Cultural. Through presenting research on how dams impact the state of the environment through pressures, I will also include how the state of the environment connects back to us by discussing what implications these changes have to society, or their impacts. Turning to the future, I will then consider in the Human/Cultural section, the link between our responses to the impacts of environmental degradation (from dams) and how this has affected and will affect our drivers. Through connecting the causal chain of DPSIR I then look towards what needs to be done so as to avoid unrecoverable negative changes to the hydrological system as a whole.
Globally today, there are an estimated 42,000 large scale dams, and an estimated 800,000 smaller scale dams (Rosenberg, McCully and Pringle). While the reason for controlling the flow of water in rivers has been explained, why have we built so many? The answer lies the driving forces of human action on the environment. Peter Kristensen from Denmark’s National Environmental Research Institute defines ‘Drivers’ as the primary (food, shelter) and secondary (culture, entertainment) needs of human societies, which influences how humanity will interact with the surrounding environment (2). Thus, the more a society progresses, the greater the magnitude and complexity of the driving forces becomes, due to the increased needs that have to be fulfilled. Ronald Wright, in his book A Short History of Progress discusses this idea of progress as increasing our needs, through the example of Sumerian civilization. Wright states that for Sumerians, “Arable land had literally to be created….In this case at least, the hierarchies of civilizations grew with the demands of water control.” (68). “Canals were lengthened, fallow periods reduced, population increased, and the economic surplus concentrated on Ur to support grandiose building projects.” (Wright, 79). From this we can see how human progress through the control of the environment (in this case water) ultimately leads to an intensification of driving forces, both primary and secondary.
However, Wright in his book uses these examples to show how such civilizations fell into ‘progress traps’, or problems inadvertently created by the development of a society through exploitation and abuse of its environment. Thus we must not only look at the benefits that our control of the natural world has for us, but also the negative effects it has on the surrounding ecosystems and cycles, which in turn will eventually impact us. As we know, our progress was accelerated through industrialization and the resulting massive technological advances, so that now more than ever, drivers put pressure on the environment around us through our need for resources. Some of the key influential drivers UNEP notes today are population growth, economic development globally, energy use, globalization and urbanization (Levy, 5). Thus we come back to McCully’s quote from the beginning of the paper. The reason we have built such an enormous number of dams is rooted in our ideology of progress as a species; they fulfill our needs in order for us to progress. Dams serve to fulfill multiple needs listed above: they give us flood protection, reliable and predictable water supplies for irrigation and industry, clean water for people and animals, as well as hydroelectric power. (Gaddis, 108). Now that we understand the background of how and why society puts pressures on the environment through dams, I want to turn my focus to the State and Impact section of the DPSIR framework. States are the effects that the pressures of dams have on the quality of the environment services and ecosystems around them. Impacts are the ways in which those changes in environmental quality affect the abilities of ecosystems to function, thus ultimately affecting human health and progress through providing ecosystem services (Kristensen, 3).
The most damaging impact that dams have on ecosystem services is the adaptation of natural hydrological flood cycles to be in tune with human drivers. The ecology of rivers are built on interacting cycles due to the seasons, these cyclical flood flows provide essential ecological functions for the health of the river (FitzHugh, Vogel). Because dams release water to generate hydroelectricity, they do so at times when power is needed the most, creating flow variation different from natural rhythms (Graf, 1308). Unnatural cycles of flooding mean that ecosystems which are dependent on the natural cycles for initiating other cycles such as reproduction, hatching, migration etc. are thrown out of balance, ultimately reducing the ability for those ecosystems to provide their essential services (McCully, 47). Floods also replenish nutrients to soil at specific times of the year which allow for regular growth and development in plants; if this does not happen the habitats of other non-aquatic species can also be affected, as well as the agricultural lands that depend on floodplains for their nutrient rich soils. By trying to control the natural hydrological cycles to fulfill human needs, the result is actually a reduction in the ability of the ecosystems to provide their services, through the creation of unnatural flood cycles. From here, we can see how different pressures that dams put on the state of the environment build on top of each other, creating multivariable impacts for human society. This increased complexity which means solving the problems they create becomes more difficult as they are more intertwined with human drivers.
Due to our ideology, our response to water insecurity is to build more, larger dams to provide more ecosystem services. However, As William Graf finds in his geographic study of U.S. dams, the bigger the ratio of geographical density and storage capacity of dams to the watershed capacity of the ecoregion, the greater the magnitude for potential damage to the surrounding environment through river fragmentation, ecological disruption etc. (1306). Thus the problem of unnatural flow variation multiplies through increased river fragmentation. Moreover, Graf and Mc Cully both point out the hydrological and geomorphological effects inside reservoirs. Reservoirs, by storing the nutrient rich sediment carrying waters from upstream it stops the waters from moving, increasing its temperature. This leads to unnatural chemical reactions, causing increased algal blooms, and bacteria which harm habitats and species within the reservoir as well as downstream (McCully, 38). Furthermore, by stopping essential sediments and nutrients from flowing freely, we are seeing a loss of deltas (McCully, 35). Deltas are areas in where rivers deposit their sediment load before entering the ocean, creating incredibly agriculturally productive areas; by losing them we are also losing the services they provide in terms of agricultural productivity. Also, the increased surface area of reservoirs leads to increased evaporation; “More than 7 percent of the total amount of freshwater consumed by all human activities (evaporates in reservoirs).” (McCully, 40). This leads to the deoxygenation of the water, which means saltier, nutrient stripped water travelling downstream (McCully, 40). Through irrigating the land with this water, you make it less productive over time, meaning smaller crop yields. It also has a direct impact on biodiversity by harming both aquatic and terrestrial life downstream (McCully, 39). Thus we can see how essential natural river cycle flows are to all of the ecological cycles connected to them in the watershed. The changes that dams enact on these ecosystems ultimately impact us through the reduction of ecosystem services.
This leads me to the second broad category which dams have a negative impact on: biodiversity. Biodiversity is negatively impacted through the changes to surrounding ecosystems already discussed, like affecting life cycles of plants and animals and through worsening water quality. However, I want to further this by examining dams effect on biodiversity in terms of migratory species. The one most obvious effect that dams have on species is through river fragmentation. Fragmentation of rivers is simply the function of a dam as a permanent barrier separating the river into ‘upstream’ of the dam and ‘downstream’, thus isolating species from each other and from movement throughout the river system as a whole (McCully, 31). Moreover, this fragmentation has geomorphological effects which reduce biodiversity by destroying the species habitat (McCully, 42). Salmon are an example of migratory species that have been extremely negatively impacted due to dams. Salmon are “anadromous” fish; they are born in the fresh upriver streams and migrate down to the saltwater where they grow up, and eventually migrate back upstream to give birth and die (McCully, 41). By drastically fragmenting rivers, salmon have species has experienced extreme biodiversity loss due to isolation and habitat destruction. Out of 400 species of salmon, only 214 remain, out of which 169 are threatened or extinct (McCully, 42). But why do we as humans care about biodiversity inside of ecosystems? As UNEP points out, biodiversity is essential to ecosystem services; the more biodiversity an ecosystem has, the stronger the ecosystem is, thus increasing the quality and consistency of the ecosystem services it can provide for us. (Gaddis, 135). Furthermore as well as reducing the resilience of the ecosystem, biodiversity loss also means a reduction of total yield for human consumption. The estimated 10 million yearly yield in the Columbia River basin before and dams were built has been reduced to a mere 1.5 million presently; three quarters of which come from hatcheries (McCully, 41). In expanding our frame from just salmon in the Columbia to biodiversity globally, we can see how migratory species worldwide, and indeed ecosystems are affected. Vorosmaty et al. find that 65% of global river discharge and the aquatic habitat it supports is under moderate to high threat. Thus, the degredation of the environmental services discussed above through disrupting hydrological cycles and reducing biodiversity is a diffuse issue, affecting many species, watersheds and peoples globally.
This global focus brings us to the Human/Cultural category of pressures and impacts. While I have made dams out to be evil, they do have benefits in terms of providing water security, or reliable sources of fresh water. Indeed, Vorosmaty et al. echoes this in stating that such technological investment produces globally significant, positive impacts on water security. However, they also find that because of this, highly developed countries have low level water security threats, even if the incident level threat is high. Thus, it is developing countries who have the highest threats to water security, as the only way they are able to receive these technological investments are through western powers such as the IMF or World Bank. Therefore, dams have deep ties to the global flows of bureaucratic, economic and political power (McCully, 241). What does this mean for who decides our progress? And further, what does this mean in terms of the dichotomy of who decides the state of the environment (through the negative environmental impacts of dams) vs those who actually feels the impacts of such environmental degradation?
The reason that wealthy, developed countries have low levels of water security threats is not just technological investment of the dams themselves, but also the technological investments that result from the environmental degradation that the dams cause. The impacts of dams that I have described in terms of hydrology and biodiversity ultimately have an effect on the wealthy countries. However it is in the resulting responses that actually allow for their needs to be met, and thus for progress to continue. As Vorosmaty et al. puts it “Rich countries…reduce their negative impacts by treating symptoms instead of underlying causes of incident threat”. Some examples of this in relation to the States-Impacts part of the DPSIR framework above are the use of chemical fertilizers to counter the loss of nutrients and the increasing salinity in soils, the investment in desalination plants to make said ‘fresh’ water fresh again, as well as the creation of fish hatcheries to make up for the dwindling number observed in yearly yields (McCully, 35, 41). While these technological investments are quick fixes, they don’t focus on the underlying causes and in many cases (specifically hatcheries), actually add to the impact on the ecosystem services. Additionally, by investing in developing countries through building similar dams, they reduce water security levels, but leave said countries to feel the environmental effects without having the money or power to counter these effects.
So, seeing as our current responses are actually creating more problems than they are solutions, what do we need to do to make significant and meaningful change before it’s too late? The scholars cited in this paper all have overlapping ideas as to possible responses which might help reduce water stress, while benefiting the environment. For one, Vorosmaty et al. points out that global water data is fragmented into country based statistic, but because water does not obey political boundaries, this limits efforts to prioritise areas of protection. FitzHugh and Vogel echo this, arguing generating more specific data for river systems could have practical applications in restoring places whose flow variation is affected the most. Graf, as well as Vorosmaty et al. also calls for a reworking of flow variation, stating that changes in dams rules and regulations could promote natural flood flows, and thus an improvement in ecosystem services (Graf, 1309-1310). Overall, the trend is towards a need for both preserving critical habitat regions, as well as moving towards a greater balance of needs of humans and the environment through integrated resource management (Vorosmaty et al.). However, as McCully points out, the outcome of the extensive damming of river systems globally is unknown. Dams are massive, permanent, environmental experiments with no previous studies done, thus their large scale effects will not be felt in this generation, but for generations years to come (McCully, 31).
Works Cited
FitzHugh, Thomas W., and Richard M. Vogel. “The Impact of Dams on Flood Flows in the United States”. River Research and Applications 27.10 (2011): 1192-1215. Web.
Gaddis, Erica B. et al. “Water” Geo 5 Global Environmental Outlook. United Nations Environment Programme, 2012. Chapter 4. 97-133. Web.
Graf, William F. “Dam Nation: A Geographic Census of American dams and their Large-Scale Hydrologic Impacts”. Water Resources Research 34.4 (1999): 1305-1311. Web.
Horner, Kate. International Rivers. N.p. n.d. Web. <https://www.internationalrivers.org/rivers-in-crisis>
Kristensen, Peter. “The DPSIR Framework”. UNEP Headquarters, Nairobi, Kenya. 27-29 Sept. 2004. Paper Presentation. Web.
Levy, Mark A. et al. “Drivers” Geo 5 Global Environmental Outlook. United Nations Environment Programme, 2012. Chapter 1. 3-33. Web.
Mc. Cully, Patrick. Silenced Rivers: The Ecology and Politics of Large Dams. London: Zed Books Ltd., 1996. Print.
Rosenberg, David M., McCully, Patrick and Catherine M. Pringle. “Global–Scale Environmental Effects of Hydrological Alterations: Introduction”. BioScience 50.9 (2000): 746-751. Web.
Vorosmarty, C.J., et al. “Global threats to human water security and river biodiversity.” Nature 467.7315 (2010): 555+. Health Reference Center Academic. Web.
Wright, Ronald. A Short History of Progress. House of Anansi Press Inc., 2004. Print.
The attached is an essay that I wrote last year for my Geography 122 class. It’s an examination of how natural disasters are not just concerned with environmental forces and factors, but how said forces are intimately tied with Economic, Social and Political factors inside the nation, as well as globally. In this case, I use the example of cyclone Nargis, which hit Burma in 2008 as a platform for such examination. I think that from understanding how these forces are interconnected we can begin to think about natural events and disasters differently, and hopefully communicate this understanding to others. After reading over this paper again I wish that I had added more about the global factors that led to the economic and political atmosphere in Burma, which in turn affected the populations vulnerability. So if/when you read it, keep in mind the global flows of power which led to the Political situation in Burma, as well as the geopolitical tropes of West-East inequalities through which you view Burma as a nation-state.