Katie Hunks
In Class Analysis of Drainage System

The Life Sciences Institute Building, UBC


The University of British Columbia, School of Architecture and Landscape Architecture
Katie Hunks
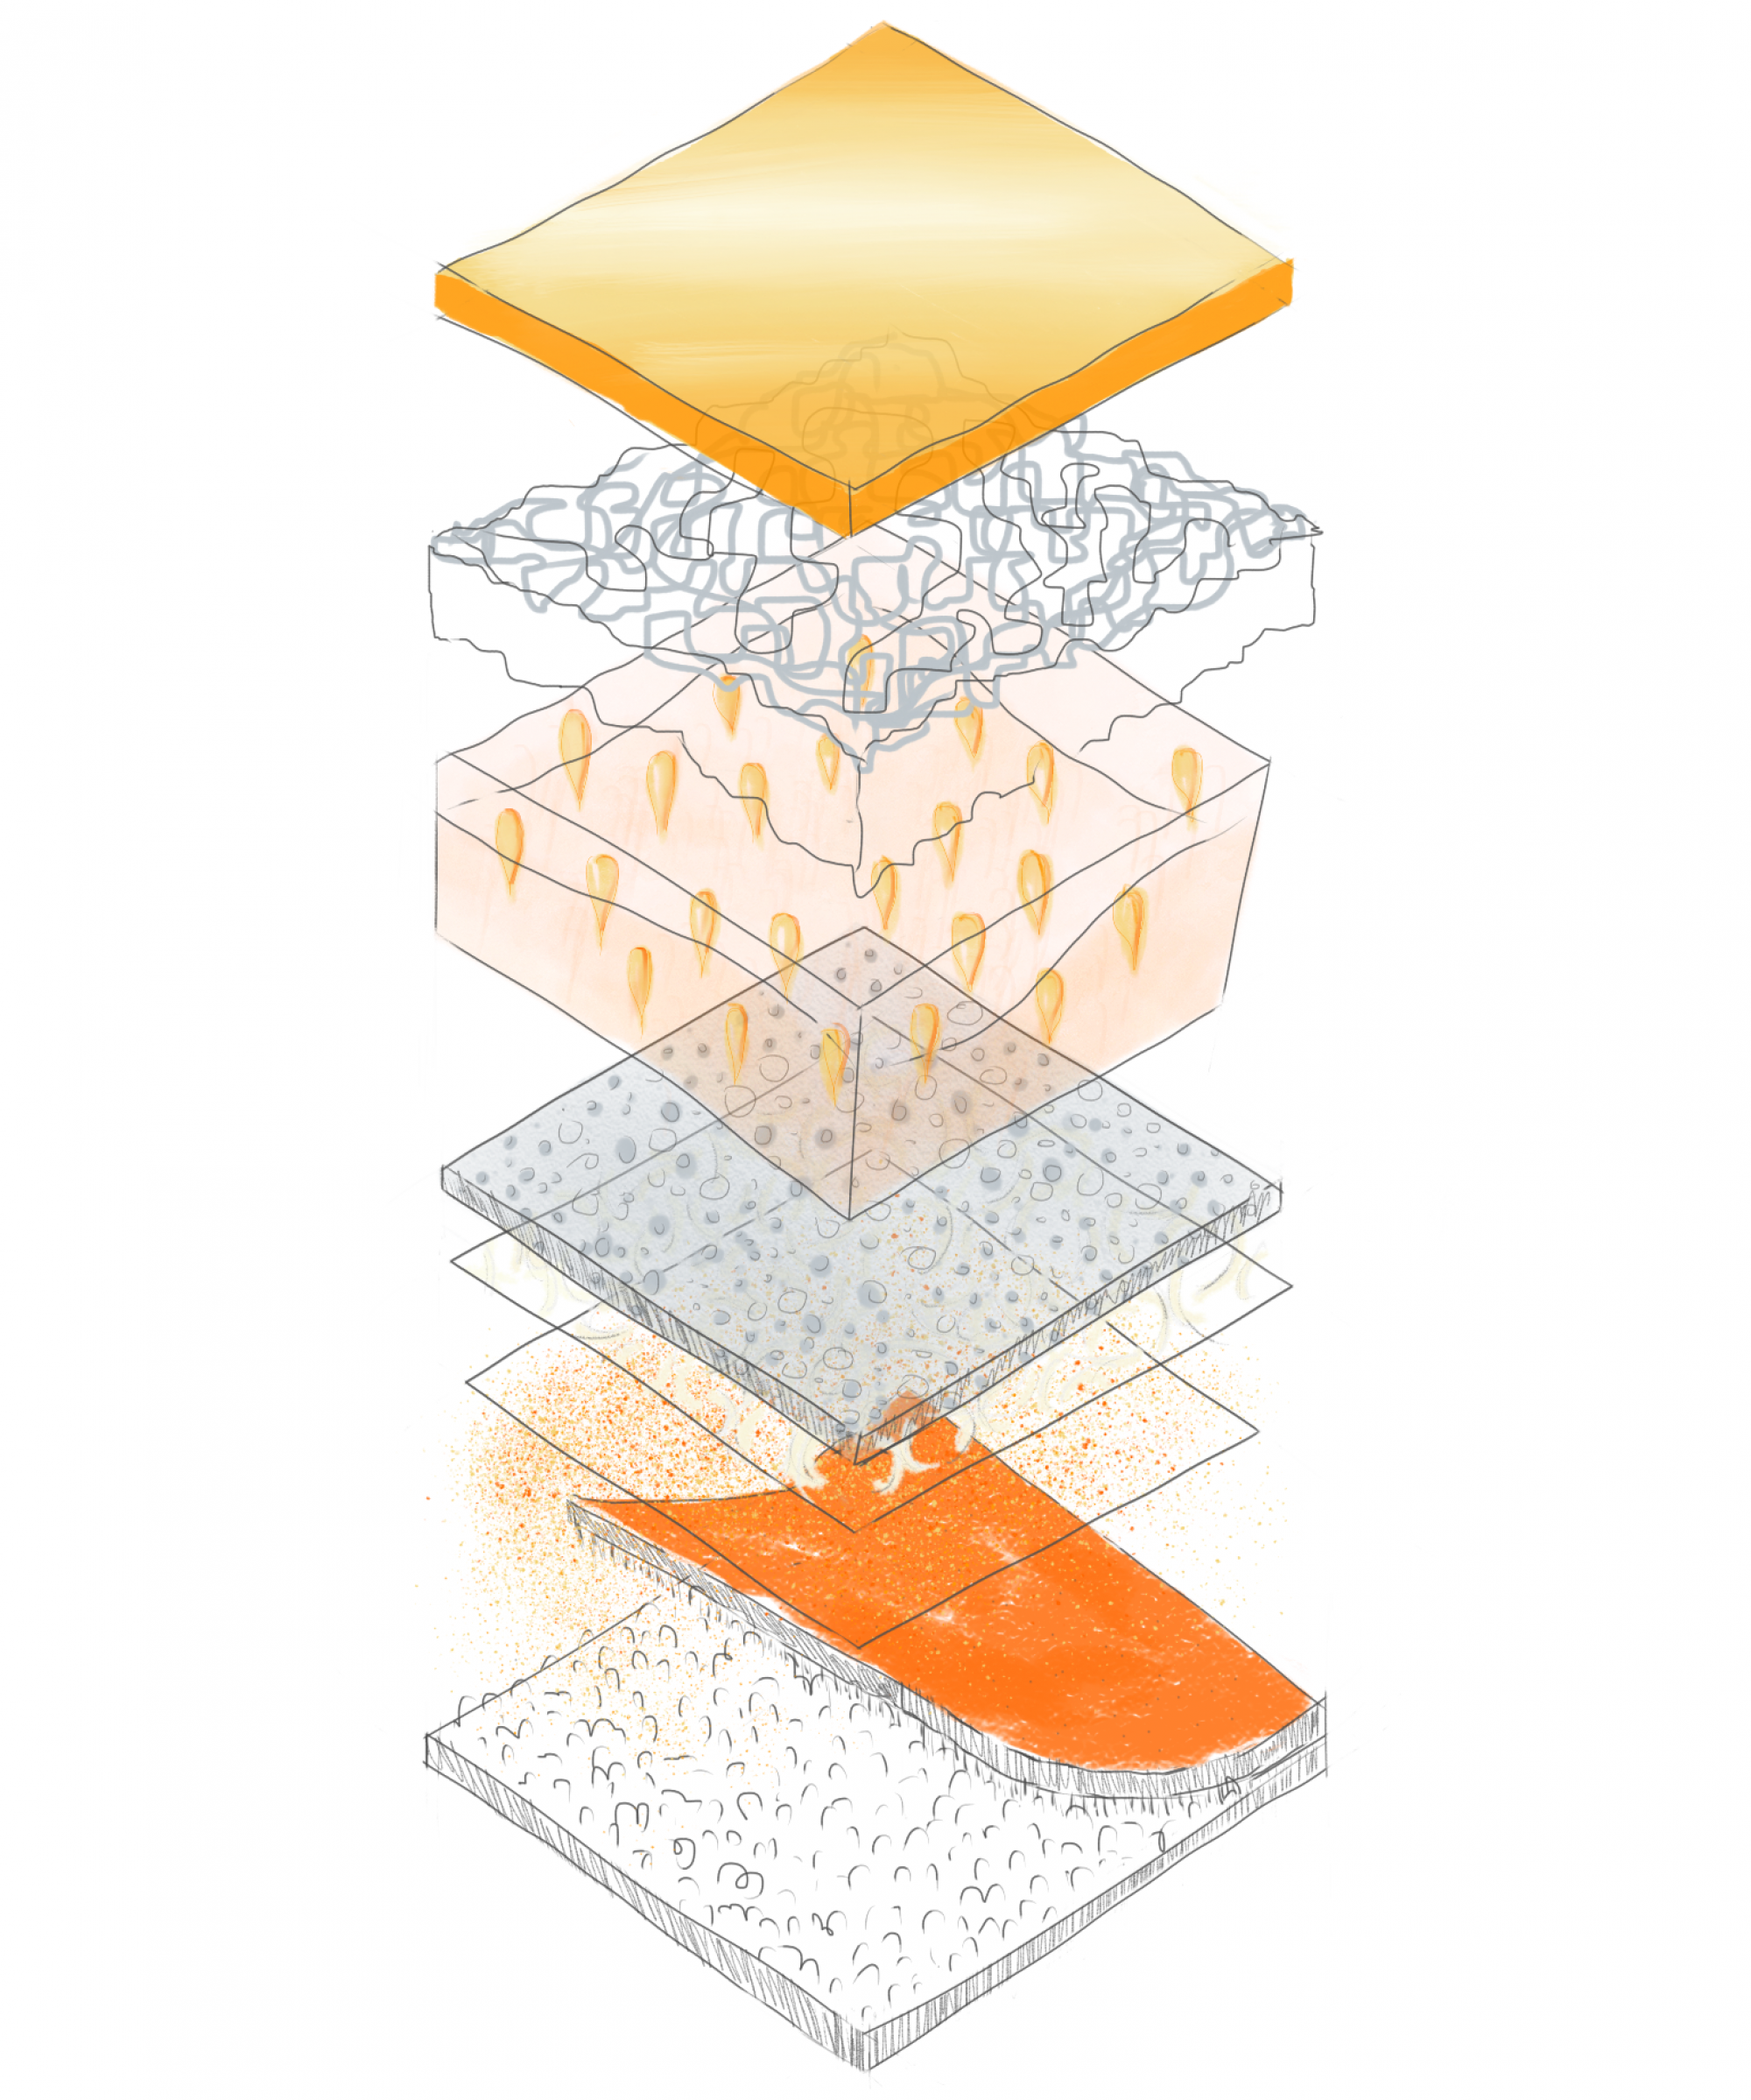
In Class Analysis of Drainage System
The Life Sciences Institute Building, UBC
In-class exercise
Rainwater flow

Rough version

Refined version

Block scale plan
Assignment 4
Sir James Douglas Elementary School

Base Plan

Green vs grey analysis

Green vs Grey + Program analysis

Green vs Grey + Program + Circulation analysis

Vegetation type analysis

Rainwater flow analysis

Long section showing scale of building in relation to adjacent landscape

Section showing relationship between building and road, also underground utilities

Ground level perspective showing materials and use of space

Axonometric showing the experience of the road, sidewalk, and the entrance.


Berend Kessler


Areas of Interest: After observing for a 30 minute period I noticed that the flight paths of birds in the park tended to concentrate in the north end (Area of Interest #1, top of page). The north end also experienced considerably less pedestrian traffic than the south end (Area of Interest #2, bottom of page). Perhaps the birds targeted area of interest #1, due to there being less pedestrian traffic…or were there other potential reasons?… (see Map #2).

Areas of Interest: Map 2 includes the added features of the locations of all trees and buildings within the park. In the second 30 minute period of observation, the flight paths of birds continued to predominantly concentrate at the north end of the park (Area of Interest #1, top of page). The north end not only experienced less pedestrian traffic than the south end (Area of Interest #2, bottom of page), but also has a much greater concentration of trees and the only 3 buildings in the park. As such, it is likely that the trees and buildings (perching spots/spots to rest) are reasons for why there was a heavy concentration of flying birds in the north end throughout my time in the park.
In the second 30 minute period, however, I also witnessed a cluster of flying birds in the southeast end (Area of Interest #2). The main reason why birds were attracted to this area this time around was because a man was feeding them food out of the garbage can.


More on the way….


Katie Hunks
In Class Exercise: Mapping the Sky


Mapping the Beaty Biodiversity Museum


Beaty Museum study on September 28th at noon


