Average Commute Duration and Sleep Deprivation in the USA
 Commute Duration and Sleep Insufficiency in the USA – Final Project
Additional Work:
Excel: Insufficient Sleep (Range Graded) and Mean Travel Data
Final Project
For the final project, I was tasked to create a quantitative multivariate thematic map to be produced as a 8.5 x 11 inch paper map.
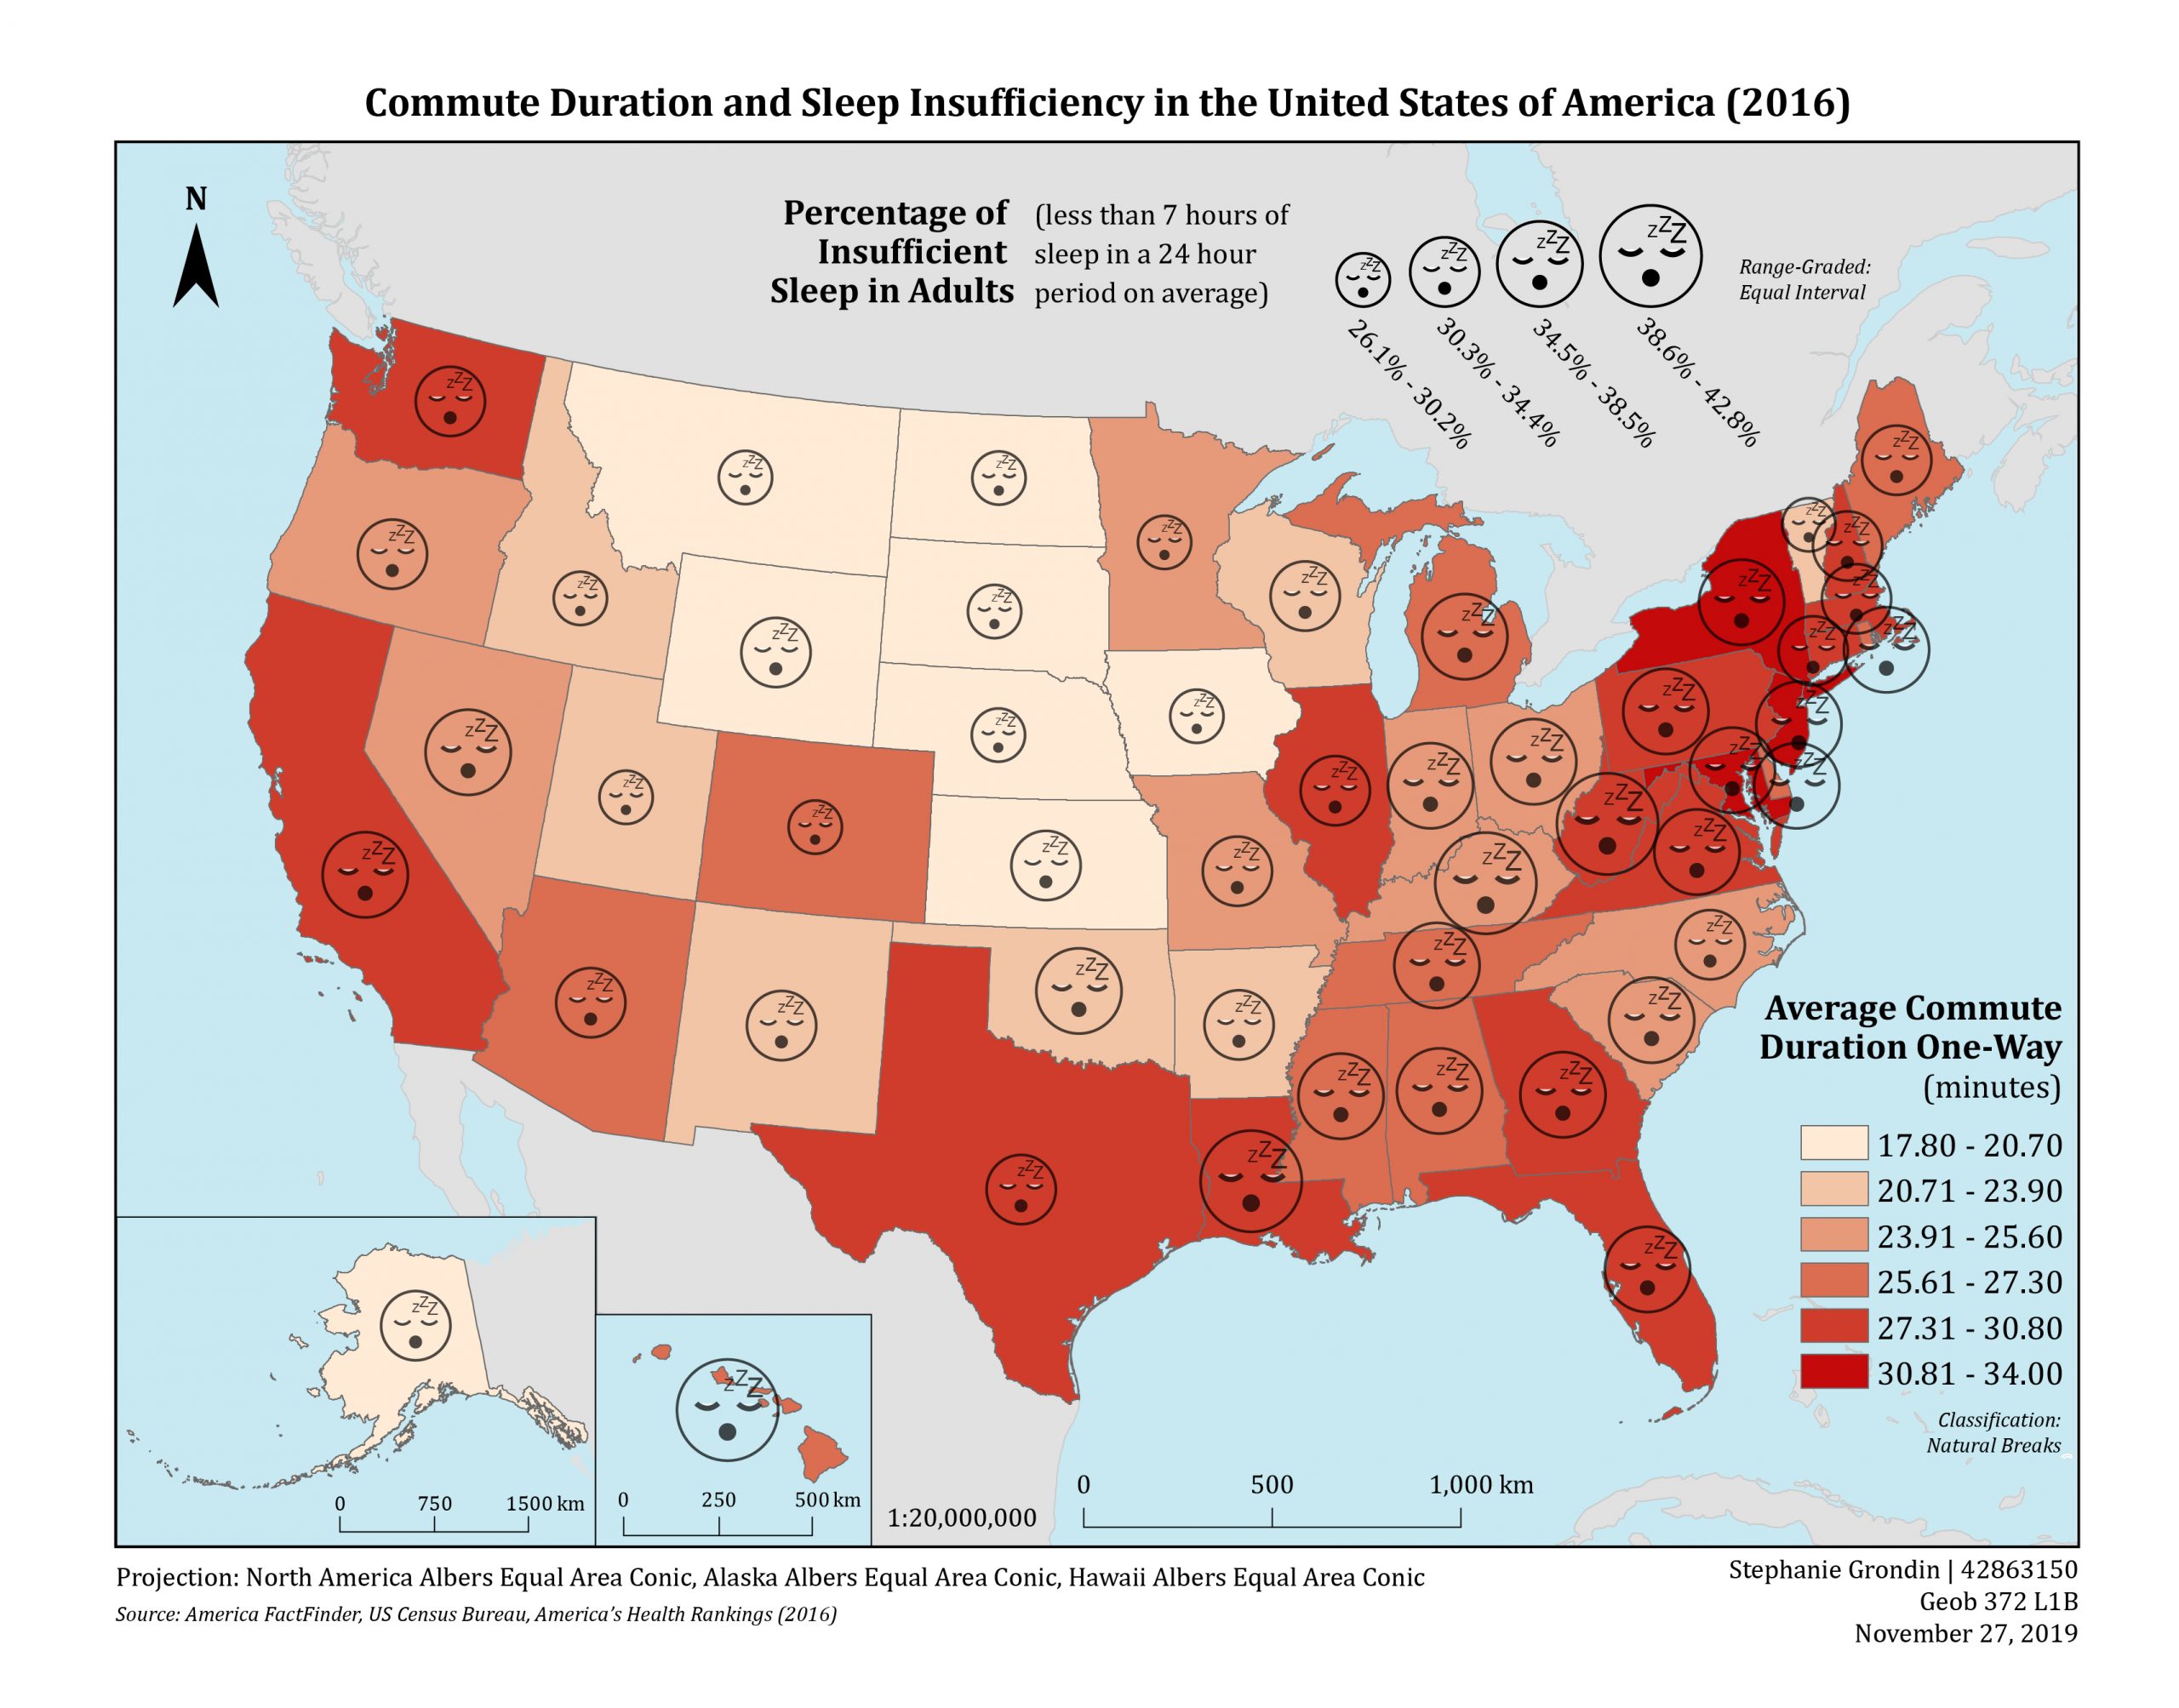
I picked the topic of average commute duration and sleep insufficient to test the possibility of a correlation between the two variables. It is important to note that a direct correlation cannot be drawn through only producing a map, other research would need to be conducted before coming to a conclusion. I chose the United States of America for my geographic location because the data produced by the USA is much more widely available for usage.
The first step I took was to create the choropleth map of the commute durations in the USA, in which I used America FactFinder to download data and join in GIS with base data to create the choropleth map. I then transferred the map over to Adobe Illustrator where I started created symbols for the second quantitative variable of sleep insufficiency. I first created a symbol with a cartoon human sleeping on a bed, but I ended up creating a sleepy face symbol. I was inspired in class when I learned faces are an easier symbol to read by the audience since humans are more in tune with emotions. Originally I was going to use absolute scaling for the symbols, but there was not enough variation between the circles. This resulted in using range graded equal intervals to differentiate the data. I then added all the essential map elements (title, neatline, projection, source, scale, north arrow, name, and date) to complete my final project.
What I learned:
- Working in GIS can be time consuming, but I learned immensely from working through any difficulties that problems can be solved if you persevere.
- It is easy to come up with a great idea for a map, but then it is time consuming to find data that ensures the idea is feasible.
- Even with all the bumps in the road I experienced when producing my project, it made me more incredibly proud of the final result.
Improvements for the future (takeaways):
- Labelling of the states would have been more effective to the audience.
- It is important to keep the text size the same for both datasets.
- An inset map of the East Coast would be useful to provide more clarity to the map user.