Least cost path analysis is a powerful tool in GIS that can be utilized to find a route that best suits a client’s ultimate goal in the most cost-efficient manner. In the case of the Lord of The Rings, finding a route becomes critical to the welfare of Middle Earth when Frodo Baggins is tasked with taking the One Ring from the Shire to Mordor and ensuring its destruction before Sauron recovers it. Although in the story Frodo succeeded in his quest to destroy the ring, there were many complications along the way that often left the hobbits in grave danger. The least cost analysis outlined in this project involves incorporating a multitude of factors to determine the best possible route. These include forests, rivers, roads, friendly and hostile cities, as well as friendly and hostile creatures or armies. Since the locations of friends and enemies in Middle Earth are not static over Frodo’s journey, a timeline of where each enemy is located will be considered, and his projected route will change with each time step of Frodo’s current location in an instance of time. To account for a major plot point in the story, the forming of the Fellowship of the Ring, we split the path into two segments: from the Shire to Rivendell, and then from Rivendell to Mount Doom.
Some limitations that need to be acknowledged are: we are working in a fictional world, and the data we are working with is also ‘fictional’ in the sense that it is not an accurate representation of Tolkien’s imagined world. It is subjective data generated by fans of the story and thus cannot possibly conform perfectly to what is described in the books. At its best it is a series of realistic-seeming hand-generated data, and as such it comes with a plethora of errors.
Because of this, we acknowledge that any analysis performed based on this data is highly subjective, and our results serve more as learning opportunities than accurate conclusions based on spatial analysis.
Our analysis rests on three key assumptions, detailed below:
- Our data is good enough to use.
- That our approximations of danger as a reduction in speed will yield results that we want.
- Our model is a good enough representation of the social and physical landscape for us to accurately and quantitatively perform spatial analysis.
Under these assumptions, we began our analysis.
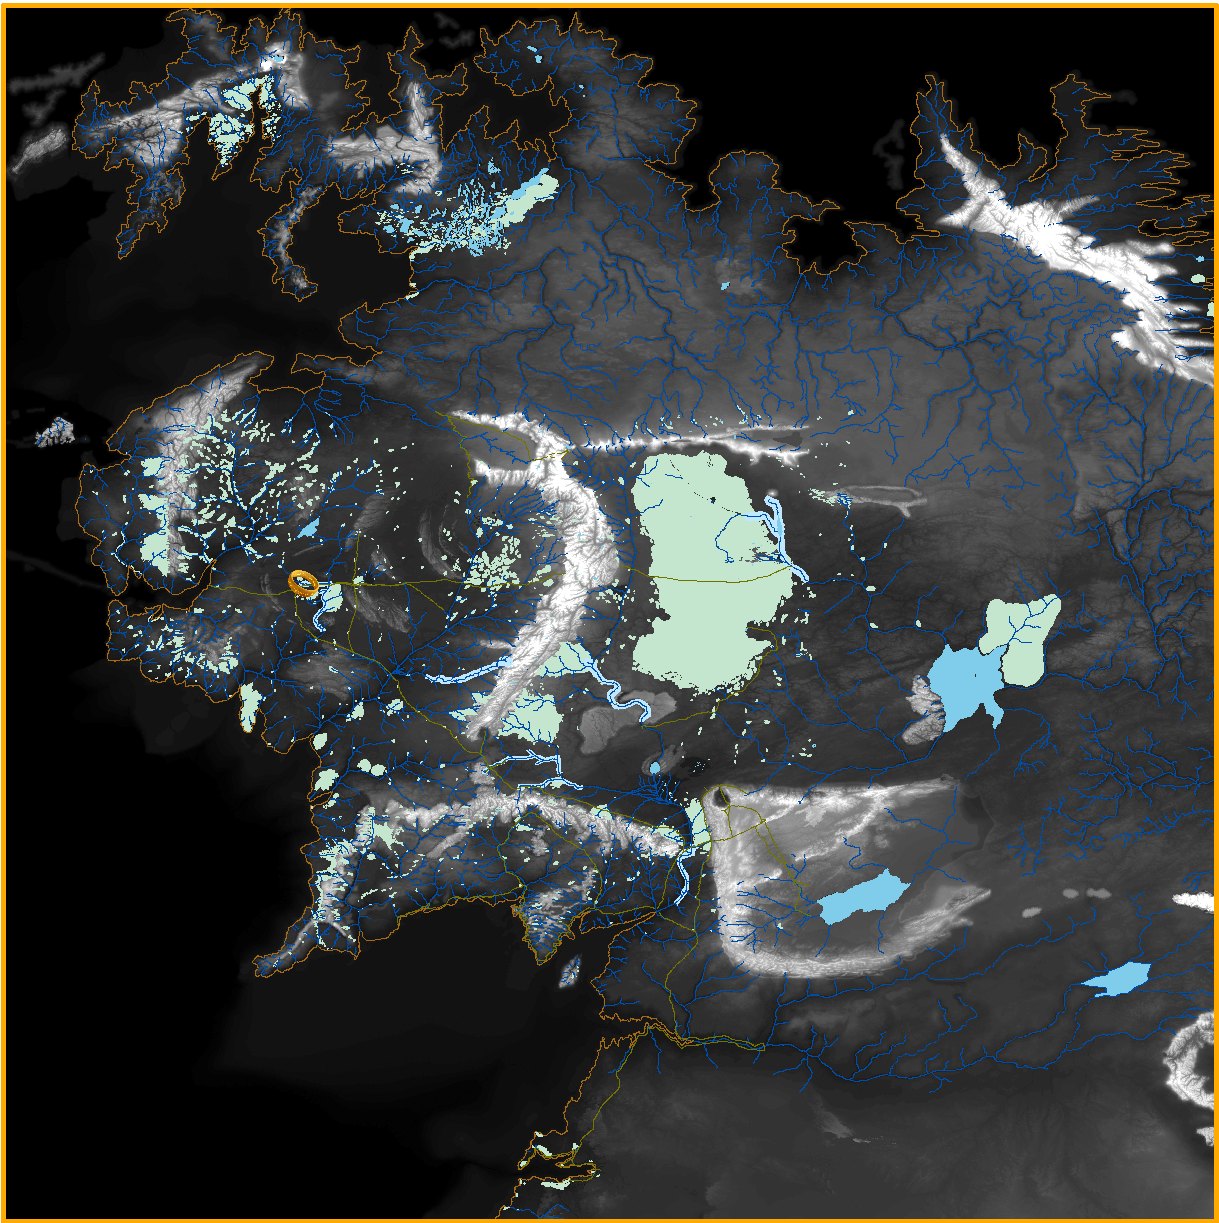
Figure 1.1 Grey-scale DEM basemap overlaid with Middle Earth GIS dataset, georeferenced to UTM Zone 31. Includes rivers, forests, roads, coastline (which is our boundary for our area of interest), and towns. The Shire is symbolized with the One Ring.