Over the past few weeks, the main goals for our CBEL Project have been clarifying our project priorities, researching possible solutions, and gathering all the existing data to determine the data we still need to collect.
Since we are dealing with more than one person, we were faced with a few discrepancies between our clients. However, situations like these are, overall, helpful because this is an issue that engineers deal with on a daily basis. After communicating between Brenda Sawada, Douglas Justice, and Dr. James Atwater, we were able to successfully settle on the main priorities of this project:
- Reduce erosion out of the culvert and down the cliff across the street from the Botanical Gardens
- Deal with potential stream flooding at peak rain periods
- Discover a way to make the stream more full during low rain periods
- Formulate solutions for possible water storage
- Innovate a way to slow down the water in the stream in general
Tasks and Expected Completion Dates
Our team is currently spending a great deal of time researching possible solutions and their effectiveness to achieve the goals above. The topics of research are:
- Implementing ponds in the stream – conducted by Helen Li and Aaron Chen
- Adding weirs in the pond – conducted by Li Xiang and Lindsay Piva
- Roughening the stream bed – conducted by Marshall Downes
- Diverting the stream into an external pond, and potentially pumping water from this pond for storage or irrigation – conducted by Chris Goody
For example, some research results of pond are listed below:
1.Advantages of using a pond
- Beautiful landscape
- Ability to store a large amount of water
- Easy to construct
2.Construction process
- Site Selection
- Planning and Design
- Construction
- Maintenance
- More details : http://www.aces.edu/pubs/docs/A/ANR-1114/ANR-1114.pdf
3.Some useful equations
Theoretical condition: stationary flow conditions
- nomal residence time= V (total volume)/Q (hydrological load)
The actual residence time, defined as mean residence time, tm, is always less than the nominal residence time, tn.
- e= V(effe)/V(total) =mean residence time/nomal residence time
- e=0.84[1-e^((-0.59(L/W)))]
4.Reference
http://www.aces.edu/pubs/docs/A/ANR-1114/ANR-1114.pdf
http://www.sciencedirect.com/science/article/pii/S0925857404000059
http://www.aces.edu/pubs/docs/A/ANR-1114/
The research phase of this project is expected to be completed by this Sunday. Lastly, we need to gain a deeper knowledge of open-channel flow. We have contacted Dr. Millar, an open-channel flow professor, for some guidance on this topic and are anxiously awaiting his reply. After the research phase and discussion with Dr. Millar, we will commence the on-site activities and the report-writing phase.
On-site Activities
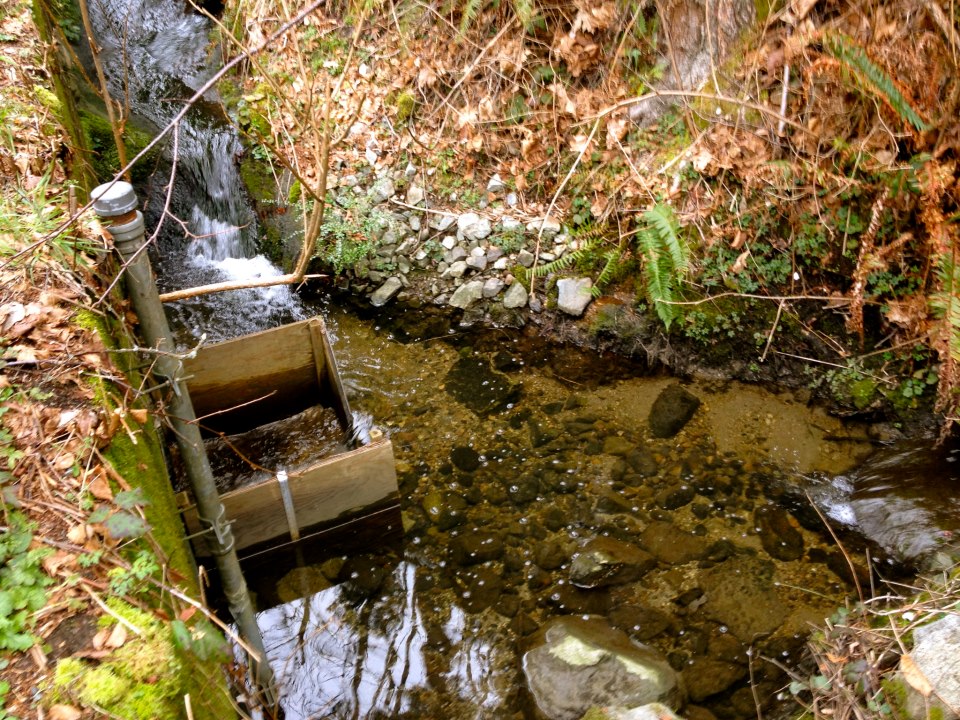
As mentioned in the last post, we realized that some students and professors had already conducted extensive research on the stream, called Rock Creek, that we are interested in. One of the professors, Dr. James Atwater, debriefed us on the previous project and led us in the direction of a student named Patti Shen. Patti is in charge of the data logger located at the outlet of Rock Creek and West Creek. We met her in the Botanical Gardens so she could show us where the data logger was located and how to use it. The data logger gathers important information from the stream, such as flow rate, water depth, and precipitation data. Below is a picture of the weir that holds the data logger:
The culvert next to the weir seen below is the outlet of Rock Creek:
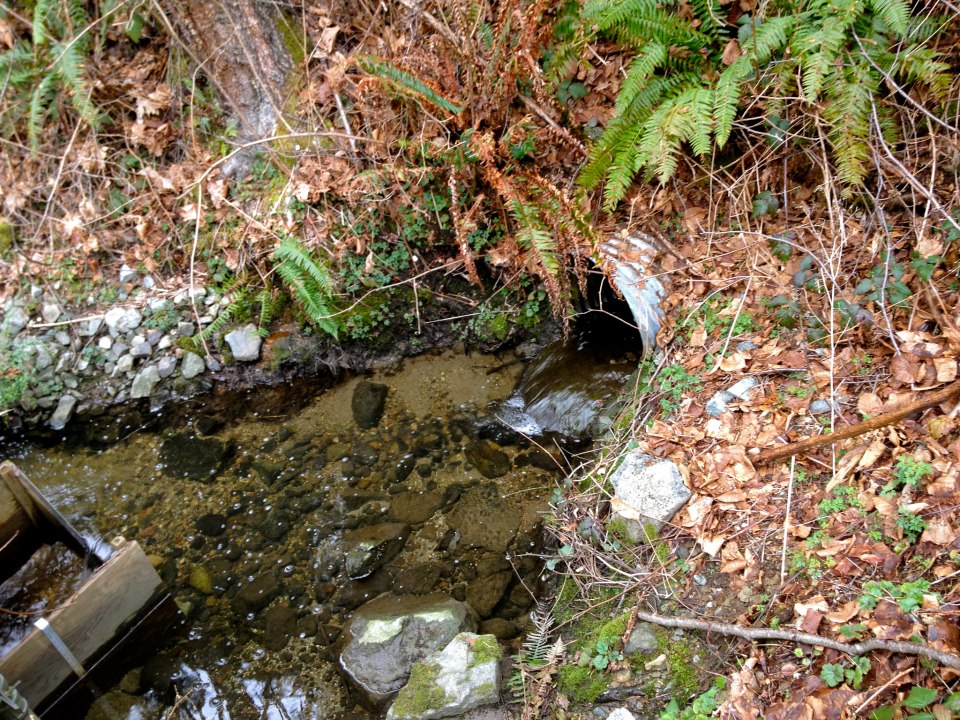
One of the big problems we encountered with this data logger is that an additional stream, West Creek, located near the entrance of the Botanical Gardens, has an impact on the flow rate. However, Patti informed us of an additional data logger located in West Creek. We can use the West Creek data to calculate the flow in Rock Creek by subtracting the flow in West Creek from the flow in the weir.
We have the data needed to calculate the flow rate (Q) in Rock Creek, but we still need to find the velocity. In order to calculate velocity (v), we need to measure and estimate the cross sectional area (A) of the water in the stream. Velocity can be related to flow rate and cross sectional area based on the following formula: v=Q/A . We will measure the area as a team next week.
In addition, we need to determine the elevation of the stream in order to determine its gradient. This will be done through surveying the stream on site, which we hope to conduct before next weekend.
List of Expected Completion Dates
- Sunday, March 10th: Individual research (listed above) will be completed
- Monday, March 11th: A team meeting will be held to delegate outlying project duties, and interim deadlines will be discussed. Report-writing will commence.
- Sunday, March 17th: All on-site data collection and measurements will be completed by entire group
- Monday, March 25th: Report and Poster will be completed by entire group
Indications of Success
We are currently finishing up the research stage of this project, which is planned to be completed by Sunday, March 10th. So far, we have met much success with the research conducted, and have determined that with whichever solution we choose, it will help reach our goals. As well, we have been having great success involving communication with our client. They make a deliberate effort to meet with us and are always available via email or phone call. If they cannot answer a question we have, they always send us in the direction of someone who can. Lastly, we have been able to successfully layout a plan and, once all outlying duties have been assigned and given a deadline, we can determine which solution, or combination of solutions, has the best balance between feasibility, expenses, labor and effectiveness.
Another excellent post!
I was interested in your comment in paragraph 2 about getting different information from different people. As you point out, this is very common and, while having the potential to be frustrating :), it can make for high quality learning.
Keep up this great work!!
—SN
Great progress!
There is a clear vision of how you will meet your deliverables. Is your progress faster than expected? Slower than expected?
I’m excited to see your poster!
Kelly