
Before creating the MCE output map, the three factors (Land use, Renter Percentage and Population Density within residential areas) must be normalized. All three raster layers were normalized using Fuzzy Membership (within Spatial Analyst – Overlay). Since we wanted larger values in the raster layers to be more significant, the Large Membership Type was chosen for both Population Density and Land Use. We chose the Small Membership Type for the Renter Density, as errors in the values occurred in several CT’s when using the Large membership. Choosing Small corrected the discrepancy. All mean and standard deviation fields were left to default and no hedge was chosen.
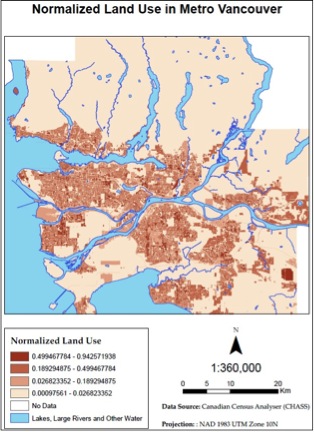
Figure 11. Example image showing land use, normalized using Fuzzy Membership.
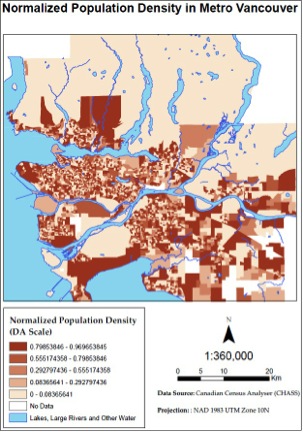
Figure 12. Image showing population density, normalized using Fuzzy Membership. Data is at the DA scale.
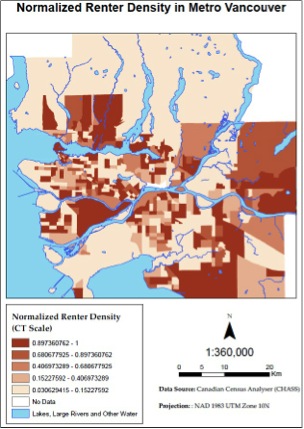
Figure 13. Example image showing number of renters, normalized using Fuzzy Membership. Data is at the CT scale.
Weighted importance of each of the three factors was chosen using the AHP method. After comparison of each factor, the weights are as follows:
- Land Use – 0.4600
- Population Density in Residential Areas – 0.3189
- Percent of renters per DA – 0.2211
The final weighted map was created using Weighted Sum (within Spatial Analyst – Overlay). All three fuzzy membership rasters are inputed with their corresponding weights.
Five areas with the highest MCE value were chosen to be the locations where car-share was most in need. These five areas must also lie within the POI buffer (Buffers_Zero_Count). Locations where MCE value was highest (~0.95) and within the POI buffer were identified manually by manipulating the symbology. If the particular class also lies within a POI buffer, it was considered to be a region in most need for a car-share.