Results
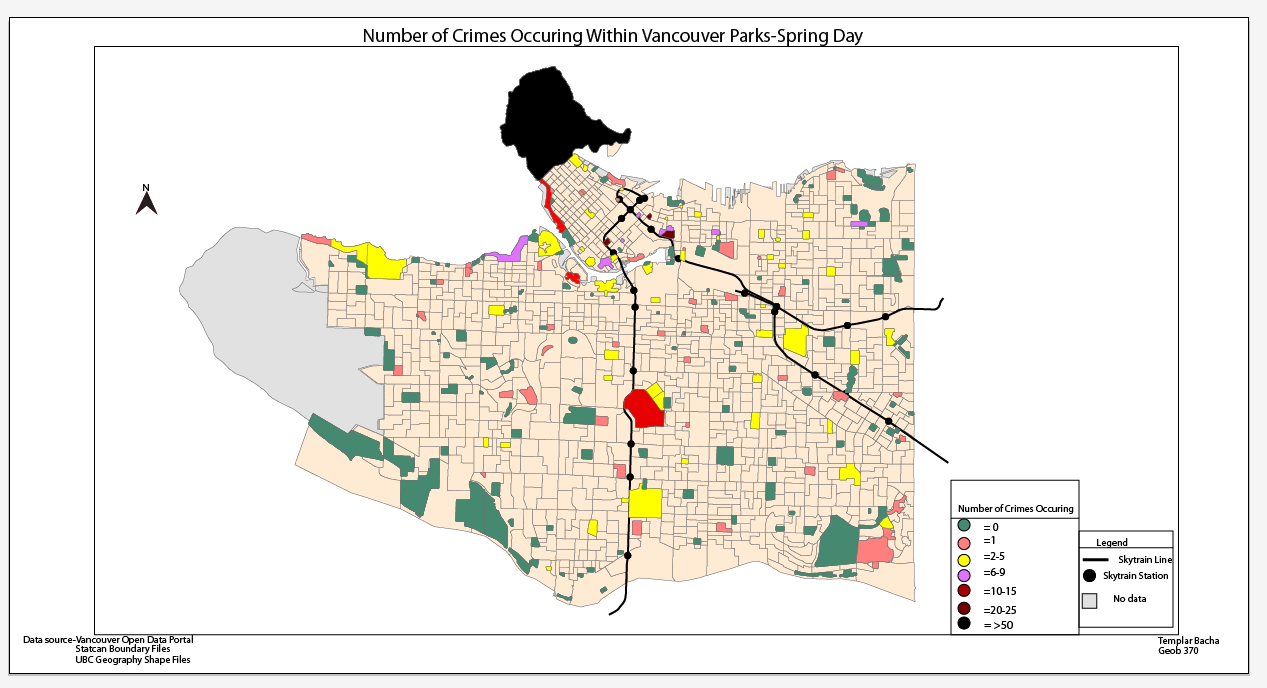
As mentioned on the opening page of the report, I had made a series of assumptions on how the data would change over the year long period. Though some of the assumptions proved correct, they were not all supported with results. It can be seen in the graphs that the number of crimes does peak throughout the year in Spring and Summer during the day time periods. Yet at the same time taking into account the proportional number of crimes, that is dividing the number of park crimes by the sum of crimes committed during that period it can be noted that the spring day category falls below Fall night and Winter day. Some logic can be applied to these findings and it could be considered that due to Fall nights high level of mischief crime, this could be taking place within parks specifically around the time of Halloween. At the same time there are scantly obvious reasons which point to the high level of crime occurring in parks during Winter days. As can be seen in the preliminary park maps which depict how crime is present throughout Vancouver parks, the assumption that parks along the beaches should show the highest crime level proved true. More over, for any season’s day time the highest number of crimes occurring in parks was almost always Stanley Park, English Bay, Kitsilano Beach and Jericho Beach. The exception to this finding was in the case of Spring day when Queen Elizabeth Park as well showed a large number of crimes.Though not necessarily important it is as well interesting to see that during the Summer day time season the sum of crime in Riley Park and Hill Crest Park is higher then any other season, meaning it is likely due to baseball games played at Nat Bailey Stadium.
The most surprising result for this project was that the presence of street lights does not appear to deter crime at night. Though crime is generally higher during the day then at night in the areas which I buffered street lights, from a proportional perspective the number of crimes occurring at night under street lights is far greater. This of course seems counter intuitive as the first thought would be that criminals would be more wary of street lights during the night time hours. Especially considering how minimal of a buffer had been placed around the street lights, that means these crimes were occurring almost underneath the actual light pole. When I first examined the data I thought this conclusion may have been due to the high level of crime in winter nights, but it was shown that proportionally Winter night crime under street lights is less than Spring Summer and Fall Nights (this is not total crimes committed where winter nights are far more, but proportional). I believe then that the reasoning for why crime is higher at night under street lights is due to the crimes committed, or lack thereof. During the day time hours for every season the number of crimes shows a more even spread between categories. Compare that to the night crimes where categorically the crimes committed are exceedingly uneven, with theft from vehicles being responsible for 40% or greater of night time crimes. From here the line of reasoning can be followed that as theft from vehicles is so high during night time hours then these crimes must be at least in large part committed on city streets. Therefore it is logical that as a high proportion of crimes are committed on city streets there likely would be a large number of crimes committed underneath the lights in proximity to the streets.
The assumptions made towards SkyTrain station’s crime were as well not completely backed by results. Within the Vancouver downtown there is undoubtedly a difference between how crime is committed during seasons. The stations of Waterfront, Granville,Burrard and Vancouver City Center, all show differences between seasons. More over, unlike the other variables of street lights and parks, transit station crime appears to be more uniform between its patterns of sum of crime and proportional crime. As well though discernible differences can be seen in the way crime appears at transit stations downtown, there appears to be very few noticeable changes for the stations outside of downtown with the exception of Commericial-Broadway which consistently has similar sums to that of the downtown stations.
The final maps which depict crime percentage analysis both display similarities and distinct patterns. In terms of street light crime it can be noted that for both day and night the largest percentages of crime are situated in downtown Vancouver. Yet at the same time, differences can be seen in the way crime occurs outside of the downtown core.Crime within 3m of street lights is more prevalent on Vancouver’s west side during the daytime hours. In turn during the night hours more areas of crime are present, but these areas are smaller and show a more east side spread. Transit crime shows a similar pattern as well, with most of the crime taking place in the downtown. Yet outside of the downtown stations there are differences which can be noted. During day time hours the Canada line shows far greater percentages of crime. In turn during night hours the Canada line crime reduces and instead the Expo line makes up the majority of non downtown SkyTrain station crime. Parks as well show similar patterns between day and night crime. The majority of crime occurring in parks for both times is within English Bay and Stanley Park. Day time as well shows that the other beach parks make up high percentages of the park crime, with Queen Elizabeth important also. Night crime shows a move away from the beach parks and Queen Elizabeth park instead with the percentages of crime increasing in the parks on the east side.
The hot spot maps depict through confidence intervals where crime is occurring.These maps show that between day and night time there is a shift where important street light crime occurs. During the day time crime hotspots are isolated to only Vancouver downtown but at night the street light crime hot spots show a shift which extends outside of the downtown area. Park hot spots show nearly an identical pattern between both day and night. The exception to this is is the area surrounding false creek where night crime appears to intensify. As well during day hours a hot spot of crime appears in Riley park which is not present during the night. More over, as expected transit station hot spots are identical, with only the downtown stations being considered hotspots.
Error and Uncertainty
- Due to lack of information and other relevant studies there has been a certain level of underlying uncertainty in how this project was conducted. The most prevalent uncertainty was in how to properly buffer each of the variables. Though I stand behind my buffer distances it is important to address the issue that different buffer distances would likely have changed all of the result for this project.
- When sorting the data I found that all seasons shared the same categories of crime except for Winter night. Instead Winter night had two more categories of , offense against a person and homicide. I chose to add these categories into the project as i did not what to arbitrarily decide what data be added and removed. As Winter night throughout the analysis showed a high rate of crime it is possible that these two crimes had at least had some impact.
- For simplicity sake I grouped the data into four seasons of three months each. Though Spring, Summer and Fall were all fine with these groupings, the classification of Winter as December,January and February may be misleading. As how the calendar year works the difference between December of 2016 and January of 2016 is 11 months, therefore by creating my winter season these three months I in fact chose three months which did not have sequential data.
- When looking at the SkyTrain station crime there was no emphasis given to when the SkyTrain closes. Therefore though station crime may be lower at night it could be possible that for the hours which the station is open that crime is in fact higher.
Future Improvements
For future projects similar to this, improvements which could be made are as follows:
- Looking at important dates such as Halloween, Christmas, Celebration of Lights for spikes in crime.
- Taking into account SkyTrain and Park hours.
- Possibly considering how the weather may impact crime
- Creating more accurate buffer distances.