Urban Environment and Densification Problem Case of Copenhagen

Before we discuss about the political origin of Copenhagen densification policy, we should have some background information about Demark.

“In 2008, urban population account for 87% of Demark total population.  Besides that, Copenhagen is the capital and most populous city of Demark”——Wikipedia.com

Policy’s political origin:


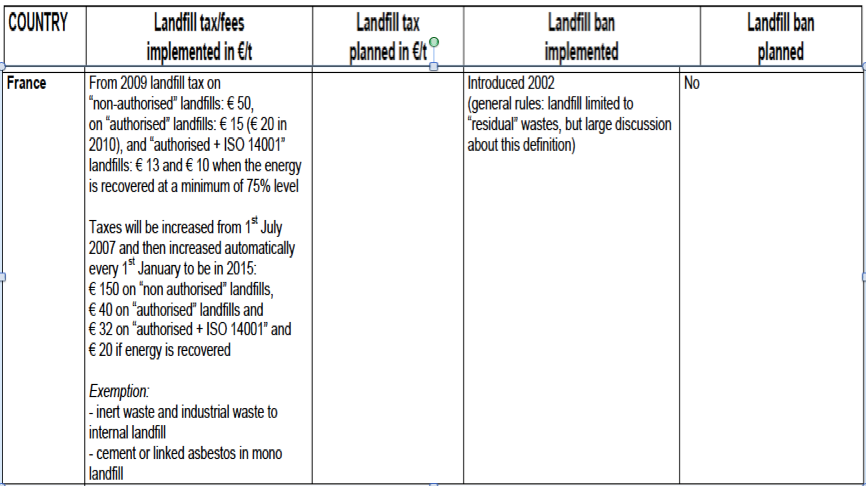
Since 1992, Danish National Government support for a sort of densification policy. From 70~80s, due to the legislation required fixed building densities/plot ratio on urban density. This artificial threshold and the urban renewal process lead to a decreasing density in central city district.  The fixed building densities/plot serve to the objective to secure more lights, more clear and a better urban living environment.


However, Brundtland report from 1988 point out urban sustainable idea. This idea argues that the densification actually contributing a sustainable and energy effective urban development.  At the same time, the disadvantages of previous policy begin to reveal.  Danish national government starts to think about a better way for supporting urban development and halters the negative effect of central urban area.


In 1992, Danish national government agrees the legislation work should focus on general level and majority of Urban Planning should be local task.  In 2001, the right wing government was selected.  Several new laws were passed and support for the idea of increasing social benefit and decreasing immigration.  Danish New elected government still keep a positive opinion for urban development.  Compared to the old government, more detail plan and law was passed for supporting urban redevelopment.


Goal of the policy:


The purpose of Densification policy is to create better urban living environment.  Danish National Government believed increasing the density would help Copenhagen become more sustainable.  By encouraging urban density, public transaction will be effectively used and constantly improving.  More infrastructures will be built in order to meet for increasing residents demand.


As there is a negative relationship between density and energy use per person.  Less energy and private automobile will be used.  This idea is not only attractive for the citizens but also property developers.  In Denmark, building new property in urban area is far more profitable than remolding old building complex.  As government a encourage densification, policy support for greener compact housing.


Coverage of densification Policy:

In Copenhagen, district Østerbro experience the most intensive development in 1990s. “76.000 square meters of housing and 150.000 square meters of offices and retailing has been built during the 1990s.”—- Urban densification: An innovation in sustainable urban policy (2001)

Østerbro contained three main part:

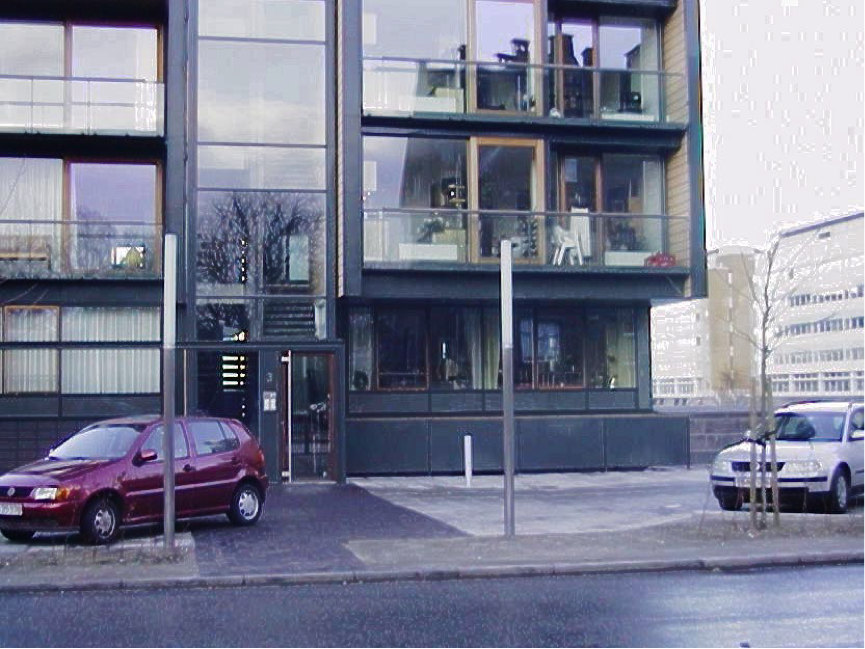
1. Housing district of 5-6 storey closed blocks with small spots of remaining detached houses or villas

2. Park Area, which in the central of the map was hospital, university and Sports Stadium.

3. Port Area where currently having sustainable development.


The areas being redeveloped are former harbour areas, derelict sites, old military barracks (Marked with

red), but also smaller sites (marked with yellow) in the part of the urban districts with lower densities.

After the sustainable development, the population density of Østerbro increased by 5.9% and it is higher than the general density level of Copenhagen.

Copenhagen Region Development Council has proposed by applying densification idea public transportation will be utilized and less energy will be consumed. However, in the long run, the effect of densification will be limited.


Distribution Effect of the Densification:

As developing new property is more profitable for developer, more and more building was build in district Østerbro.  The property price of those new developed building always have higher price in the market.  Most of the buyers are high-income couples or single person.  In addition to this policy, Copenhagen stopped building low-income social house.  In Østerbro, the average income of residence is higher other Copenhagen district.

The distribution effect of that urban densification is unsatisfactory.  As densification encourage more people live in a better-designed urban environment, it is important to ensure people form different income level share this same idea.  From previous example, although Østerbro meet higher urban density level, people who choose to live there are high-income people.  Low-income people have marginal influence of this densification policy.  In the long run, increasing property price and inequality of sharing better urban planning will limit the urban densification continue to growth.


Moreover, increasing of employment is usually coming along with the increasing city density. Since 1994 to 2000, 2000 more jobs are created in Østerbro. (about 8% increase). The benefit is creating more jobs is much lower than expected.

However, 15% of resident in Østerbro are local employed.  Most of the residents who can afford the price work in finance sector. They require a more commuter out of town or leaving municipality.


Effectiveness of Denmark Densification policy


From my perspective, I do not believe that Copenhagen set a good example of urban densification from two aspects.

  1. The distribution effect of urban densification.
  2. Socially Sustainability


From socially sustainable point of view, people who live in the city should develop a good public relationship with each other.  More public land and community fertility should be build for helping new people involve into new urban community.  Copenhagen mainly focus on the energy saving and utilize public transportation when conducting the urban densification planning.

Compared to Copenhagen, Tokyo did a better job by encouraging private investment on public use are and community development.  In Tokyo, the public land, such as sport stadium, offer opportunities for residence to integrated into local community.

All in all, better sustainable urban design is both economical and cultural sustainable.


Reference:

1. Anne Skovbro. Urban Densification: An innovation in sustainable urban

policy?
http://www.sbi.dk/eura/workshops/papers/workshop6/skovbro.htm

International Journal of Urban Sustainable Development


2. http://en.wikipedia.org/wiki/Denmark


3.http://www.cbc.ca/news/canada/british-columbia/story/2009/06/15/bc-vancouver-min-suite-zoning-law.html

Germany Truck Meter Plan:

In human history, automobile bring a great convenience to everyone daily life.  With the great benefit that modern society provided, we now need to rethink about our driving behavior and fully utilize our traffic system.  Traffic Congestion is and always is a big headache that every modern society developer.  No matter it is in China, US, UK or Canada.


A revolutionary plan has been carried out in EU, both Netherland and Germany are planning to apply the Meter Plan.  The originally idea of using GPS technology to measure automobile moving distance comes from Netherland.  Unfortunately, as 2010 new election in Netherland, the GPS meter plan was put on the shelf. New elected Netherland leaders use the term “tax burden of people” to describe this revolutionary technology.  But actually, using GPS meter plan has several advantages.  The first one is cutting the necessary cost for taxpayer.


I know, this sounds ridiculous.  How come the meter plan will cut the cost of driver?

In fact, GPS meter plan will decrease the average cost of driving.  As GPS meter system directly measure distance of driving and bill the car owner, this provides a more justified basis to collect the toll.  In another words, not everyone have to pay the same toll.  Moreover, GPS meter system will be a prefect substitute of registration fee or any other taxes for controlling the traffic.  In the country of China, most of provinces still keep the administration team to collect the bill.  After apply this new opportunities will substantially decrease cost of maintaining road.

In Germany, the name of this project is “LKW-MAUT Electronic Toll Collection System”.


Two main services to collected the toll:


“ On Board Units (OBU) or Manual payment terminals, OBS work via GPS and the       on-board odometer as backup to calculate how far the Truck have travelled by reference the digital map and GSM to authorize the payment through internet or wireless link.

Manual payment is for those trucks without OBU, there will be over 3,500 toll payment terminals at motorway service stations or rest areas where driver can enter the details of their journey.” [1]


Here is the diagram illustration about how this system works:

Of course, there is an administration team to enforce this new toll system. 300 cars and 540 officers formed the Federal Office of Freight.  Those cars were equipped with high resolutions camera, Dedicated Short Range Communication system and IR detection system.   In one sentence, those administration teams will enforce the new toll system, collected the evidence and stop the violation behavior.


The Coverage of Toll System:


Germany new toll system only covers the trucks.  There are some hidden issues to explain why these systems only cover trucks.

  1. Privacy: One of the biggest drawbacks of this system is GPS will allocate your position whenever you go. Privacy issue is a big headache for the program developers.  This drawback directly influences the public support for this toll system.  However, from my perspective, this concern is unnecessary as modern technology could easily track people’s location by checking cellphone, Internet connecting point.

  1. Capacity: Now the performance of this new system is well.  LKW-MAUT system can monitor about 1.3~1.5 million trucks.  Now, the registered driver is approaching to 1 million.  However, the total number of cars in Germany is about 56 million. [2]  It will be too ambitious to apply this system to all type of cars.  The whole system will face a lot of challenges both form public and current technology.

The Environmental and Distribution impact of LKW-MAUT

First thing I need to emphasis is LKW-MAUT was not only tax on distance truck driver moving but also tax on the carbon emissions.[3]   From my perspective, this is a brilliant idea in design phrase.  As it serve for the purpose of changing driving behavior and cut for the carbon emission.  This tax will also encourage people to adopt oil-efficient technology.  The reason is quiet simply, as the marginal cost of emitting growing higher, people have the incentive to adopt greener technology in order to maintain profitability.

Moreover, I do believe this a revolutionary technology. As drivers were taxed by the distance they drive and their carbon emission, drivers who drive less do not need to pay the same amount of toll or registration fee.  This is a better platform compared to current one, as people are who drive for a longer time and longer distance share more responsible of traffic congestion.

The distribution effect of LKW-MAUT is obvious, logistic company have to pay more under new system.  Citizens or taxpayers are the beneficiaries as they could pay fewer tolls.  Poor people are not touched by this new system yet.  But if the coverage of this system were expended, people who cannot afford the cost will drive less.  Poor people will live near to urban area, public transportation system will expended as more people are using this travel system.


The performance and Effectiveness of LKW-MAUT:


From my perspective, the performance of LKW-MAUT is very well.

There are two indicators:

  1. Constantly updating the monitoring system

Germany administration teams are trying their best to close the loops of this system.  Companies’ undated new digital maps increase the accuracy of satellite system.  “In 2007 Toll Collect extended the scheme onto major trunk roads in Germany to prevent what was seen as toll avoidance by some truck drivers.”—- (Roadtraffic-technology.com)

  1. Number of registries driver:

The Number of driver is increasing. Now is approaching to 1 millions. This indicates new toll system is become popular in Germany.


The effectiveness of LKW-MAUT

LKW-MAUT effectiveness is mainly dependent on enforcement team.  As the design of this system is the best option for us, truck drivers are taxed by the distance and carbon emission.  The enforcement team is the key to make sure this system is operated as its designers’ idea.


In Conclusion, I do believe LKW-MAUT is a very good system to solve the traffic congestion.  As GPS tolling system still in its early age, there are still many obstacles in its implementation.  Privacy concern for the public is one the key problems need to be solved or compromised in the future.


[1] Information selected from roadtraffic-technology.com

[2] http://www.kampuslanding.com/transportation.html

[3] Information selected from roadtraffic-technology.com


Reference:

http://www.kampuslanding.com/transportation.html

[1] Information selected from roadtraffic-technology.com

[2] http://www.kampuslanding.com/transportation.html

[3] Information selected from roadtraffic-technology.com

EU Landfill Tax (France)

EU landfill Tax: (France)


Many EU states have introduced landfill taxes.  The highest rates are found in the Netherlands, (86 euros per tonne for low density waste and 14 euros per tonne for non-combustible high density waste), Flanders (62) and Denmark, (more than 50 euros per tonne), Austria and Sweden (40 euros per tonne), Wallonia, UK and Finland (more than 20 euros per tonne).  Ireland, France, Czech Republic, Italy and recently Cataluna have introduced landfill taxes of 7 to 15 euros per tonne (CEWEP, 2004).


Aim:

A major reason for assessing the success of landfill taxes across EU countries is a countries ability to comply with the 1999 EU Landfill Directive (99/31/EC).

It has set targets for existing sites to:

l   Reduce biodegradable municipal waste sent to landfill by 75%, 50% and 35% of that produced in 1995 by 2010, 2013 and 2020 respectively.

l   Ban landfill of hazardous and non-hazardous wastes together from July 2004

l   Ban liquid waste, and certain hazardous wastes by 2001

l   Ban landfill of whole tyres by 2003 and shredded tyres by 2006.


France Aim:

The direct aim of the tax was to have a significant incentive effect through the “price signal” passed over to landfill users. It was implemented to streamline French waste management through increasing waste recovery, and providing for full cost recovery of waste management. It is one of the policy instruments of the national strategy to restrict disposal to landfill to final waste only that cannot be recovered by any other treatment by 2002. An indirect aim is to finance the Modernisation Fund for Waste Management (MFWM), created in 1993 and run by ADEME.


Tax Rate Detail:


Revenue:

Basically the revenue will be collected from every householder.

All persons or legal entities operating a household and assimilated waste landfill site – whether they have been granted authorization or not – are liable to pay the tax.


But is it revenue neutral?

France Landfill tax is not revenue neutral.

The landfill tax payments received by ADEME were up to 1999 fed into the MFWM, instituted by a decree of March 1993 (number 93-744) and administered by ADEME. —Economic Instruments.com


Coverage is very clear but far away from perfect:

One of the issues about France Landfill tax is definition about “waste”.  Fortunately, France waste definition has been improved after authorities acknowledging the “grey area” in waste, and the lack of data in this respect.


The type of the waste is classified into four main types:


l   Household Waste (HW)

l   Other Municipal Solid Waste (MSW) waste

l   Mixed Industrial Waste (MIW) inert and harmless industrial waste e.g. paper, board, metals, wood and plastics from industry, administrations, retail, services which do not require any special treatment (disposed on Class II & III landfill sites). Other type of waste (not municipal)

l   Other type of waste (not municipal), mixed industrial waste (MIWS) collected separately amounts


Within 150 million tons of wasted been taxed, MIWS account for 100 Million tons. However, the disposal pattern is not well known as these do not follow the municipal Waste Path. (and so are not in the control of local authorities).  It is estimated that 90% of MIWA is disposed in owner-operated landfill sites. Only 8% of total MIW is disposed of in public landfill sites.


But how to deal with the landfill waste, which is harmful to environmental, is unknown. Moreover, MIWS was not control by the municipal.


l   Appropriateness of land fills tax (France)

Because there is lack of data, we are can observe the appropriateness of land fills tax from the performance of this tax.


ADEME estimated that 59% of total household, municipal and mixed industrial was still being landfilled in 1997 against 61% in 1989 and 63% in 1993 (Ecotec, 2001). Although municipalities typically have fixed-term contracts with landfill operators, some have switched to incineration and sorting / recycling since 1997. In 2005, new targets were set by the French Government on the amount of household waste going to landfills or incinerators. The aim is to reduce from 290kg per head in 2005, to 250kg by 2010 and to 200kg by 2015 (ENDS, 2005). The new landfill campaign intended to feature increased information available to the public as well as the fiscal measures. The tariff for electricity produced from waste-derived biogas is to be increased by 50%. The national tax on polluting activities (TGAP) is to be doubled for waste dumped in uncontrolled landfill sites (ENDS, 2005). It is hoped that this increase in TGAP will speed up the closing of all uncontrolled sites at least within the target of 18 months. French local authorities will be given powers to levy their own taxes on waste sent to dumps and incinerators. A national plan for the development of composting is hoped to be in place by mid 2006 (ENDS, 2005).

Even though the French Landfill tax is relatively low and landfilling is often still the cheapest option, the mixture of the landfill tax with regulations (including a ban on the landfilling of untreated waste in 2002) has meant that the amount of waste going to landfill did not increase and the patterns that existed in the 1990s continued into the early 2000s (Bartelings et al., 2005). Over the years 1993 to 1997, the share of landfilling in waste disposal in France decreased from 64% to 59%. Since 1997, some municipalities have switched to incineration and sorting/recycling, even though they probably have fixed term contracts with landfill operators (Bartelings et al., 2005).


References

ADEME, 1998, Taxe parafiscale sur la pollution atmosphérique – Rapport d’activité 1997.

Bartelings, H., Beukering, P. van, Kuik, O., Linderhof, V., & Oosterhuis, F., 2005. Effectiveness of landfill taxation. IVM report R-05/05, Institute for Environmental Studies, Vrije Universiteit, Amsterdam.

Ecotec, 2001. Study on Environmental Taxes and Charges in the EU. http://europa.eu.int/comm/environment/enveco/taxation/environmental_taxes.htm

ENDS, 2004, Environmental Daily 13/2/2004.

ENDS, 2005, Environmental Daily Issue No. 1946, September 2005.

British Columbia Carbon Tax Overview Report:

The Policy Origin of BC Carbon Tax:

In November 2007, the “Intergovernmental Panel on Climate Change – representing the most respected climate experts worldwide – issued a report with the most decisive evidence yet showing that Earth’s climate is changing because of human activities. The effects will continue to worsen if no action is taken.

Based on those decisive evidences, BC government launched Revenue Neutral Carbon Tax. The goal of the carbon tax is reduce 33 percentage of greenhouse emission by 2020.  This carbon tax is equal to 800,000 car off the road annually.

What is the Carbon Tax?

Carbon tax is defined as a tax based on greenhouse gas emission generated during burning fuel.  Carbon tax put an additional expense on greenhouse gas emission. This policy will elicit powerful market to response to entire economy, resulting reducing carbon emission.  According to this statement from BC ministry of finance, we understand Carbon Tax is aim at using market power to change the dependence of fuel energy and to protect the environment.  But there are any principles for BC Carbon Tax policy?  The distribution effect of carbon tax is always controversial to the public.

Here are five Principles of BC Carbon emission:

l   All carbon tax revenue is recycled through tax reductions

This mean the Carbon tax revenue will not run into government running program. That money collected by carbon will use to reduce the income tax of individual and corporation rather than to fund government program.

l   The tax rate started low and increases gradually

 l   Low-income individuals and families are protected

“A refundable Low Income Climate Action Tax Credit is designed to help offset the carbon tax paid by low-income individuals and families.”

 l   The tax has the broadest possible base

 Virtually all emissions from fuel combustion in B.C. captured in Environment Canada’s National Inventory Report are taxed, with no exemptions except those required for integration with other climate action policies in the future and for efficient administration.

 l   The tax will be integrated with other measures 

 “The carbon tax will not, on its own, meet B.C.’s emission-reduction targets, but it is a key element in the strategy. The carbon tax and complementary measures such as a “cap and trade” system will be integrated as these other measures are designed and implemented.”


How to implement BC Carbon Tax:

 The amount of carbon in fuel will decide what much carbon tax has to pay. This simply fact make the administration process relatively simple.

The detail process is: “Administratively, the carbon tax is applied and collected in essentially the same way that motor fuel taxes are currently applied and collected, except natural gas, which is collected at the retail level.”

Motor fuel taxes collecting process are relatively mature and easy to be implemented. In order to minimize the administration cost, BC government adopt this method.

Here is the Tax Rate for different type of fuels:

From here, we could tell that carbon tax rate start low and is gradually growing in the past 2 years. There are 23 subject are related to Carbon Tax. Not only gasoline, but also the gas, coal and tires are involved.

Now, the question is “Does carbon tax cover all the greenhouse gas emissions?”

The fact is the carbon tax applies to virtually all emissions from burning fuels, which accounts for an estimated 70 per cent of total emissions in British Columbia. 
Of the approximately 30 per cent of emissions that are not from fuels:

  • 10 per cent are from non-energy agricultural uses (e.g. emissions from enteric fermentation, manure management, and agricultural soils) and waste (landfills);
  • 10 per cent are from fugitive emissions which cannot currently be accurately measured;
  • 6 per cent are non-combustion industrial process emissions; and
  • 5 per cent are from net deforestation.

“The Province will look at options to extend the carbon tax to emissions beyond those generated by the purchase and use of fuels, and integrate the carbon tax with other climate action initiates such as cap-and-trade.”—-BC Ministry of Finance

How effectiveness of this Policy:

 From my perspective, there must be some criteria to measure the effectiveness.

l   Growing GDP:

BC Carbon tax should not be implemented with a huge cost of BC economy.  There is no doubt that BC Carbon tax will heavier the tax burden for energy intensive industry.  But an expected result of BC carbon tax is to change individuals and companies bad energy consumption behavior.  Using the power of market, the fuels energy will become more and more expensive to use.

The above table describes the main industries and employment of British Columbia in 2008. Now the next step is to check about the main industries with high GHG emission. After matching the main industries in BC and source of GHG emission, we could have a basic idea weather carbon tax will heavily influence BC economy or not.

Here is the Pie Chart:

From those two graphs, we could understand that BC tax will have limited impact on BC economy. Construction and Manufacturing account 18% of BC total GDP. However, the main carbon emission is from Transportation, Fossil Fuel Production, and residential & commercial. (56% of total emission)  Carbon tax will influence the competitiveness of BC construction and manufacturing in the short term, but considering the future better economy, carbon tax is a reasonable price pay to give up bad energy consumption habit.


Unlike the critics of carbon tax, BC economy performance is even better than average of Canada.  At least, at this point, BC Carbon was not stopping the economic growth in BC.  The critics of BC carbon tax exaggerate the cost of implementing this policy. Those GDP performance records indicate individual and companies BC are currently changing its energy consumption behaviour.

l   Greenhouse Gas Emission

The second Criteria are how much GHG emission has been reducing through put Carbon Tax.

According to the CBC report, British Columbia Province cut more GHG emission than other province in Canada.  However, the data seems fluctuated year by year. It is not an easy battle for BC to cut GHG emission.  But the target of BC is in 2020, cut 33 percent GHG emissions on 2007 Base.

The above table is from British Columbia GHG inventory report.


l   Distribution Effect

A successful policy of cutting GHG emission should provide a positive incentive to the public.  Personally, I believe BC tax credit is essential for implementing Carbon tax.  Tax reduction gives both individuals and companies a incentive to increasing energy efficiency and changing old energy consumption system.

Here is projected Carbon Tax Revenue and Tax Reduction in BC 2012/13:

From my perspective, the low-income family was not sacrificed by carbon tax.  Small-Size companies and low-income families are actually better off due to this policy.  More tax cuts are distributed on those individuals and small Business.  Those policy designs build a solid foundation that people will support for carbon tax. Recent polling for the Pembina Institute shows that public support for the carbon tax remains strong; strong for a tax, at least.

In conclusion, BC Carbon Tax is a successful policy both for environment and economy.  But I am saying this is a prefect policy.  There is still a potential problem of BC carbon tax. Only 75% percent of GHG emission were taxed, in order to secured the GHG cutting emission goal in 2020, the technology and policy must be continually updated.

Reference:

BC Ministry of Finance: http://www.gov.bc.ca/fin/

BC GHG Inventory Report

Statistic Bureau of Canada

http://guidetobceconomy.org/major_industries/goods_sector.htm

First Participation Report, Question about China Land Pollution.

From environmental economic, well-defined property right and evaluation about externality will be essential for us to protect the open access resource.   Today, I will show you the current land pollution problem in China.

As a Chinese, land is a important element in traditional culture.  Just like “Gone with the Wind” line–the land they live on is like their mother.  Unfortunately,  this kind of love is becoming more and more unfamiliar to younger generation.  In 2006, report from ministry of environment protection shows china already become one of the countries which suffer the most serious land pollution.  In the China, 150 million acres chinese farming land was polluted. Besides that, 32.5 million and 2 million acres land was polluted due to water pollution and waste dumping, respectively.  The total polluted area is 10% of all the farming land.

The land pollution issue of China not only land itself. The related problem is healthy issues  and food security.   Argument from Nandu.com emphasis about there is no laws about how to protect the land from pollution.  Making a new law like “water pollution law” etc.is the key to solve this problem.   However,  my question is ” Is this the key to solve this problem?”  

Chinese Land Pollution was caused by the combination of overwhelming urbanization or industrialization, lack of property right to the open access resource, the low opportunity cost of land pollution and the poor enforcement teams.    I understand law is important when solving the Land pollution problem. However, it is not the key. It is a prerequisite before enforce it.    The key is how to make plants, companies, institutions willing to reduce the pollution rather than dumping the waste directly to the river and land.  

  • From my perspective, it is a critical step to assign the “property right” to the farmer, so they can sue anyone including the state-enterprise for compensation.   Of course, the law have to state clearly compensation detail to prevent governmental officer find loops for their own benefit.
  •  It is important to recognize about the externalities of pollution and transfer the wealth to Chinese poor famers who adopt cleaning-pollution technology. Unlike Canadian, the subsidy for Chinese farmer have very limited impact. Traditionally, just like the “Soviet Union”, Farmers always sacrifice for modern development. This is a better method than government supervision, as individual farmer are doing their own favour by decreasing pollution in their land.
  •  Back to the root problem, incentive is very important. However, the more important one is the independent of jurisdiction.  Without it, it is very hard to enforce it.  This idea is a little idealized for current China.   The more realistic scenario is, central government pay close attention to land pollution.  Then, several cases of huge compensation to the farmers were advocate in public media.  Last, the land pollution will decreasing in a certain period of time.

To sum up, I think there are many ways to solve land pollution problem in China. Trading the emission quota is a very good option! But I am afraid it is too early to introduce this new idea to Chinese Public.  From the environmental economic,  the most important thing I remember is Market is not perfect, some of the externalities are not include in the calculation of Value.   As a Chinese, I think it is about time to rethinking about the true value of our land.


Week 8 Cool Resoure

http://www.usda.gov/wps/portal/usda/usdahome

This is one of the Best Website I found! USDA official website. I think traders should always pay a attention to the trading report and micro-environment in Food industry. Compared to many other official website of public sector. USDA provide a lot of data and information for better understanding the soybean, wheat, corn market.

Week 8 What went Right and the Road Ahead

This Week, I was confuse about the trading system.

Although I make $1737 gan on my long soybean, I can not close the contract on Friday. I think I made the right judgement about the market. Just like what I said in Week 7. I was expecting a price rebounce at this week. I get into the market on Monday and the price of soybean is continuously increasing.

There are several explanation about this:

First, in Week 7 the market have already slump to less than $1400. I do think on Monday, the price got some support and the fear of price continuously decreasing is gone.  Although in market trend for the next few months still unclear at this moment, I think most traders will hold a positive view for the next year yield due to climate in Brazil and Argentina was not significantly affect the corps.

Secondly, From a technical analysis perspective,  After a big slump, the market price will always resist for a short time.  Week 8 performance shows a price support around $1400, Part of the traders believe it is a good time to enter into the market, as they expect higher price in the near future.

Here is the Graph of Wheat.

From the above graph, I could find out that the pattern of wheat is Gone. Traders should be careful to form a new strategy about trading wheat.  I think the price of wheat will go up in the future. Due to wheat is a good substitute of soybean in livestock feeding, the demand of wheat will go up in the wheat.  Also, due to the conflict between Arabic Region and Israel, Egypt could have a higher demand of wheat in the future.

The Road Ahead:

I think this is the last week of trading game, I do like to continue the trading in the next semester. Thanks Yejeong’s patient to read my blog. I really appreciate the people who comment on my blog and share the opinions with me.  

For the next week, My strategy will be close the soybean contract and continue to go long on Wheat.  I still insist my principle—Close all trading contract at weekends.    Hope everyone have nice weekends and Good Luck for our Final Exam.


Week 7 Cool Resouce

website, Moudi Index:

http://www.indexmundi.com/commodities/?commodity=wheat

A good website which provide a lot of data. Those data are not only related the commodity market. Some of the information is very useful if you want to have a better understanding about the Food Market and Specific Country, For example: USA and Brazil.

Week 7. The Road Ahead and What went Right.

In Week 7, I choose to go 8 contracts, again.  2 short contract on soybean and 3 short on Wheat and 3 short on Corn.  Out of my expectation, the corn price was not positive coefficient with the fluctuation of soybean prices.

Here is some graphs about soybean price movements:

After crazy week 6, soybean price slump to only around $1400 per contract. I understand the price gonna head South. However, due to the trading system we can only trade from Monday to Friday.  I choose to get out of the market on Friday morning.

Unfortunately, the price start to collapse on week 6 Friday and the fear continue spread on Sunday.  The price finally arrive at around $1400 on Monday Week 7. There is no time to  hesitate at this moment.  I know traders must react to the latest news—-The USDA expectation is 4% more than the used one. Goldman Inc, also cut their hope on Corn, Soybean and wheat.

At the Week 7, I choose to go short on all three commodity we are trading at. On wednesday, I get into the market on Wednesday morning and again get out on Friday.I was lucky, this time, the market shows a downward trends. Although it is small downward trend. I still make about $3000 in Week7.

From the weekly graph, we could have a clear view about the”head and shoulders”picture.

From the technical analysis, the price should continually decrease during at the beginning of November.

The Road Ahead in Week 8:

I believe the future price of soybean will heavily depending on the biofuel program.  From a news, “US could probably become energy independent in the near future.” Also, the yield  in Latin America will heavily influence the market price.   The market price will rebound a little in the next week.  I will try to go long on soybean for the next going week.