Final Project


Our final project is aim to give a realizable estimate of the amount of land within the Central Coast district, which is reserved for agriculture.  The Agriculture Land Reserve (ALR) was established by BC provincial government in 1973. It is a policy to make more contribution to protects the agriculture land to strengthen provincial food security. However, in recent years, the ALR was threated by the increasing urbanization and lad development.  In order to analysis the efficacy of the ALR we need know how much of ALR is being used for agriculture. To do this, we used the GIS software to analyze different data to evaluate the ALR in central coast in both biogeographically and social aspect, specifically, we target on the forest cover, soil types, parks, roads, water features and so on. So as to accomplish the project, our teammates followed the proposal, we did the map through regular lab time and organized the report through google doc. Jerry is mainly responsible for the map-making, Tina and I was helped with download the data, and Ziyu is assist Jerry with map and along with record the necessary data. And finally, we finish the report together, and Tina—as the main editor, she went through each part and generalized the report.

As for my personal contribution to the group, I found this project is not only useful, but also helped me develop some GIS skills, especially how to find the data—some of the data is provide freely by the BC government. I can easily access the Terrain Resource Information Management (TRIM) data, download what Jerry need, by buffering all the lakes and rivers, Jerry conducted a map of water features in the central coast area. (MAP 3) I was also used the Digital Elevation Management data (DEM), to reclassify and determine how much of the ALR is over 30 degree, which is not suitable for agriculture land. Thanks to Jerry’s technology skill, he perfectly performs the data by using the ArcMap software.

MAP 3

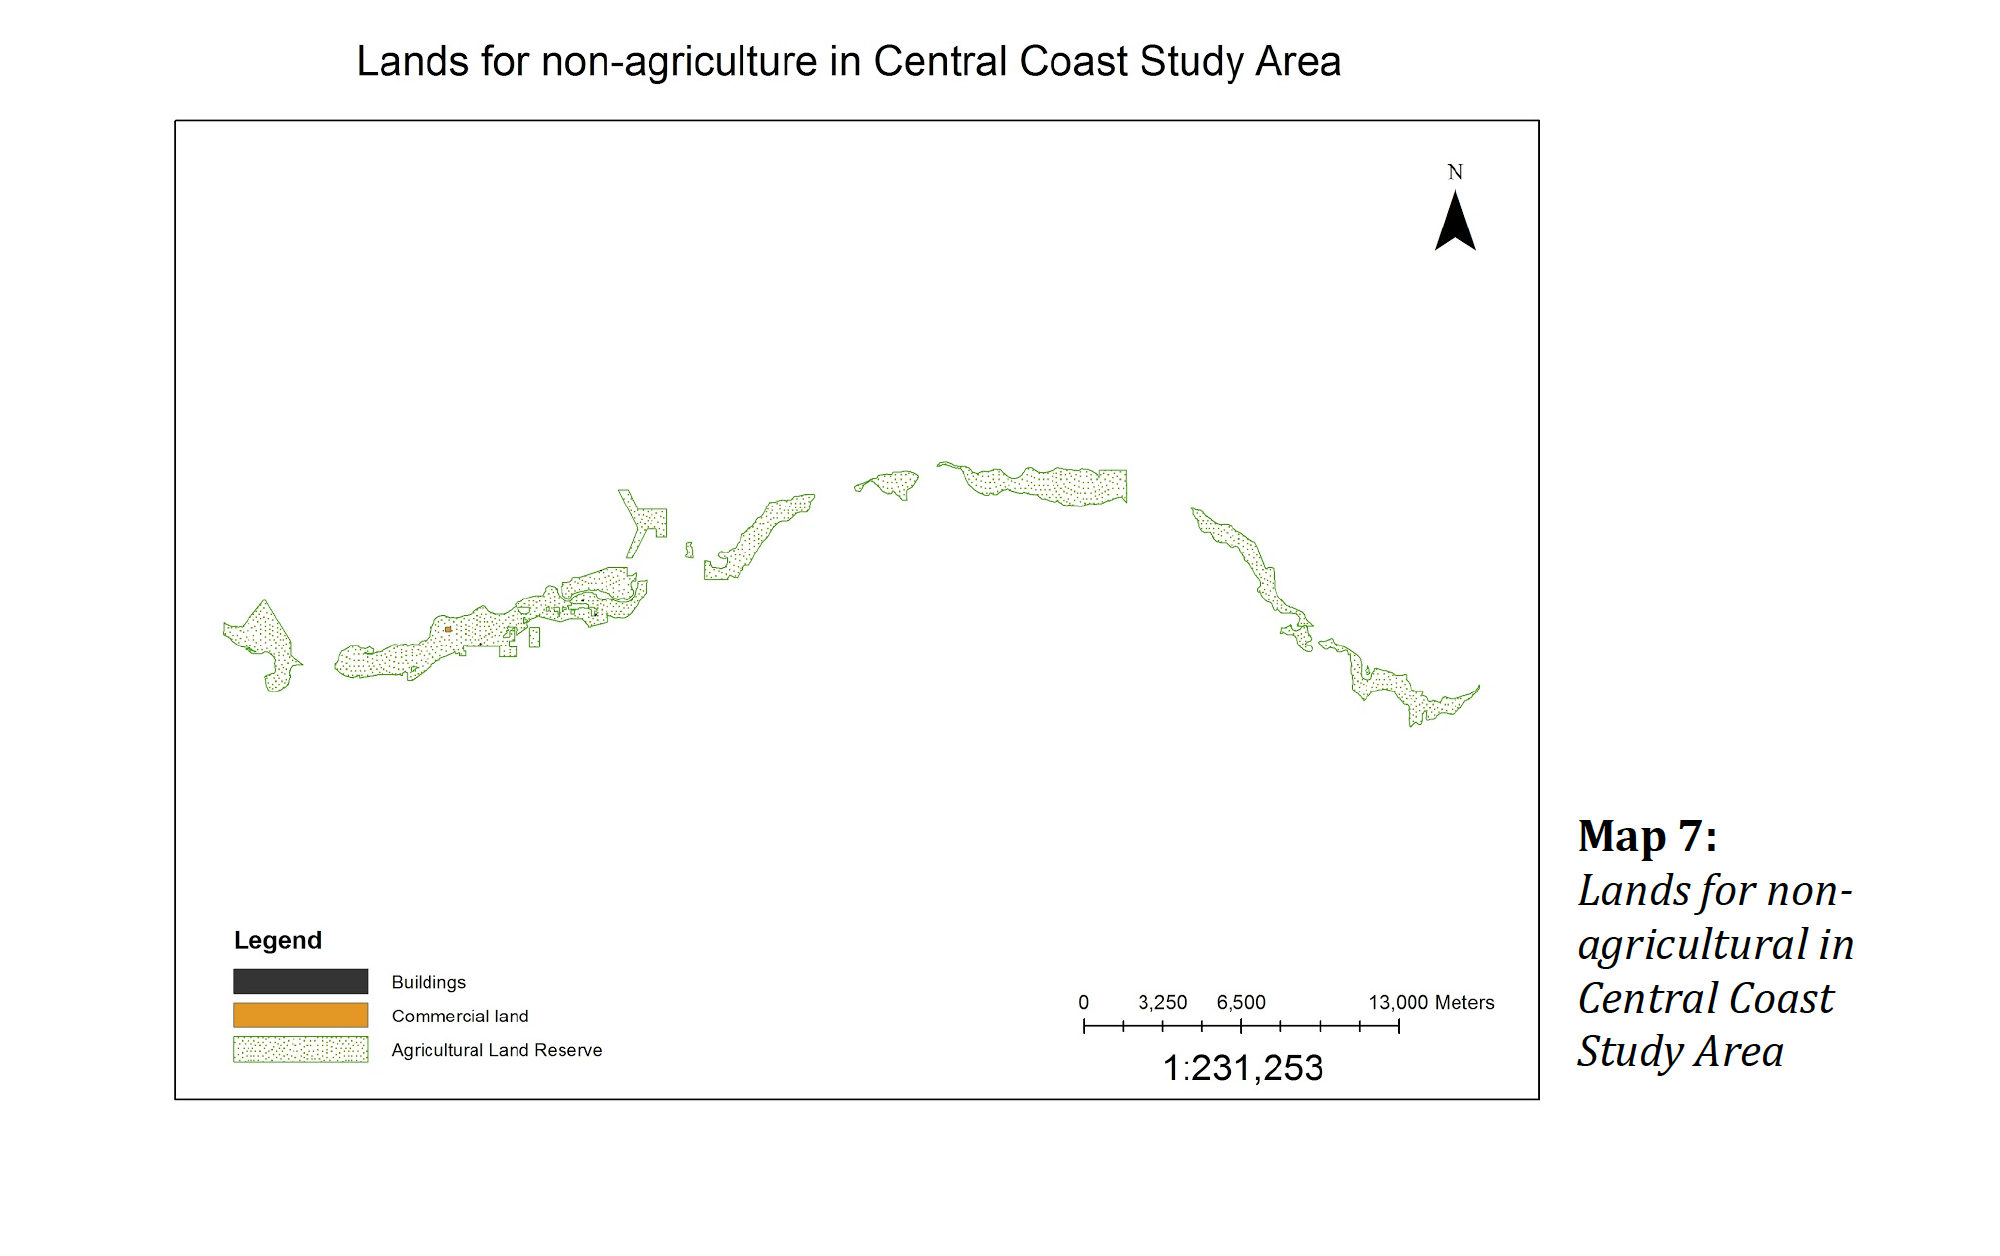
The use of land in one region should be very diverse, especially for places with urban development. In Central Coast region, we were expected to evaluate the different types of land use, however, it was very challenging to accomplish this task with detailed analysis. We searched data from DataBC, CHASS and Geofabric but the only land use types we got was building, commercial, roads and parks, (map 6 &7) which were the very basic ones. Broad research about the use of land in the following categories: factory, industry, school, hospital, community centers, recreational centers, shopping malls, clinic etc. could not be conducted due to the limited data provided. Although this region has very small population compared to other districts in British Columbia, it does mean that this region is not an important piece of land in BC. It can be developed in to a center of economic and recreational activities in the future. The government should provide data about detailed land use, so that scholars are able to study the geography of this area, and companies can get to know the region for future investment.


map6 map7


Accomplish Statement

  • Effective team-working skills by conducting a team report with specific agricultural land reserve area in Central Coast, in order to see how much of the area could still currently be used for agriculture, and the implications and reasons for our findings.

Leave a Reply

Your email address will not be published. Required fields are marked *

Accomplishment of Lab 4&5

Lab4

Manipulated visual outcomes of maps by using various breaks to show ethical implications of using different data classification methods in maps.and also gained knowledge in downloading and importing spatial and tabular data to analyze housing affordability in Vancouver and Montreal

Lab5

Found and retrieved data from reliable sources online to conduct an environmental impact analysis within a proposed ski hill area to determine the severity of impact the project would have on the area. and effectively performed data visualization: acquired, parsed, filtered, represented, and refined spatial data to assess the environmental impact of a proposed ski resort.

Leave a Reply

Your email address will not be published. Required fields are marked *

GEOB270-Lab4

Housing Affordability— Vancouver and Montreal         affordabilityVM

Click the link to access the map

This map clear shows the housing affordability in Vancouver and Montreal, by comparing the median income to housing cost and family earnings in a certain census tract.  This is a more effective way of accessing housing affordability, than just rely on housing cost, because the families who earn more highly possible live in more expensive house. According to the 11th Annual Demographia International Housing Affordability Survey, it categorized the following affordability: Severely Unaffordable 5.1 & Over, Seriously Unaffordable 4.1 to 5.0, Moderately Unaffordable 3.1 to 4.0, Affordable 3.0 & Under. The rating is aim to monitor the affordability of the two cities and to alert the government have to control the cost through the Macroeconomic regulation. It is obvious that the map indicate Montreal is much more affordable when taking median house cost and familial earning into account. After all, most census tracts in Vancouver are shown in this map as severely unaffordable.


classification method

Click the link above to see the map

This map shows the data for housing coast in Vancouver in different classification method – Equal Interval, Natural Breaks, Manual Breaks and Standard Deviation. The data shows differently with different method of classification. The equal interval classification method is by creating breaks to divided the range into equal sized classes, including the outliers and the extreme values of the dataset, which doesn’t consider the distance between the data points. The drawbacks of this method is when the outlier are too large or too small from the majority, then a majority of points that are observed within a close distance. In the map of Vancouver, we can see that the equal interval method skews the data so that it appears that the majority of the houses are affordable because there are some outliers at the very expensive end of housing costs. The standard deviation method classifies the data by the standard deviation from the mean. The disadvantage of this method are that readers will hard to understand the map, might cause confusion the the purpose of the map nor its legend. The second map is using the natural breaks, this method takes into account the distance between data points and places the breaks in relation to that distance. However, in terms of the legend, since the numbers are automatically calculated by the computer, it will not always be rounded. Finally, the manual breaks method allows the users to “customized” their own breaks. It is significant for the users to considering all of the ethical implications of the display of data, and to choose the most suitable method to classify the data.


Leave a Reply

Your email address will not be published. Required fields are marked *

GEOB270-Lab5

This memo regards the environmental assessment of the Garibaldi at Squamish project that proposes to construct a ski resort on Brohm Ridge, 15km north of Squamish on Highway99. The proposed project would include 124cski trails and 23 lifts along with housing accommodations and commercial developments. Even though the resort has the potential to bring more employment and tourism to the area, there still are some unavoidable environmental impacts and concerns to building such a large project in Brohm Ridge。

As a natural resource planer, I retained by the project proponents. First of all, I acquire some datum of this area from DataBC, including the project boundary, old growth management area, roads accessibility, fishery habitat, park boundary, ungulate winter range, contours and red listed ecosystems. Then I filtered these layers by clipping to the project boundary. By using the spatial analyst tools in ArcGIS, I also reclassify the digital elevation map to show the areas below 555m and convert this raster to a polygon. Then, I calculate the percentage of the area below 555m in total project area. It is necessary to analyze the elevation of the project area, because snow is the key component in ski resort in order to operate. However, there are 29.92% of areas below 555m within the project boundary. Similarly, I also calculate the percentage of old growth forest management in this area, the percentage of red listed ecosystem, and the percentage of the project area with Mule Deer and Mountain Goat winter habitat. Finally, by using the analysis tools command buffer in ArcGIS, I create a variable width buffer of protected area around the streams, calculated the percentage of the projected area will shown within fish bearing streams.

According to my calculated result, it shows that 29.92% of project areas are below 555m, and the percentage of total environmentally projected area is around 70%. We can see clear that almost half of the land is protected for environmental conservation and one third of land in the west is unreliable for ski, and also highly risk to destroy the environment of this area.  By no means, we cannot sacrifice the environment by no means, in order to create more jobs in Squamish, ad the global warming also increase the resort’s vulnerability to economic loss, once there is not enough snow to support ski.

In my personal opinion, the top two greatest environmental concerns to project development are: first, the detrimental impact of development on ecosystem conservation, especially the old growth forests areas and the fishery habitat. To mitigate the impact of development ecosystem would be un-development, however, we can also plan the ski resort and commercial and away, try to minimize the pollutants and keep the original ecological environment. Second, as I mentioned before, the warming climate might also contributes to the unreliable skiing, because of the low elevation areas. In order to avoid the risk of lower snow condition, we can use the “snow maker” to increase the snow base, this tools has been successfully used in many ski resort, such as Whistler, and some of ski resort in China.


Personal thought:

I don’t think this project should be allowed to proceed, because it do have the highly potential risks as I mentioned before, especially the warming climate, it is the result of anthropogenic activity, but it also highly unpredictable, particular in the aspect of precipitation. Besides, when we looking at the slop of the terrain, the slope grades doesn’t various very much. Moreover, the development of this land area will also threat the local environment, particularly, the wild species and the it will also cost damage to the forest.


lab5-270


Leave a Reply

Your email address will not be published. Required fields are marked *

GEOB270-Lab2

  • Review your answers to question 2 and 5 to answer the following: for general audience, describe how to fix misaligned and improperly referenced spatial data, including taking into consideration project properties.
  • Review your answer to question 11 and discuss the advantages to using remotely sensed Landsat data for geographic analysis.


Accomplishment Statement:

(1)The Misalignment and/or improperly referenced data are commonly occurring when analyzing the geospatial data. However, the most common projection is often best matches with specific area because of the geography of the local context. Also, during the map-making process; we have to make sure the data we are using is compatible, which refer to all the units should be the same and your coordinate and projection systems should be the same across all files as well.

 (2) Remotely sensed landsat data is widely used by geographic analysis. It contains various data layers that can be adjusted to highlight different changes in the landscape. And it’s also free for public to access it. By doing so, lots of geographers and environmentalists can enhanced their  academic research towards many disciplines related to the environment (climate change, agriculture, forestry, water, land-use and land cover change, natural disaster management, and wildfires) which would have improved government policies and decision-making (USGS, 2012).

Leave a Reply

Your email address will not be published. Required fields are marked *

GEOB270-Lab3

mylab3map


QUESTION 5 (1)What percentage of the City of Vancouver’s total area is in danger? Explain what method you used.

The total area in danger: 1587.653272 Ha

The total area of Vancouver: 13102.060002 Ha

1587.653272/13102.060002=12.1%


QUESTION 6(2)By using the appropriate selection method, create a layer containing the health care and educational facilities within the City of Vancouver danger zone. List the resulting facilities, if any. Check your results visibly. Explain how you came up with your answer

Health care facilities in danger:  FALSE CREEK RESIDENCE,VILLA CATHAY CARE HOME,YALETOWN HOUSE SOCIETY,BOARDWAY PENTECOSTALLODGE

Educational facilities in danger:  HENRY HUDSON ELEMENTARY, ST ANTHONY OF PADUA, ECOLE ROSE DES VENTS,EMILY CARR INSTITUTE OF ARE & DESIGN,

First, using select by location, we’ll select form “Vancouver_education” and “Vancouver_health”,  overlying with  “Vancouver_danger” in the source layer. Then,  “danger_health” and “danger_education” will be exported  as the selected data. Finally, double check the attribute table of the exported layers.


Accomplishment Statement

By using the tabular Vancouver City data, and analyzing by  ArcGIS software, I am demonstrate a map indicate the risk of tsunami in City of Vancouver. We can see from this map  the high-risk areas if a tsunami impacts Vancouver.


Leave a Reply

Your email address will not be published. Required fields are marked *

Hello world!

Welcome to UBC Blogs. This is your first post. Edit or delete it, then start blogging!

One thought on “Hello world!”

Leave a Reply

Your email address will not be published. Required fields are marked *

Spam prevention powered by Akismet