After learning more about NSEMO and the project, we sat down as a group to discuss our next steps. Since our main task for the project is to create 30 injects that will display different scenarios after an earthquake, we brainstormed critical sites where these scenarios can take place. We classified sites as critical if they are crucial to the city’s day-to-day operation such as hospitals, schools, roads, etc.
We also brainstormed on the kind of damages these sites will experience. Our initial ideas for damages included:
- Cracked walls, broken windows
- Blocked roadways
- Indoor pipes bursting
- Spills and leaks
- Power outage
- Small fire
Once we had gathered our thoughts, we met with the other team working with NSEMO to share ideas and divide work. We first combined our initial critical sites and damages list with that brainstormed by the other team, and then we sent our preliminary list to NSEMO for feedback and approval. We discussed dividing the sites between our two teams by geographic location.
Once we received the go-ahead from NSEMO for the sites we selected, we met again with the other team to finalize the list of sites and the simulated damage for each site. In the end, we achieved our goal in creating a list that contained 50 sites with different damages.
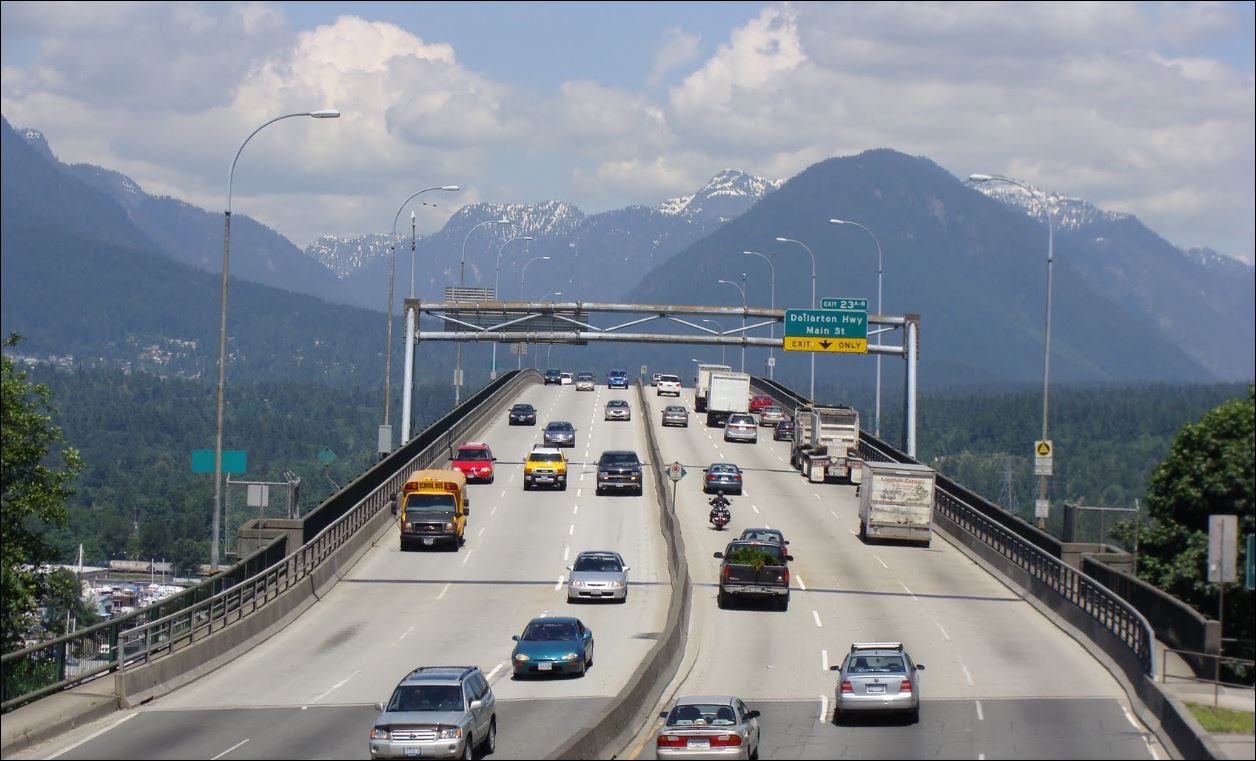
The inject will show a critical site, like this bridge, with a manipulated earthquake damage (Photo: Google Street View)
We narrowed down our list of sites and damage based on possibility of the envisioned damage occurring, site significance to the city, and the urgency of response the site should receive. For example, we chose a hospital that will experience power outage over a restaurant that will have cracks on its walls.
Another crucial decision was how to obtain the photos needed to create the injects. When compiling our list of sites, we had used Google Street View to virtually visit potential sites and check their viability for simulated damage. We were very impressed with the images in Google Street View and decided that we would use screen captures from it as much as possible. Any photos that we cannot obtain from Street View will require an in-person site visit to take the photo.
Timeline and Milestones
We assessed our client’s deadlines, due dates for the CIVL 202 course and our overall workload to compile a plan of action for completing the project. The plan is reflected in the Gantt Chart below. Completed milestones are indicated in gray and upcoming in blue.
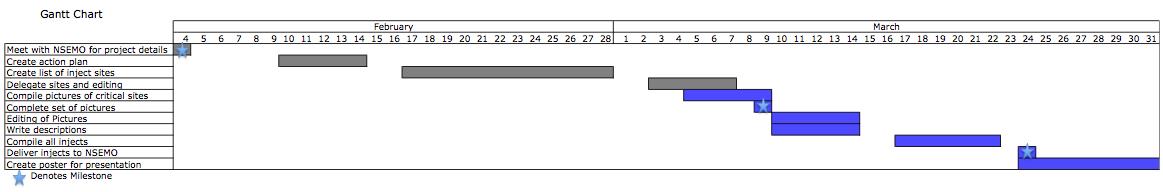
Our Gantt Chart, showing timelines for project phases (please click to enlarge)
Timeline Overview:
- Meet with NSEMO for project details* – February 4
- Create action plan – February 10-14
- Create list of inject sites – February 17-28
- Delegate sites and editing -March 3- 7
- Compile pictures of critical sites – March4-9
- Complete set of pictures* – March 9
- Editing of Pictures – March 10-14
- Write Descriptions – March 10-14
- Compile all injects – March 17-22
- Deliver injects to NSEMO* – March 24
- Create poster for presentation – March 24-31
*Key milestones
Hi Team,
Very nice! Have you been able to accomplish the milestones you set for yesterday?
More generally, what are you learning about the context of earthquake engineering? Do you understand how earthquake engineers work with the NSEMO and other community organizations?
Regards,
SN