
“For this task, you will view the visualizations (3) posted in CLAS and reflect on the implications and outcomes of their generation. The visualizations show not only connections between the participants’ music choices, but also groups participants based on the strength of these choices, creating communities of “like-minded” individuals. But exactly how like-minded are you?”
In purpose to reduce the bias, I chose blue nodes as a like-minded community instead of analyzing my group results, then observed: 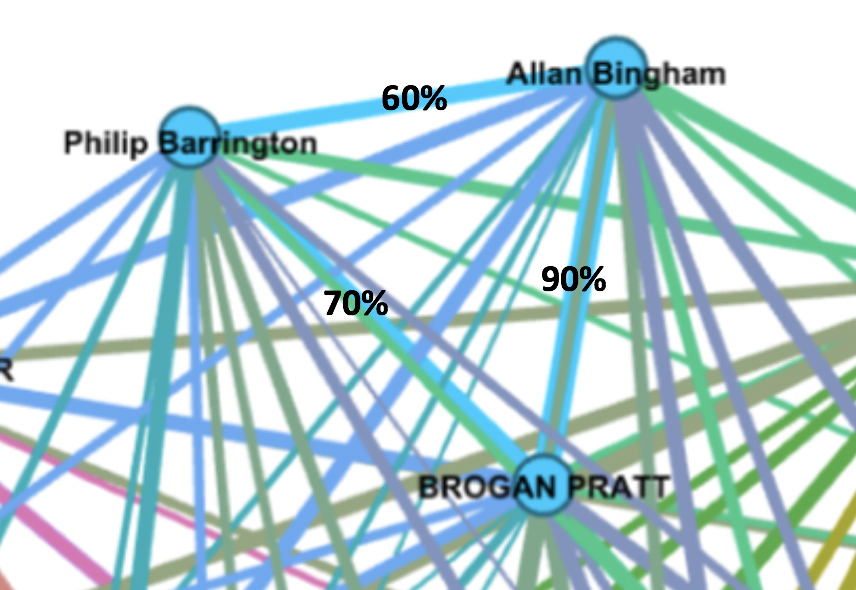
- the similarity between 2 curated lists could be low as 60%, and high as 90%;
- every “community” member selected the same 6 pieces out of 27;
- 2 people that shared 90% of lists (Allan and Brogan) didn’t choose base on the same criteria as they stated in assignment 8s. Allen involved personal preference, while Brogan tried to be strictly objective.
My observations of this small community keep me wondering that even for a specific task with a clear purpose, there is a significant variance in results. Some people would share more in common than others. I assume that if the sample size increases to a relatively large number, the variation can be further reduced under a reasonable range that every community member is genuinely like-minded.
“Using these visualizations as prompts, reflect on the political implications of such groupings considering what data is missing, assumed, or misinterpreted. For example, while you may be able to justify your musical choices in the Quiz, there also may exist reasons why you did not choose other pieces. Can the reasons for these “null” choices ever be reflected/interpreted in the data?”
I was curious why Allan and Brogan’s choices are 90% similar when their criteria are not entirely the same. Then, a review of my own list hinted me the reason. As I picked 10 pieces 1 week ago, I expressed I would like to have my curation be inclusive of cultures and times. However, as I am looking at my list at this moment, I have noticed I have 3 pieces from Bach and Beethoven, which made my list was not as inclusive as I wanted. I have played the piano since I was 4, so I am heavily influenced by classical European music. Although I set my criteria, I could not ignore the importance of the roles Bach and Beethoven played. Subconsciously, I could not eliminate most of their creations from my list to follow my criteria. I guess this is also the reason why the most picks of the class is Beethoven’s Fifth Symphony. Due to its worldwide influence, at least 13 out of 18 students (I can’t see clearly from the graph) selected this piece even we all have distinctive sets of criteria and backgrounds.
On the other hand, assuming our group develops a search engine on a music website, can we weight these 27 pieces based on our pick results? For example, Beethoven’s Fifth Symphony will be the first entry to jump out if users are looking for “the most influential tunes”, and the men’s house song from New Guinea will be the 27th entry. However, this will not be a desirable result for users. The first half will be acceptable, but the second half? Although these 27 pieces are from the most meaningful alum in music history, the least we pick will not be the 27th meaningful song in human history. In my opinion, the weighting algorithm in google (introduced in the 3rd video in section 9.1) is similar to my assumption above: which has been most mentioned will be weighed as the highest.