
“Consider the cognitive affordances of the software examined.
Speculate on how information visualization software (name the software) could be embedded in the design of authentic learning experiences and
Suggest active roles for the teacher and the students, as well as a suitable topic. Endeavour to make connections with your future personal practice in this entry.”
I have selected the Geometer’s Sketchpad from A McGraw-Hill Education Company to explore and play and here are some of my key findings:
- The Geometer’s Sketchpad is designed more intuitively, so the user interface is easy to use for both teachers and students.
- The Geometer’s Sketchpad is not a web-based program, requiring some preparations such as the installation and setup.
- Due to the software is application-based, the work and artifact created by students are not easily shared with each other. On the other hand, the formats required are user-friendly.
- The free activities provided for grade 3 to 11 could be handy resources for teachers to introduce abstract mathematical theories and offer students a fun lab time to play with the concrete visualizations(Jones & Mooney, 2003).
- From Sinclair and Jackiw’s (2010) article, Modeling Practices with The Geometer’s Sketchpad, I realized the cognitive affordances of the Geometer’s Sketchpad for mathematical modelling. The authors explain the mathematical modelling as below:
“A story context establishes some “real-world” referent; the student’s job is to identify an appropriate formalism, exercise some mathematical apparatus, and translate the result back into the terms of the story.”
Based on this explanation, the authors also offer two examples of how students employ the Geometer’s Sketchpad to address questions that arise here and there authentically. These examples, again, help me understand the importance of authenticity in learning experiences.
My selective readings for this task:
Sinclair, N., & Jackiw, N. (2010). Modeling Practices with The Geometer’s Sketchpad. In Modeling Students’ Mathematical Modeling Competencies (pp. 541-554). Springer US. http://ezproxy.library.ubc.ca/login?url=http://dx.doi.org/10.1007/978-1-4419-0561-1_47Links to an external site.
Jones, K. and Mooney, C. (2003). Making Space for Geometry in Primary Mathematics. In: I. Thompson (Ed), Enhancing Primary Mathematics Teaching. London: Open University Press. pp 3-15. Available at [http://www.soton.ac.uk/~dkj/ (Links to an external site.)]
Week 13 discussion:
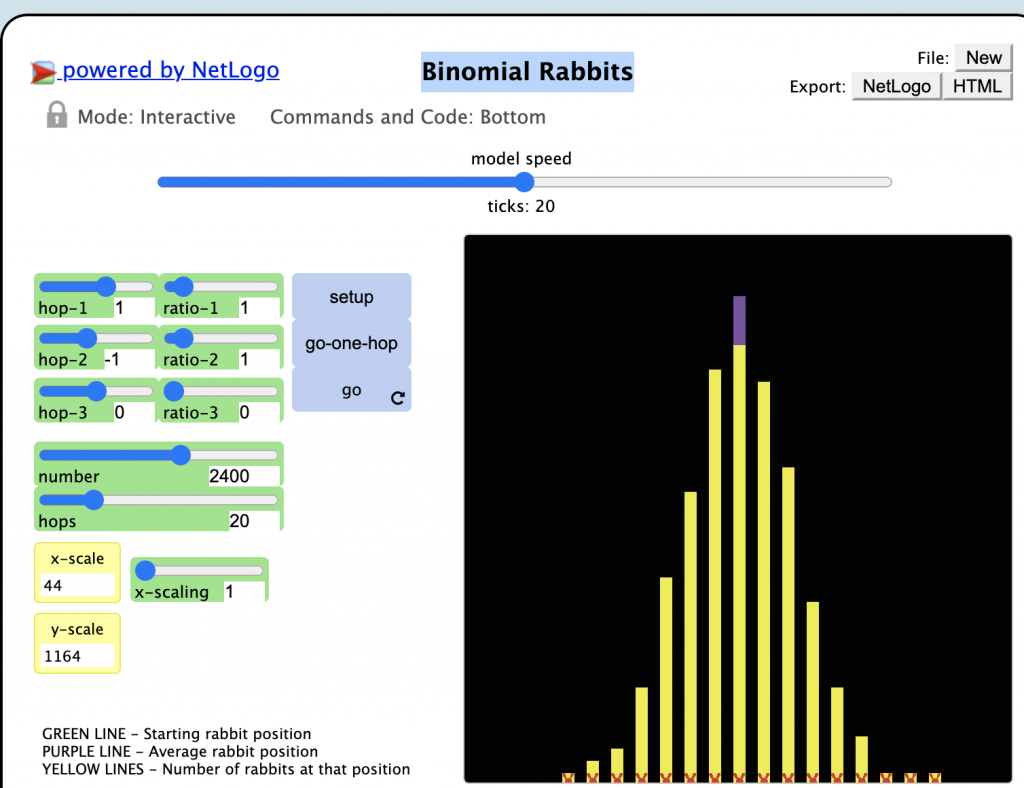
I would deploy the TGEM framework and Netlogo simulation of Binomial Rabbits to start the first Probabilities lesson in senior high school and introduce the normal distribution. The TGEM framework will motive students to learn detailed and complicated characteristics of the normal distribution by contextualizing the problem. Since the normal distribution is usually achieved through a vast sample pool, the Netlogo simulation enables students to visualize the issue under an infinite large situation.
Generate
Step 1:
The teacher clarifies the definitions of mean, median and mode.
Step 2:
The teacher asks students to speak out the names of their favorite bands and singers one by one. Simultaneously, the teacher counts the total number of individual answers of their favorites, then records.
Step 3:
The teacher asks students to calculate the frequency of each number based on the class record then answers the mean, median and mode of this set of data.
Step 4:
The teacher asks students to calculate the frequency of each number based on the class record then answers the mean, median and mode of this set of data.
Step 5:
The teacher suggests students working in pairs or small groups graph the bar distribution, discuss what they find about these mean, median, and mode, then discuss how this set of data is distributed on the bar graph in general.
Step 6:
The teacher asks students to guess what could happen to the bar distribution when data is generated from the entire school, country, and whole world. Will be a difference in the interrelationship of mean, median, and mode? Will be a difference in the general distribution of the bar graph. Students will work in pairs or small groups to write down their guesses.
Evaluate
Step 7:
The teacher asks students to open the Netlogo simulation of Binomial Rabbits and gives the background information of this model:
http://www.etlogoweb.org/launch#http://ccl.northwestern.edu/netlogo/models/models/Sample%20Models/Mathematics/Probability/Binomial%20Rabbits.nlogo
Step 8:
The teacher suggests students working in pairs or small groups play the simulations with different variables to expand the sample size.
Modify
Step 9:
The teacher asks students to modify their initial guesses of data from Step 6 based on the simulation results of Netlogo simulation.
Step 10:
The teacher introduces the normal distribution and its corresponding characteristics with real-world examples such as average human height and the distribution of class scores.
References:
Wilensky, U. (1997). NetLogo Binomial Rabbits model. http://ccl.northwestern.edu/netlogo/models/BinomialRabbits. Center for Connected Learning and Computer-Based Modeling, Northwestern University, Evanston, IL.
Wilensky, U. (1999). NetLogo. http://ccl.northwestern.edu/netlogo/. Center for Connected Learning and Computer-Based Modeling, Northwestern University, Evanston, IL.