Geob 372- Introduction to Cartography
Lab 7: Proportional Symbol Maps
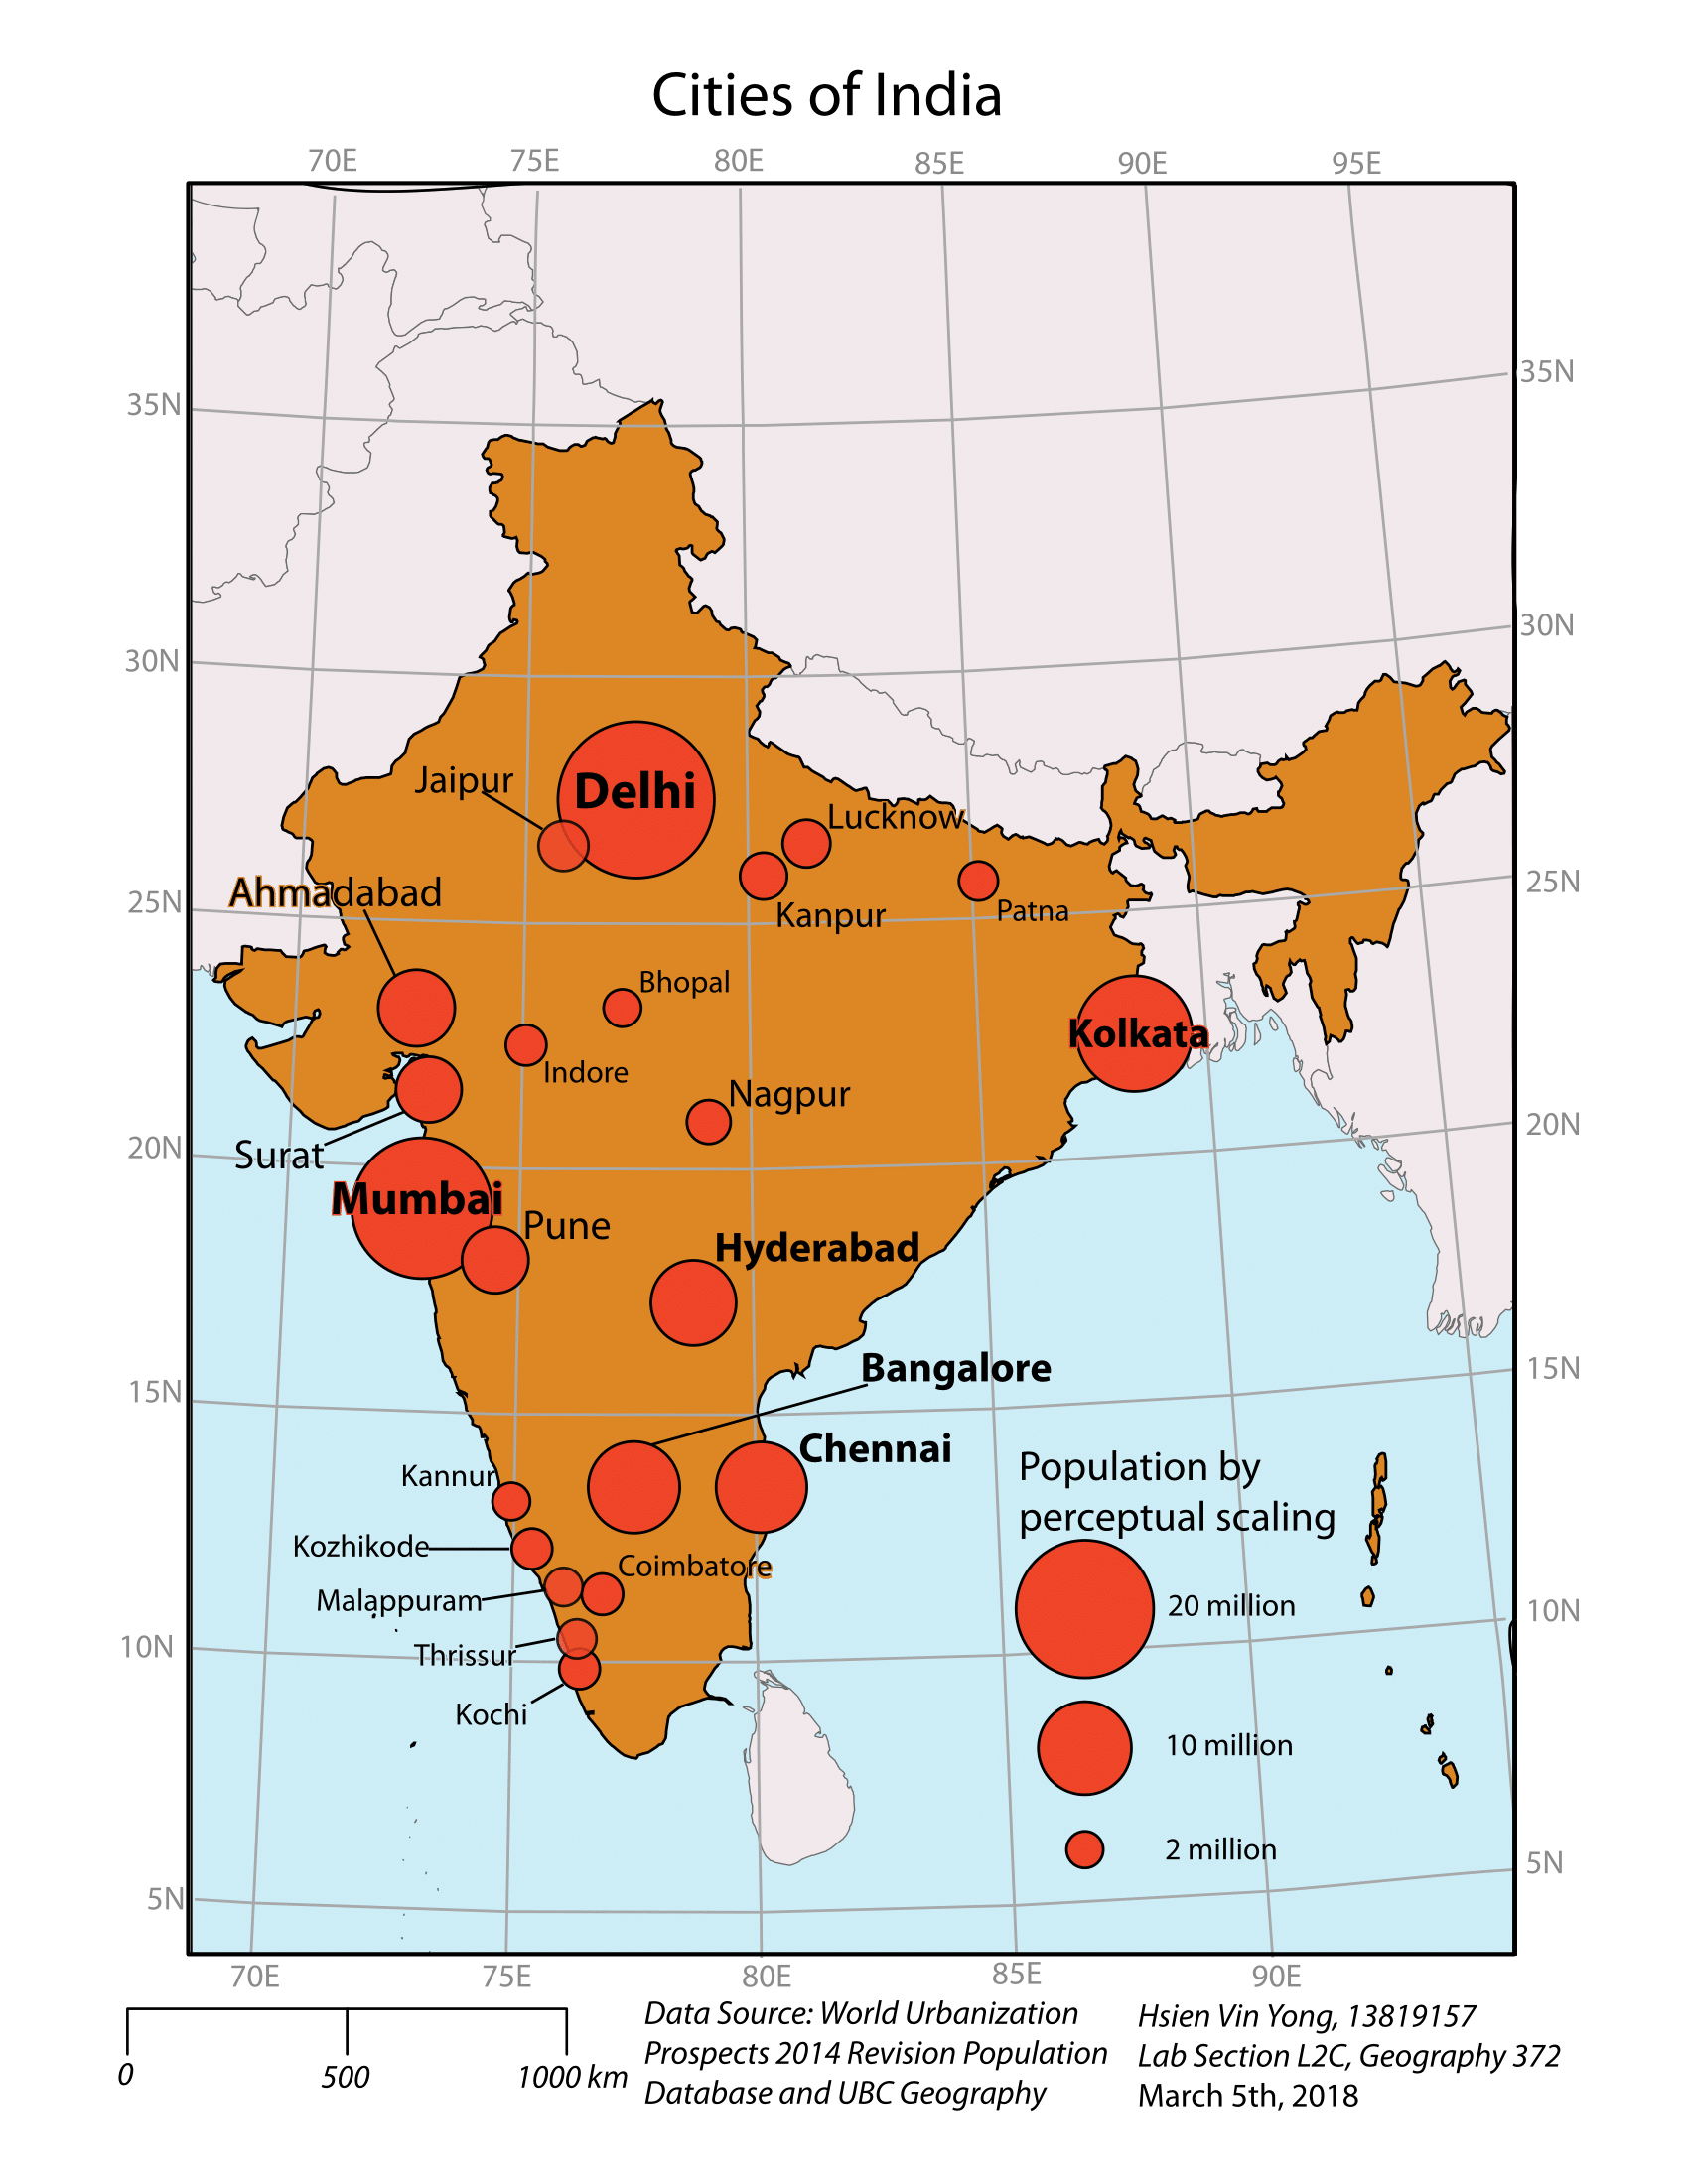
Cities of India: Perceptual Scaling
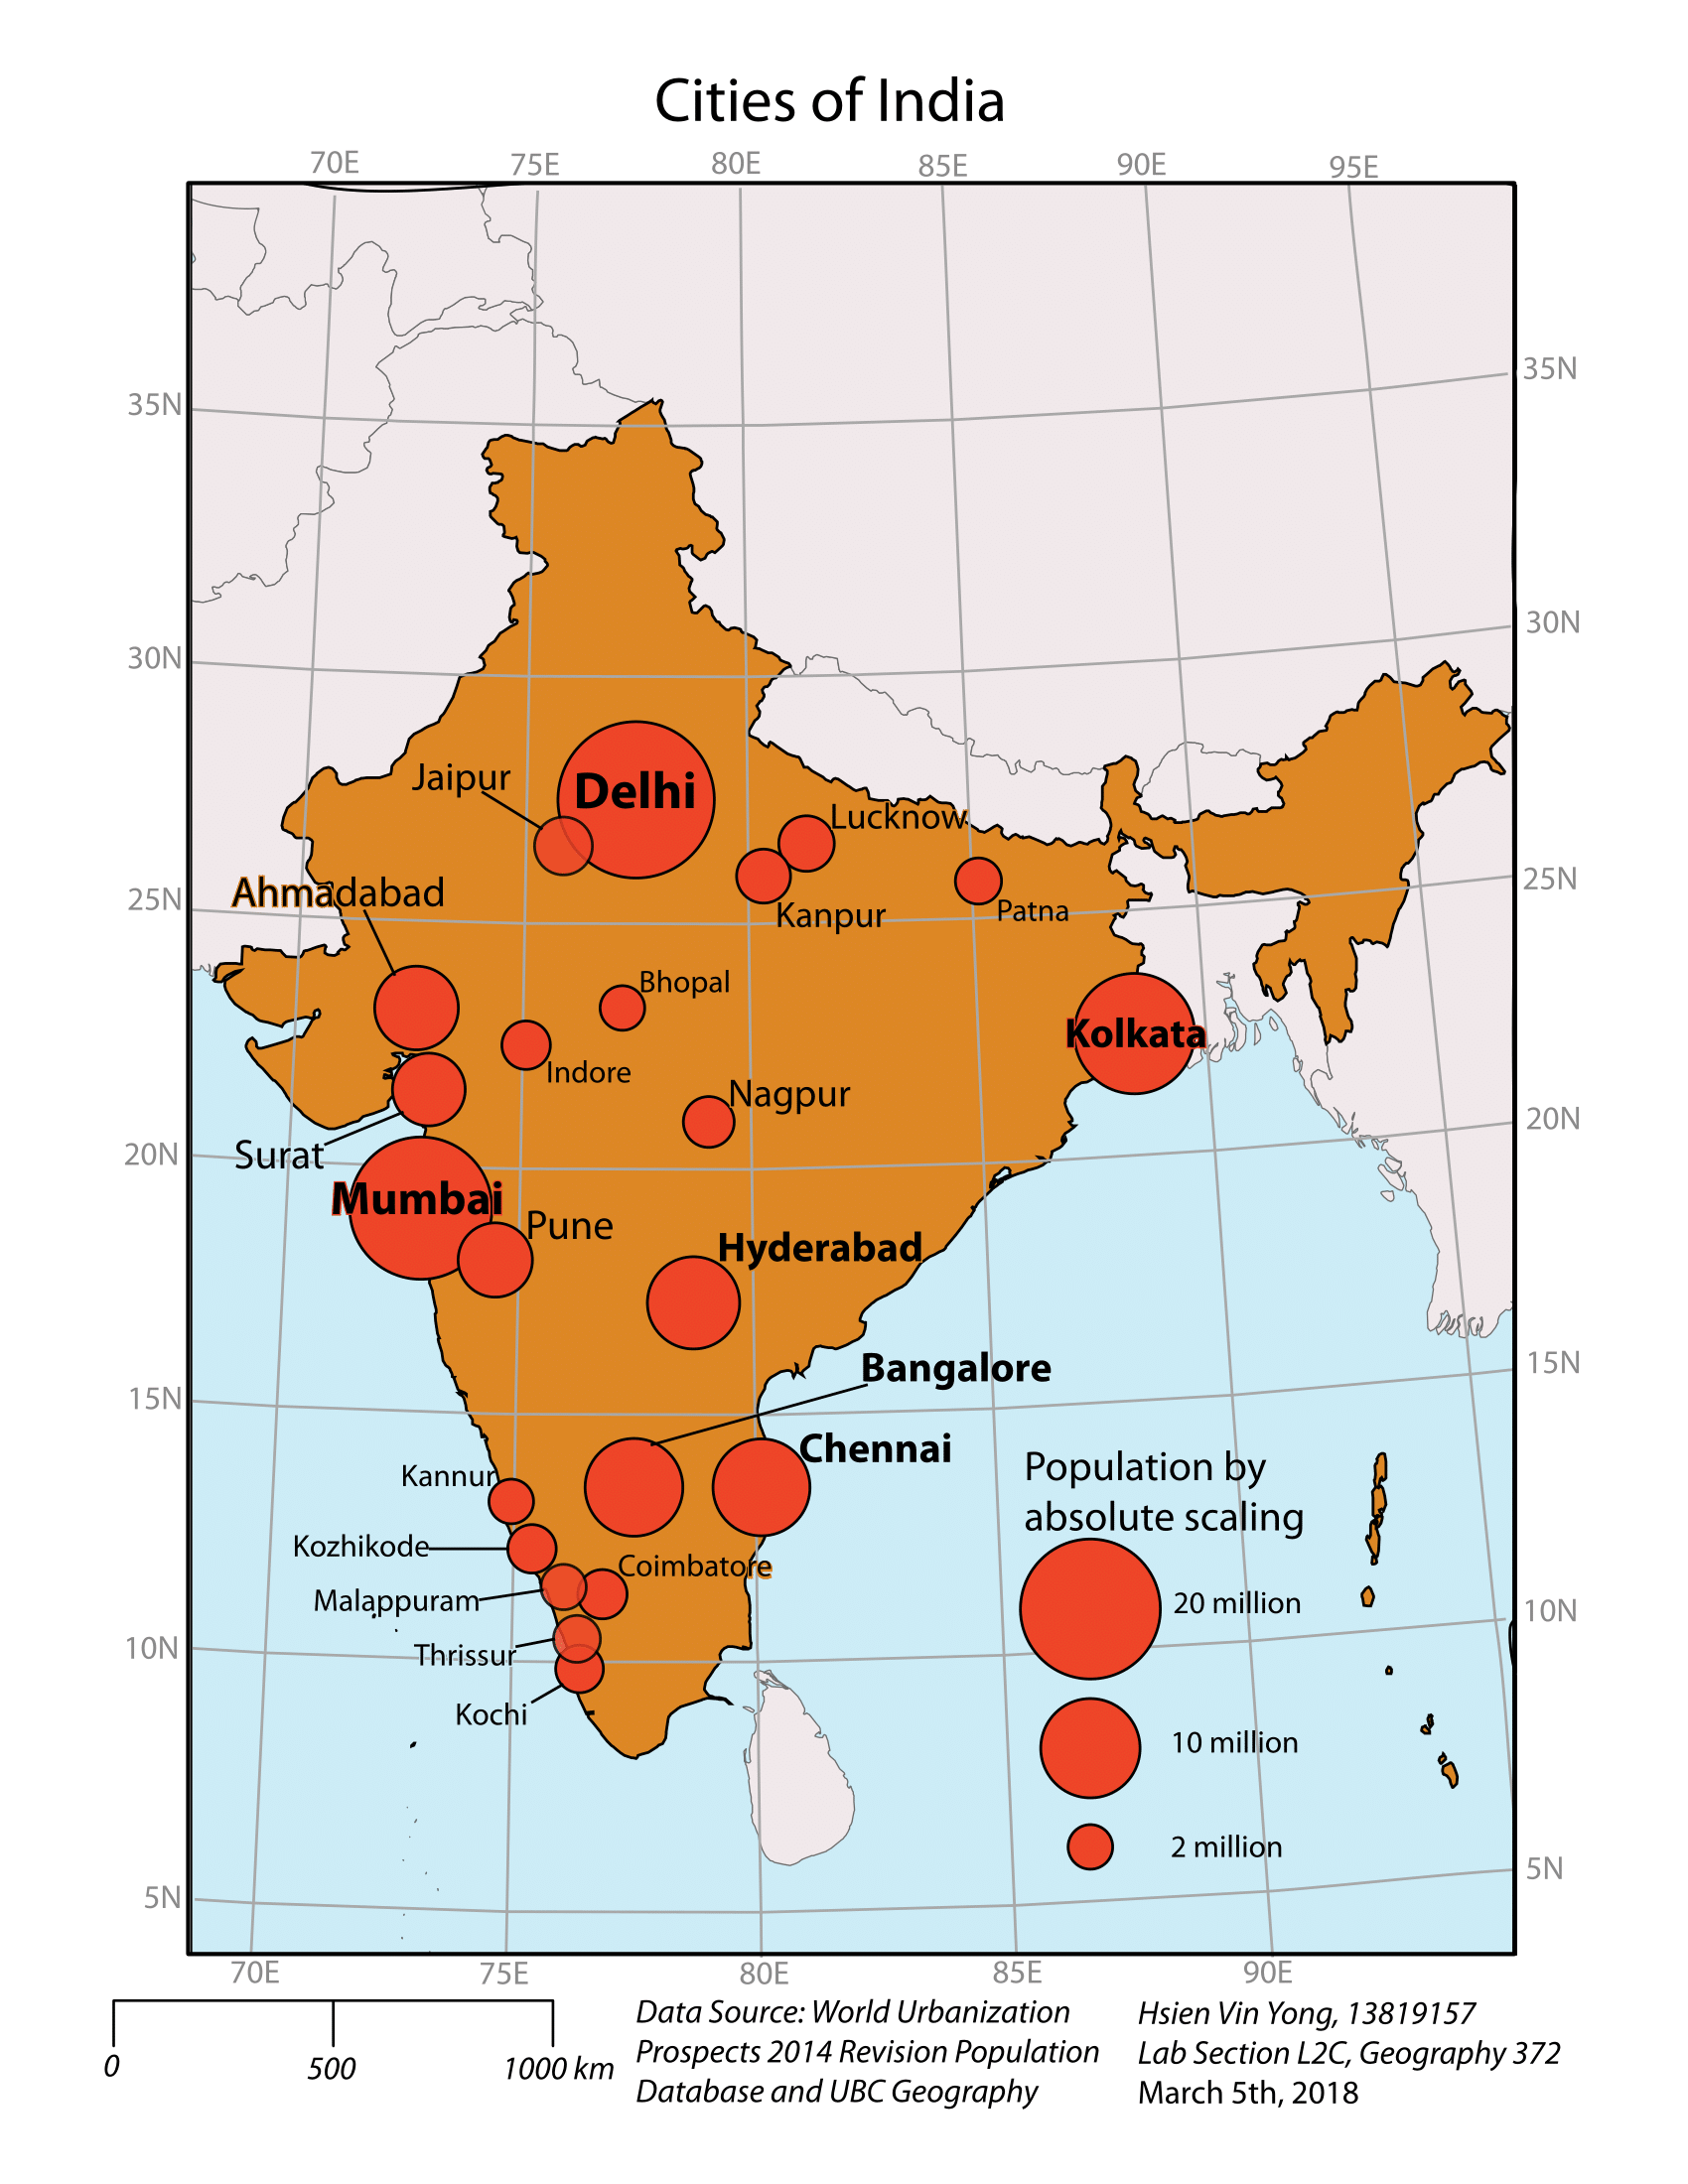
Cities of India: Absolute Scaling
Lab 6: Choropleth Maps
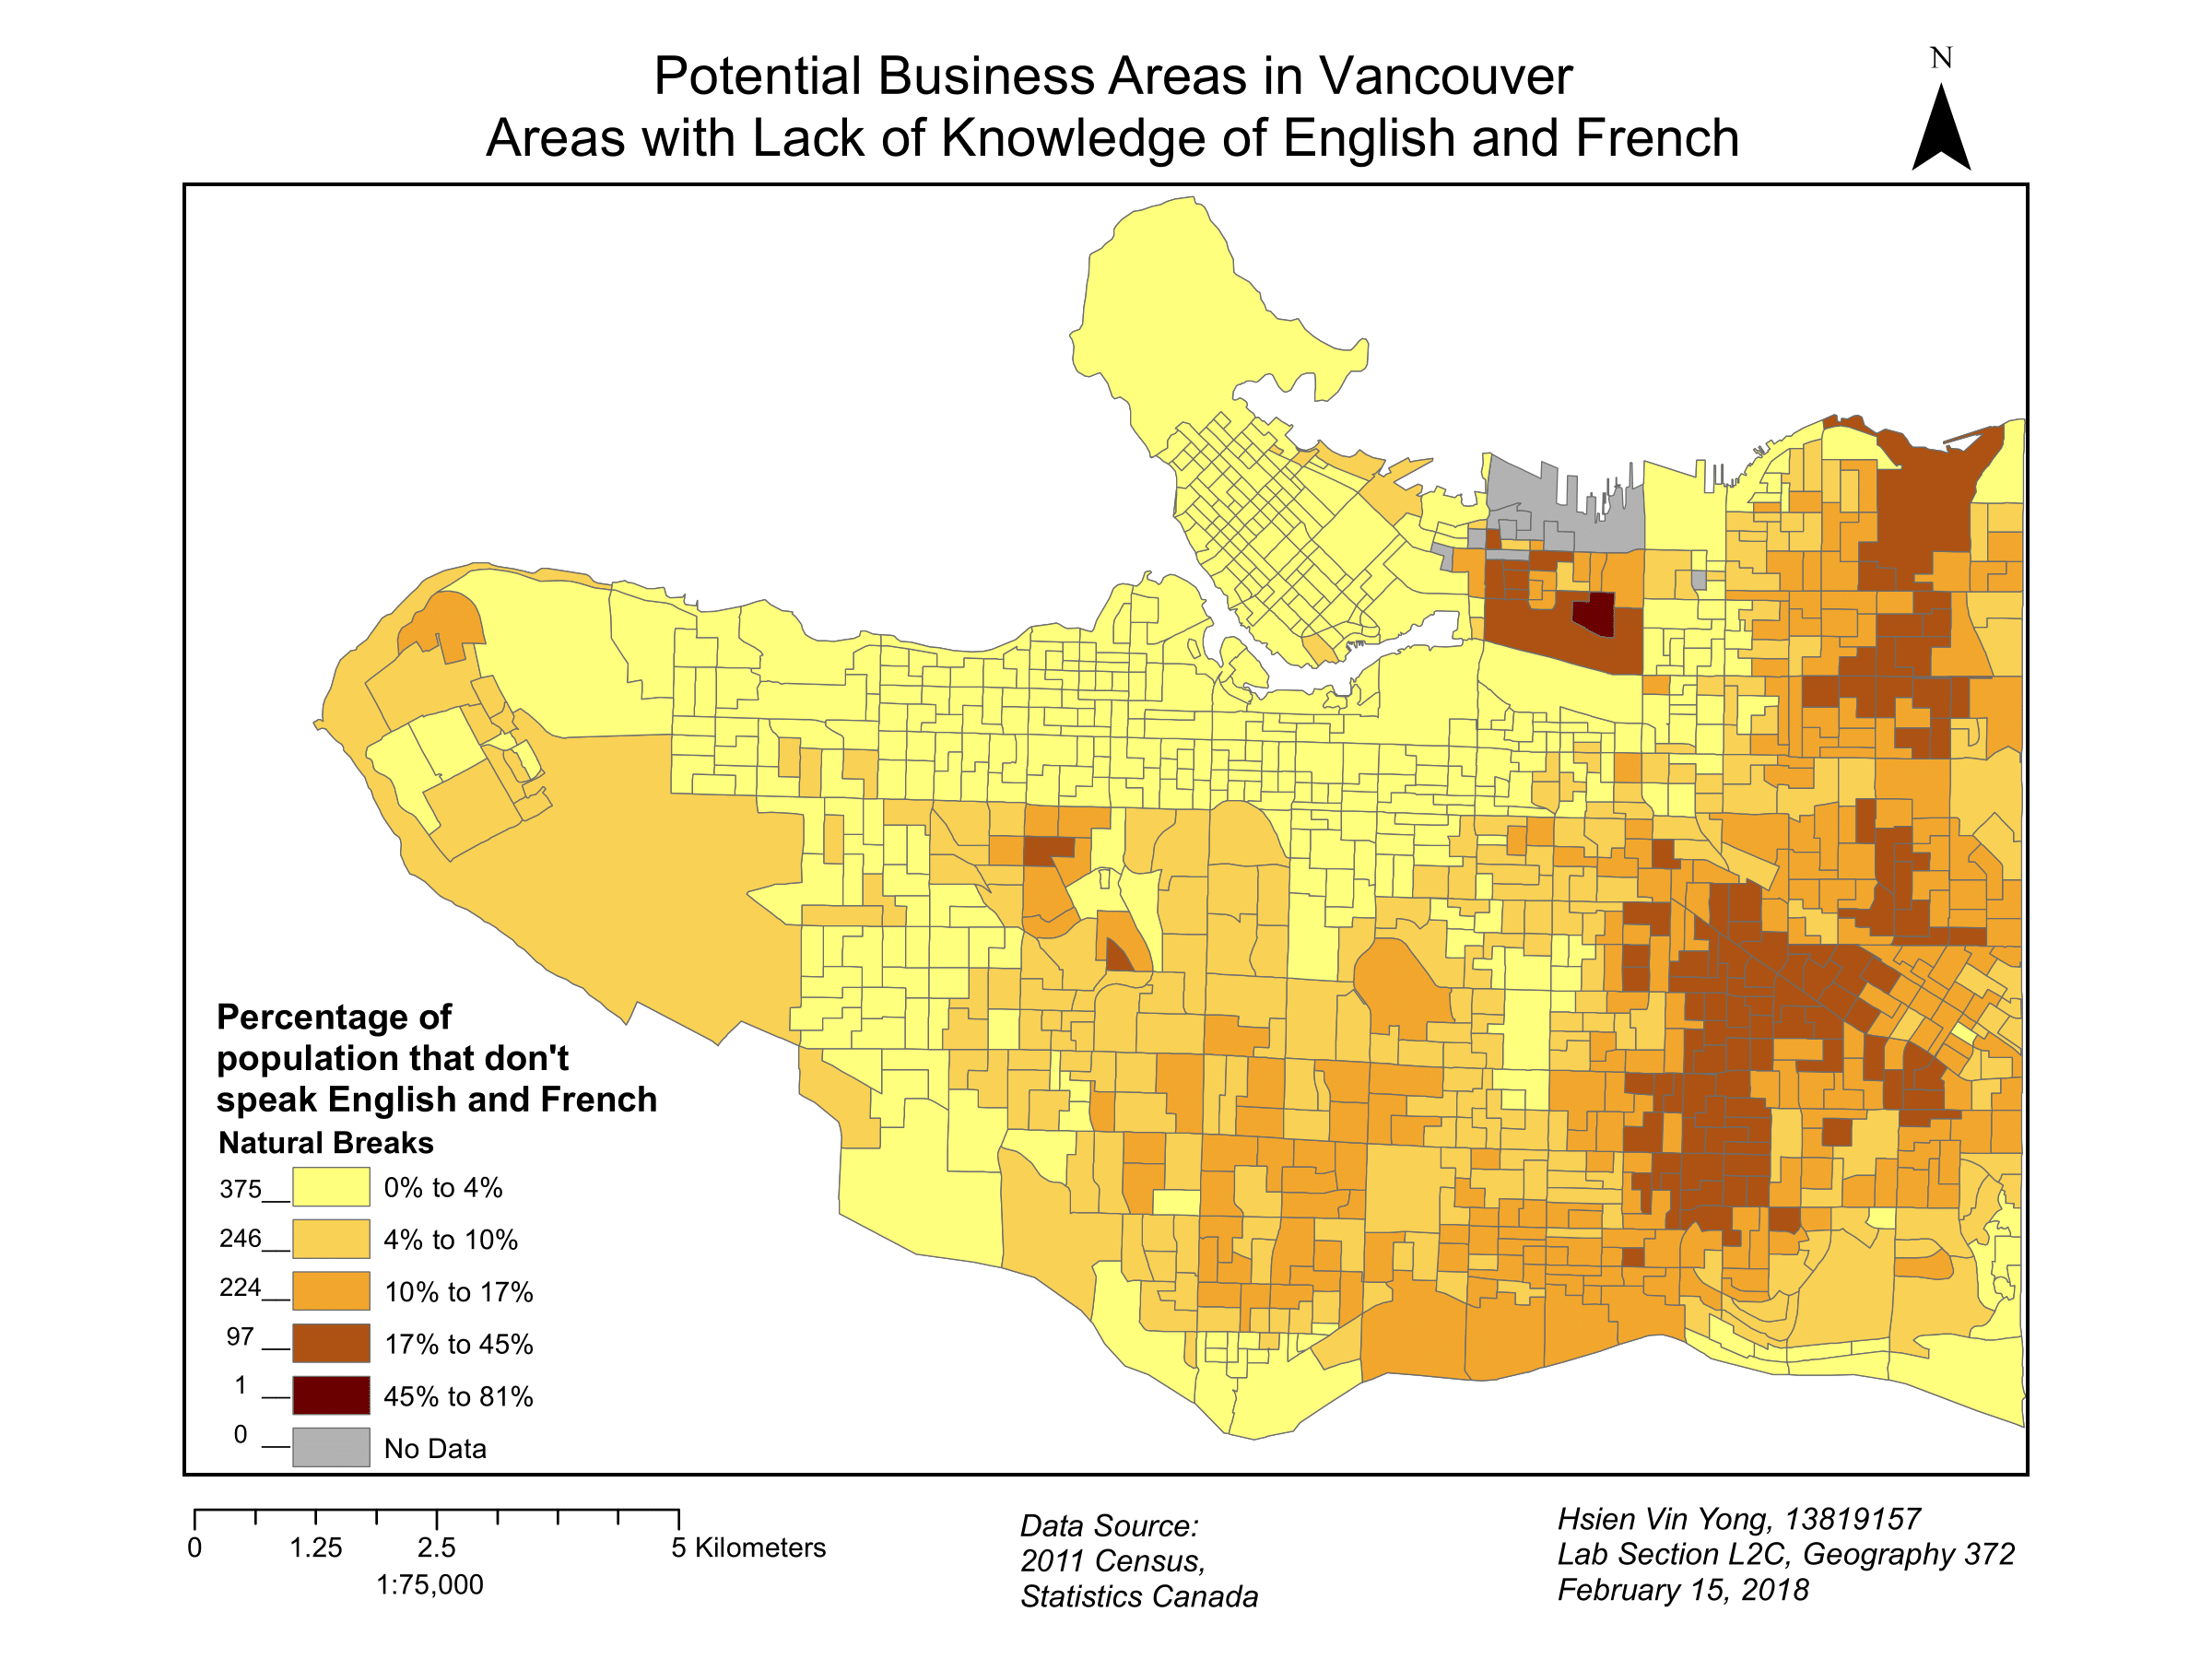
Potential Business Areas in Vancouver
Lab 5: Map Projections
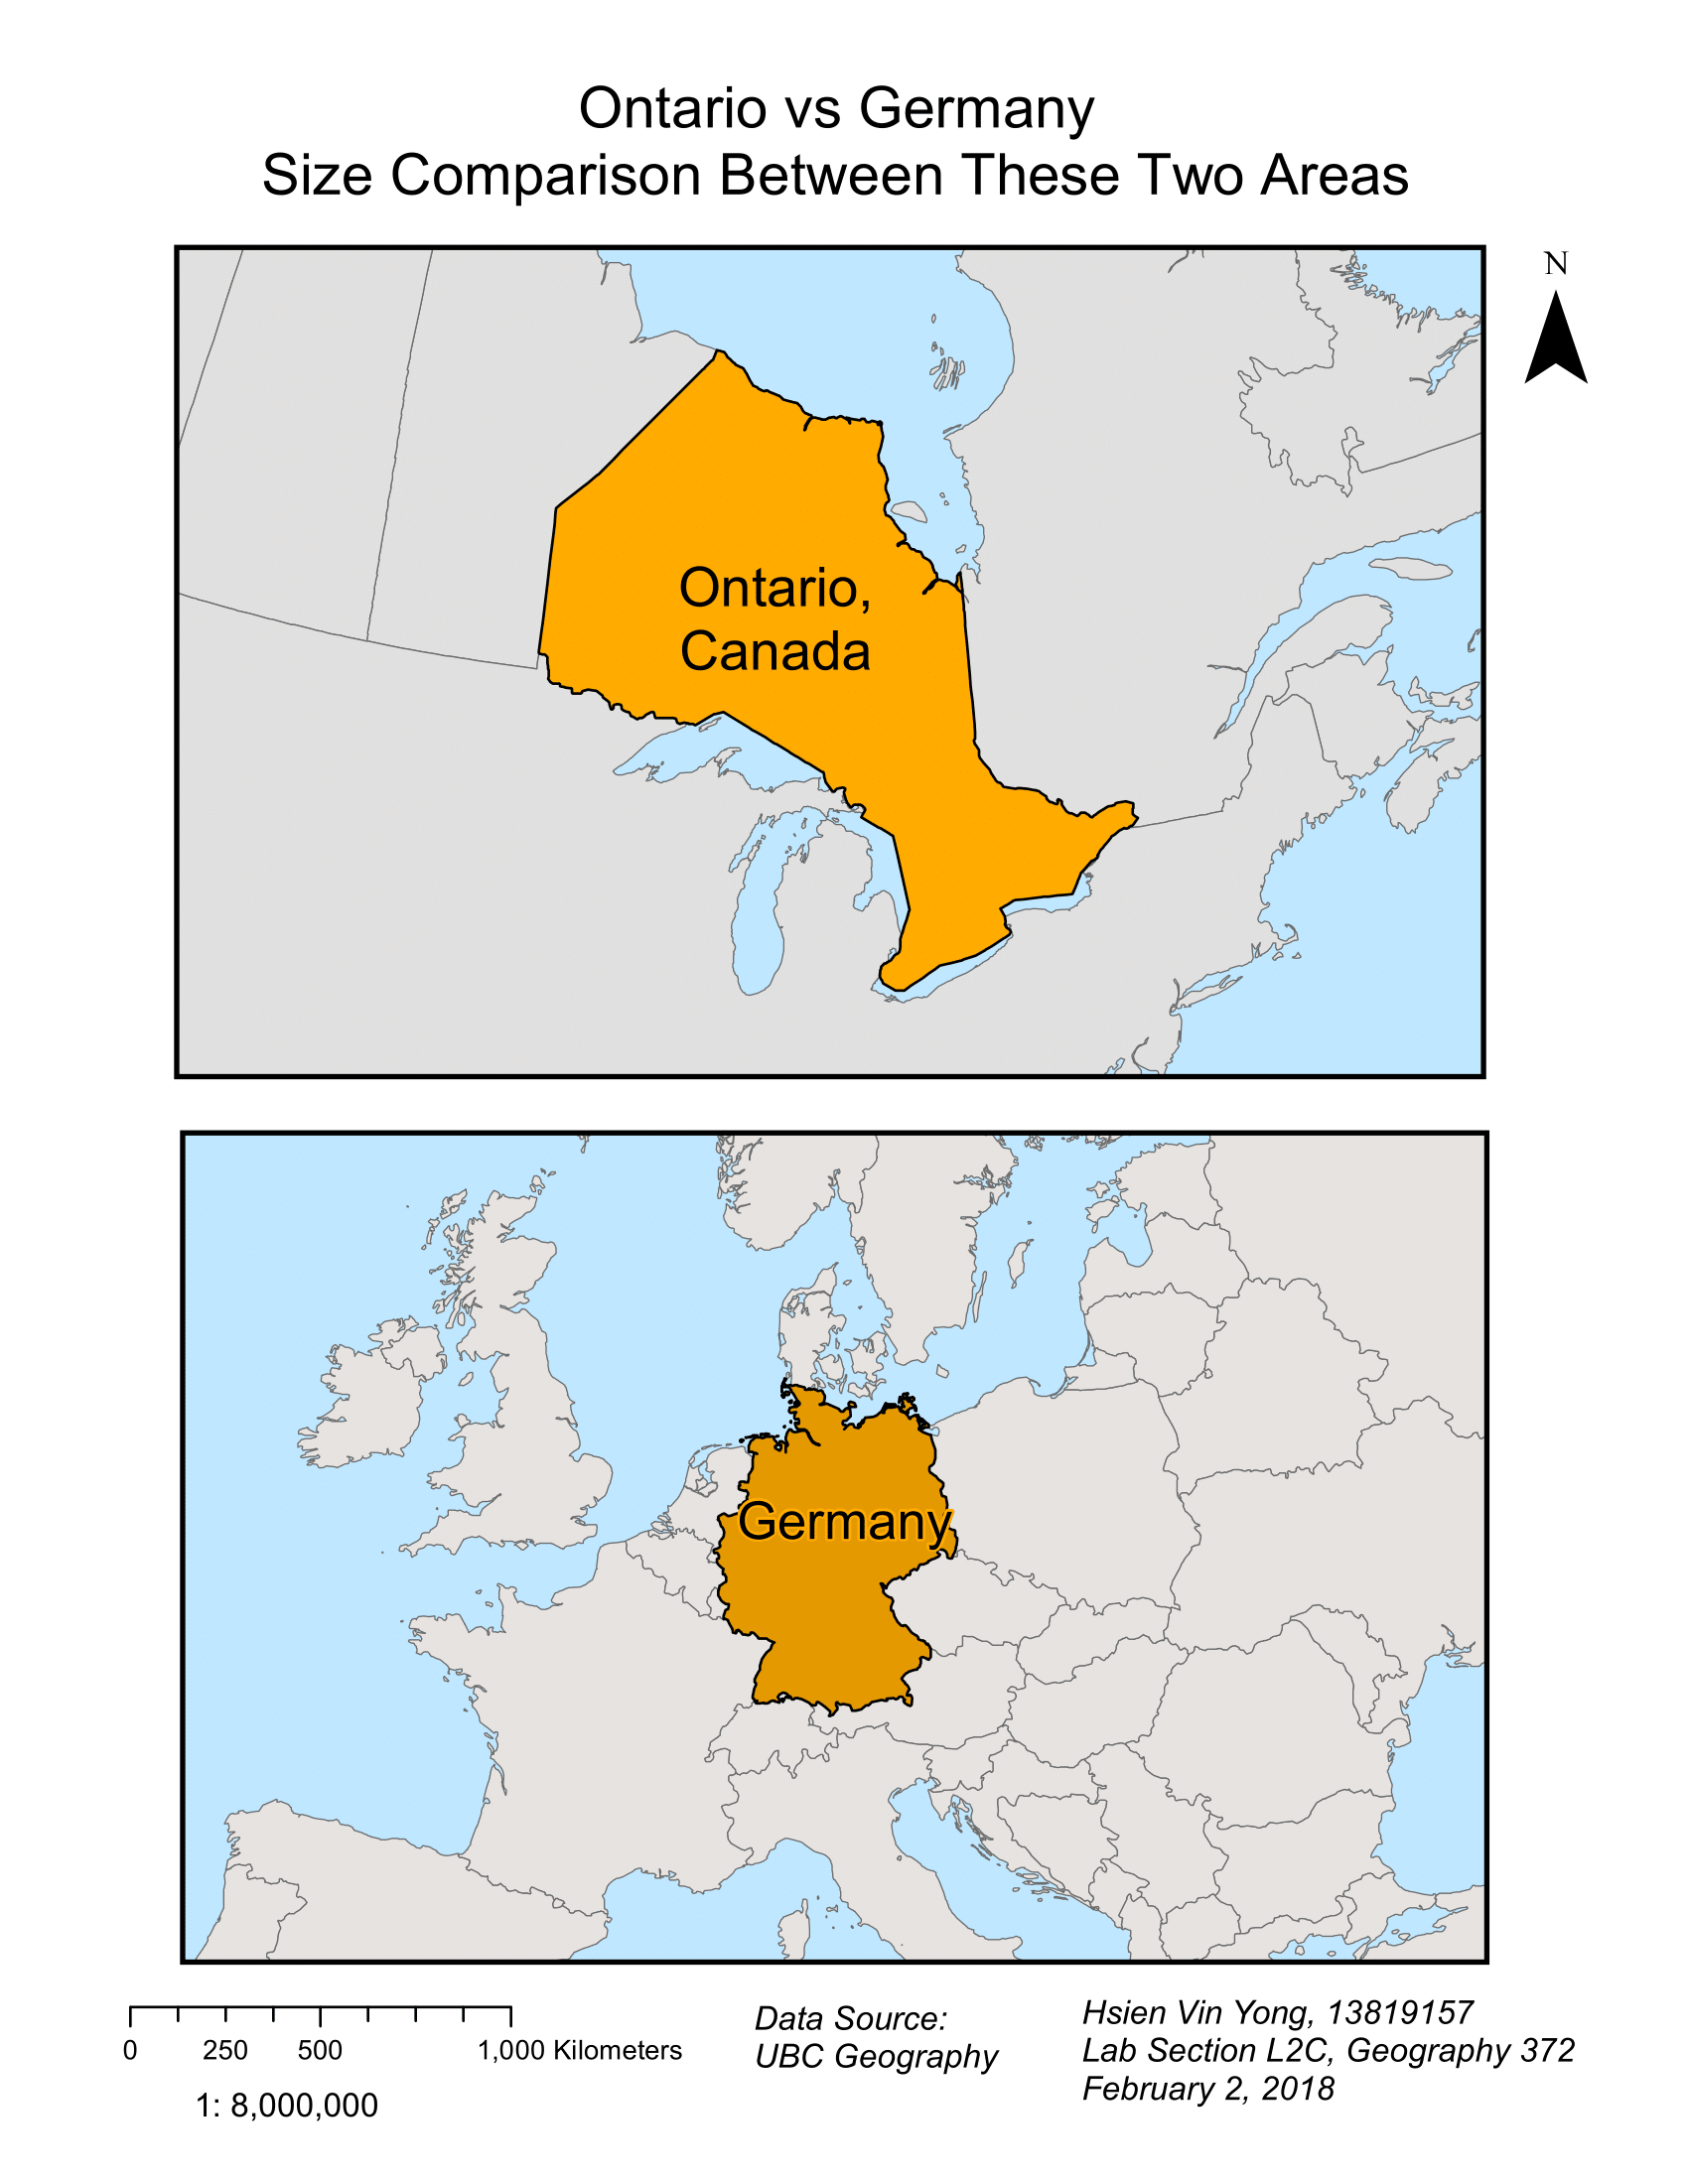
Ontario vs Germany: Size Comparison
Lab 4: Map Scale, Spatial Reference Systems, Position Determination
Lab 3: Lettering
Lab 2: Point, Line, and Area Symbols
Lab 1: Introduction to Adobe Illustrator
In Lab 1, we were introduced to Adobe Illustrator and was tasked to draw a tourist map of downtown Vancouver. I used Adobe Illustrator while using a reference of downtown Vancouver from Google Maps. Through this introduction, I have learned to use all the properties of Adobe Illustrator to develop a concise map and developed an effective map of Downtown Vancouver with some common tourist areas.
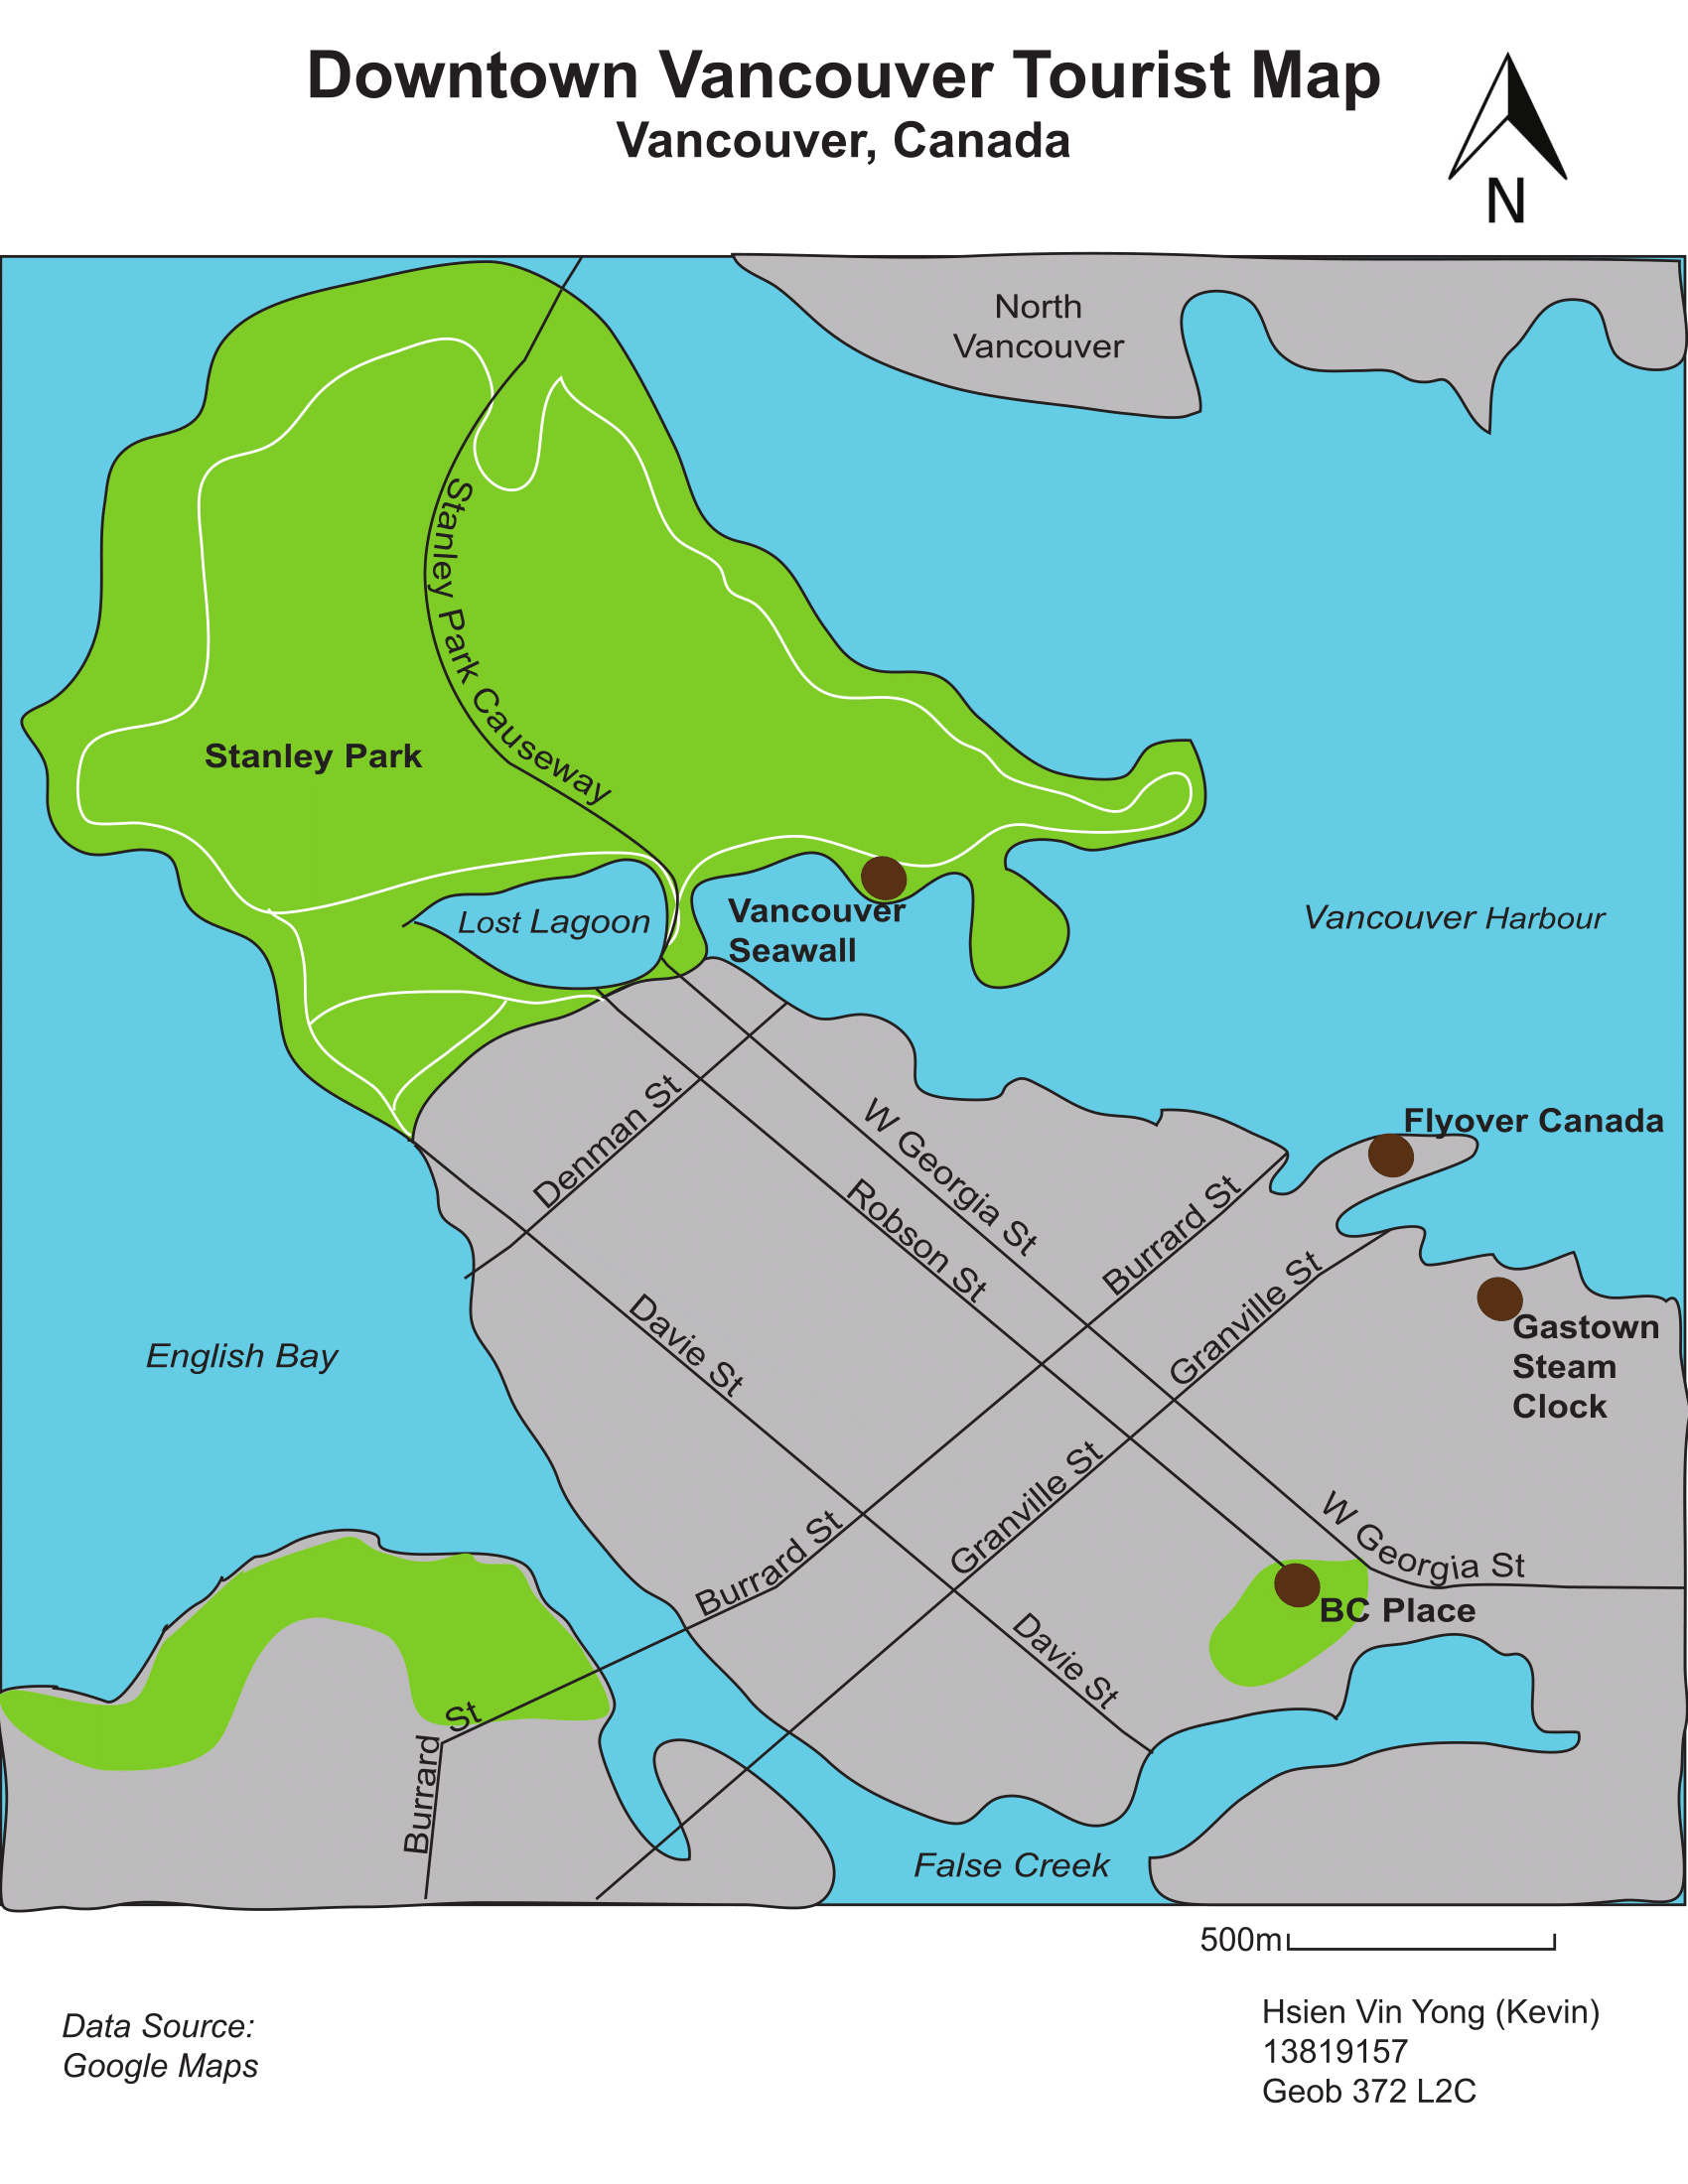
Downtown Vancouver Tourist Map
Geob 270- Introduction to Geographic Information Science
Lab 5: Environmental Assessment
Memo: Environmental Assessment of Garibaldi at Squamish Project
The Garilbaldi year-round mountain resort is set to be constructed in Garibaldi at Squamish. As a resource planner, I have created an environmental impact assessment to provide information on potential effects on vegetation and fish and wildlife habitat, and provide a series of recommendations to prevent or reduce any significant environmental, social, economic, heritage and health effects in proposed project area.
Firstly, I assessed the elevation in which the actual snow cover would be available to the ski resort, where areas below 600m would not potentially have enough snow to support the Ski Resort. In my results, 32% of the land were under 600m in elevation which meant that 68% of the project area elevation were above 600m. Therefore, it was economically viable for the proposed Garibaldi Ski Resort to be constructed and operated.
Next, I accessed the sustainability and the environmental risk of the Garibaldi Ski Resort. I had to examine the data where all the ecosystem species that existed in the project boundary area, the TEM (terrestrial ecosystem mapping), Old growth forest, ungulate habitats, red-listed species and fish bearing streams; which I created a map that would identify and locate the protected areas and at risk of the Ski Resort. These were the resulting area percentages of total project area that would be impacted by the construction of the Ski Resort:
- 8% of old growth forest
- 9% of ungulate habitats
- 8% of red-listed species
- 4% of fish bearing/ riparian areas around streams
Adding up together, these percentages sum up a total wildlife area of 67.9%. However, the total project protected area is 53.7% which is smaller than the total wildlife area of 67.9%. Hence, this meant that the protected area are not large enough to ensure the safety of all the ecosystem in the proposed project total area. This shows an environmental risk in which the surrounding ecosystem that are not part of the proposed project area might be negatively affected and potential environmental damage.
The two greatest environmental concerns are: 1) the unpredictable impacts that the project could potentially damage the environment, as the total wildlife area is more than half of the project area hence causing more harm to that area then benefits. 2) The loss of old growth forest will drive some species to extinction as some species may only thrive in old growth forest conditions, and removal of tree/vegetation support may increase the risk of landslides hence more cost would need to be allocated to landslide mitigation measures. The best way to mitigate all environmental impacts which is to not construct the resort in the project area and to just leave current environment as it is, that way, there will be no damage to endangered species, fish bearing areas, ungulate habitats and old growth forests.
Personal Take on the Garibaldi at Squamish Project proposal
When working on environmental projects, sometimes an individual has to become involved in proposals that they do not ethically believe in. I think the project should not be allowed to continue because of the evident data showing that the ecosystems are potentially at risk to environmental due to impacts that the project may caused. I have voiced these concerns in my memo as well.
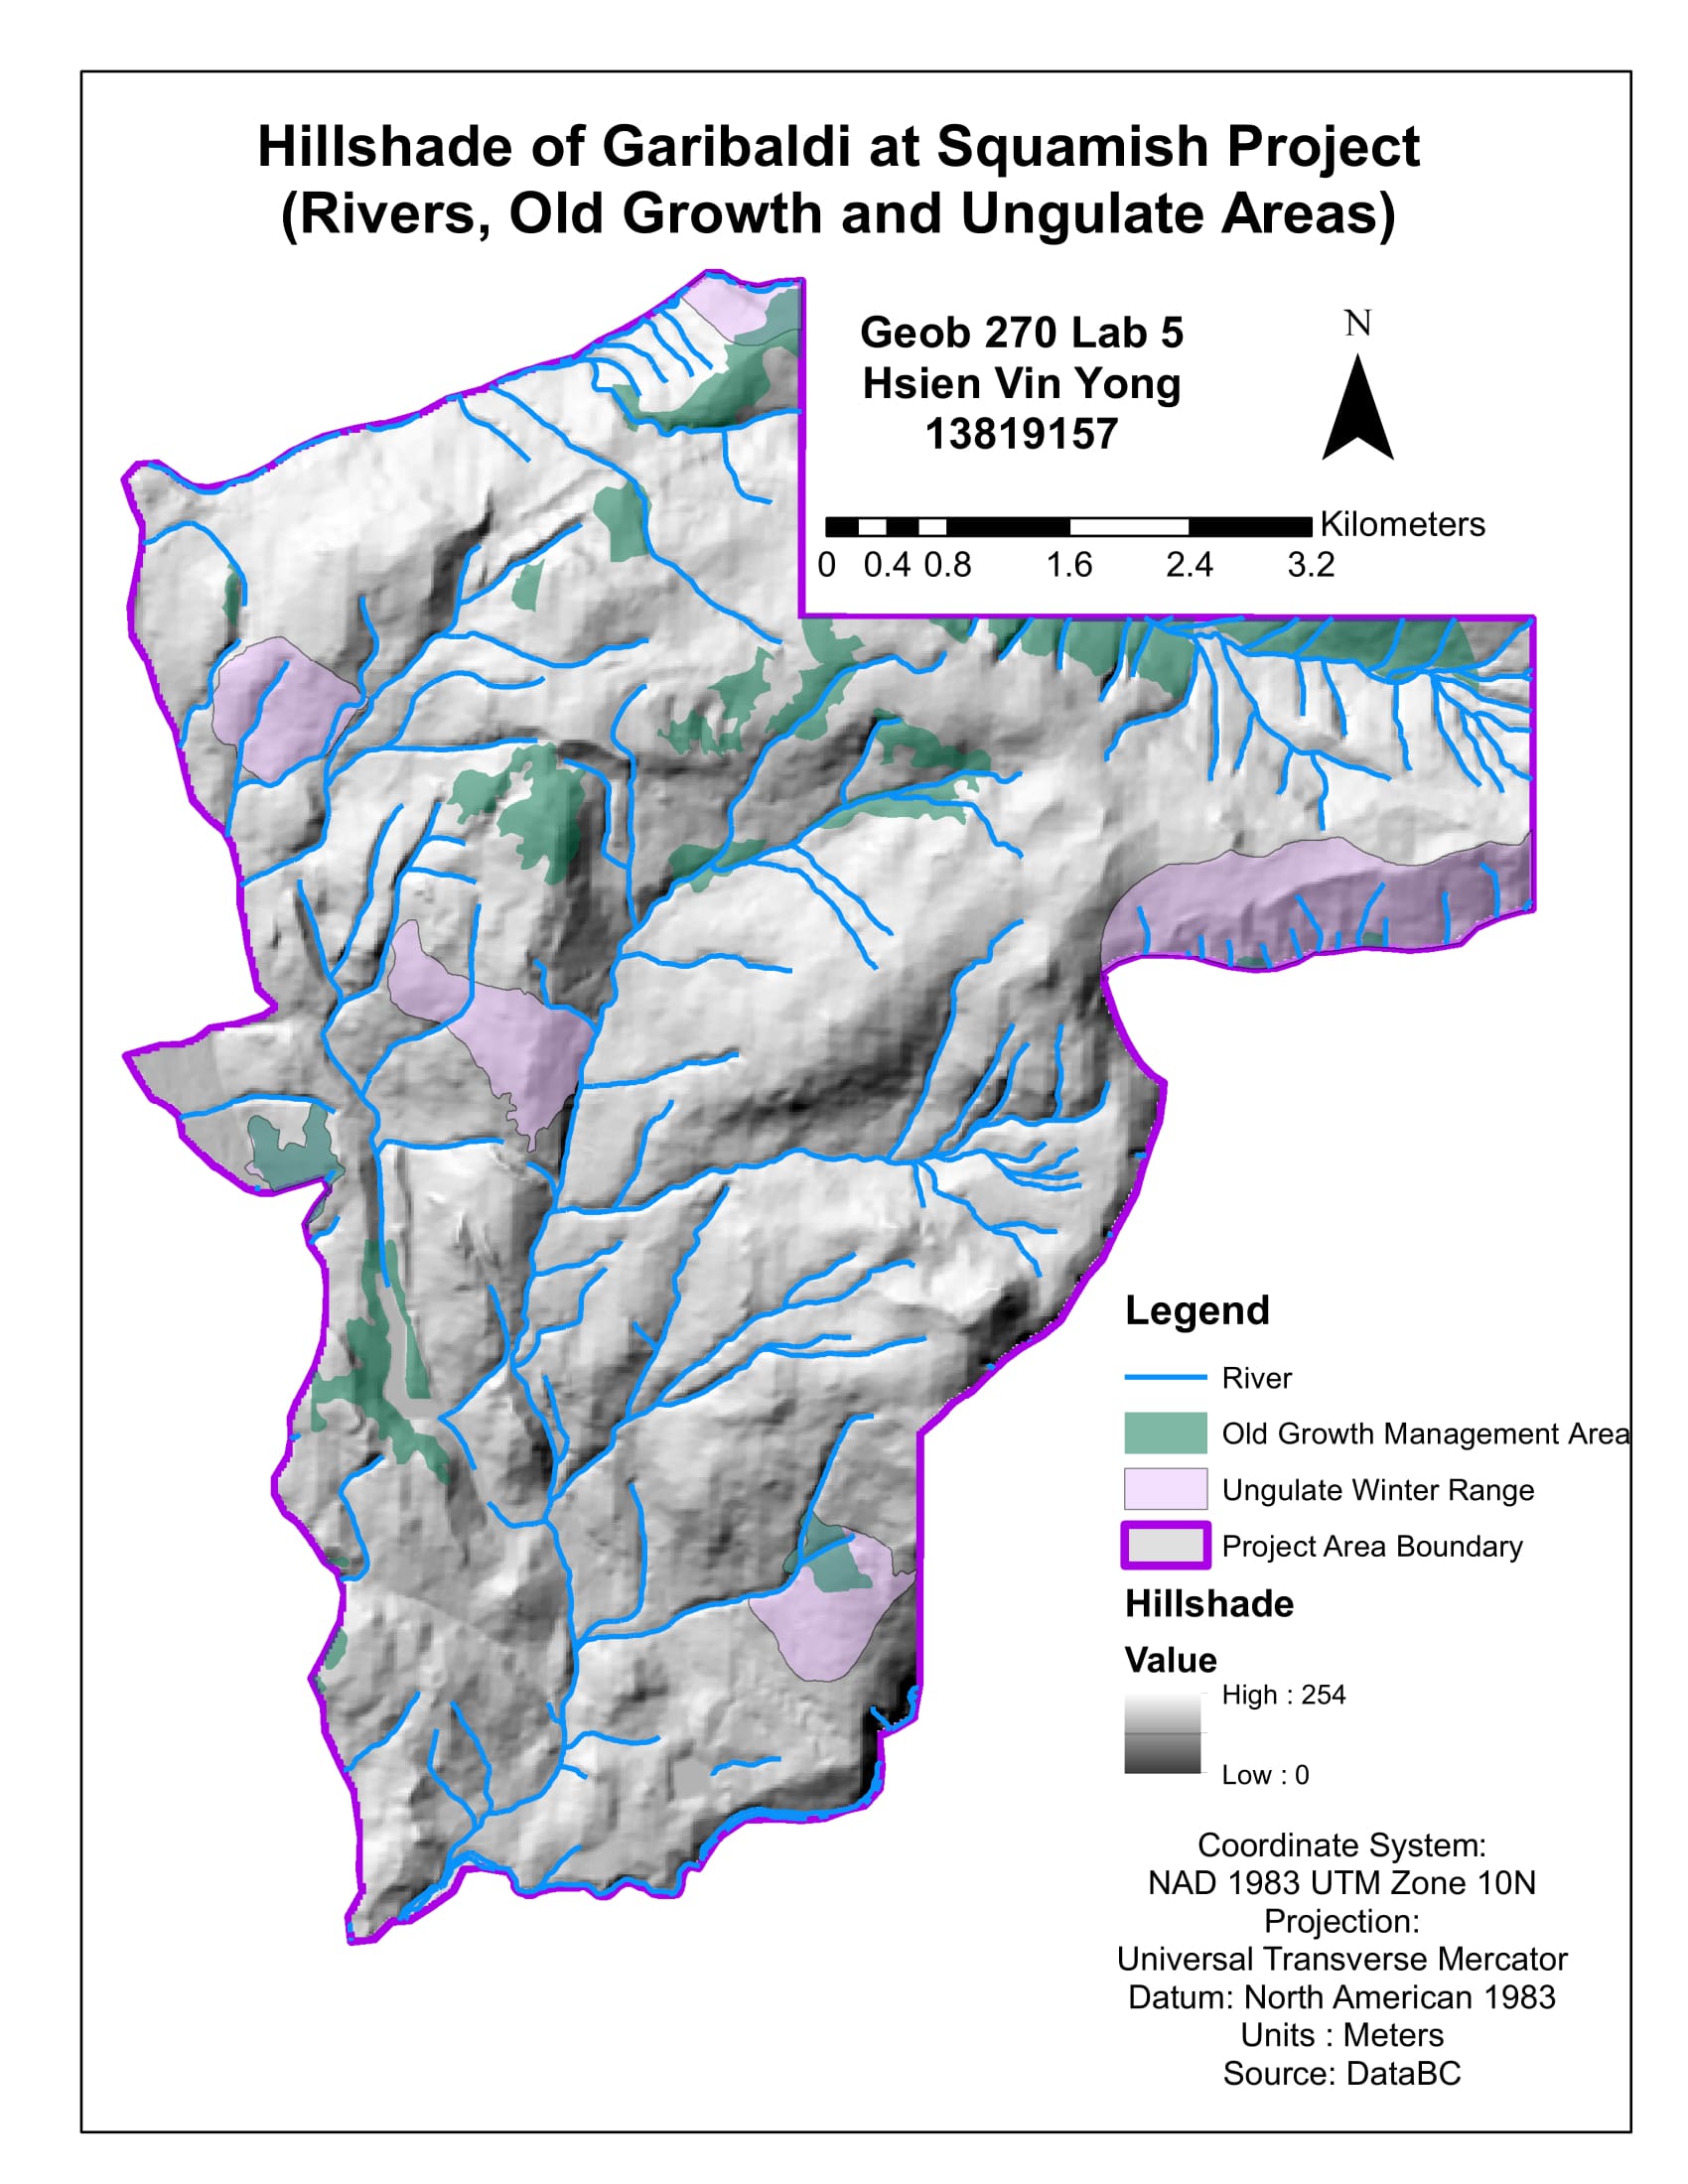
Hillshade of Garilbaldi at Squamish
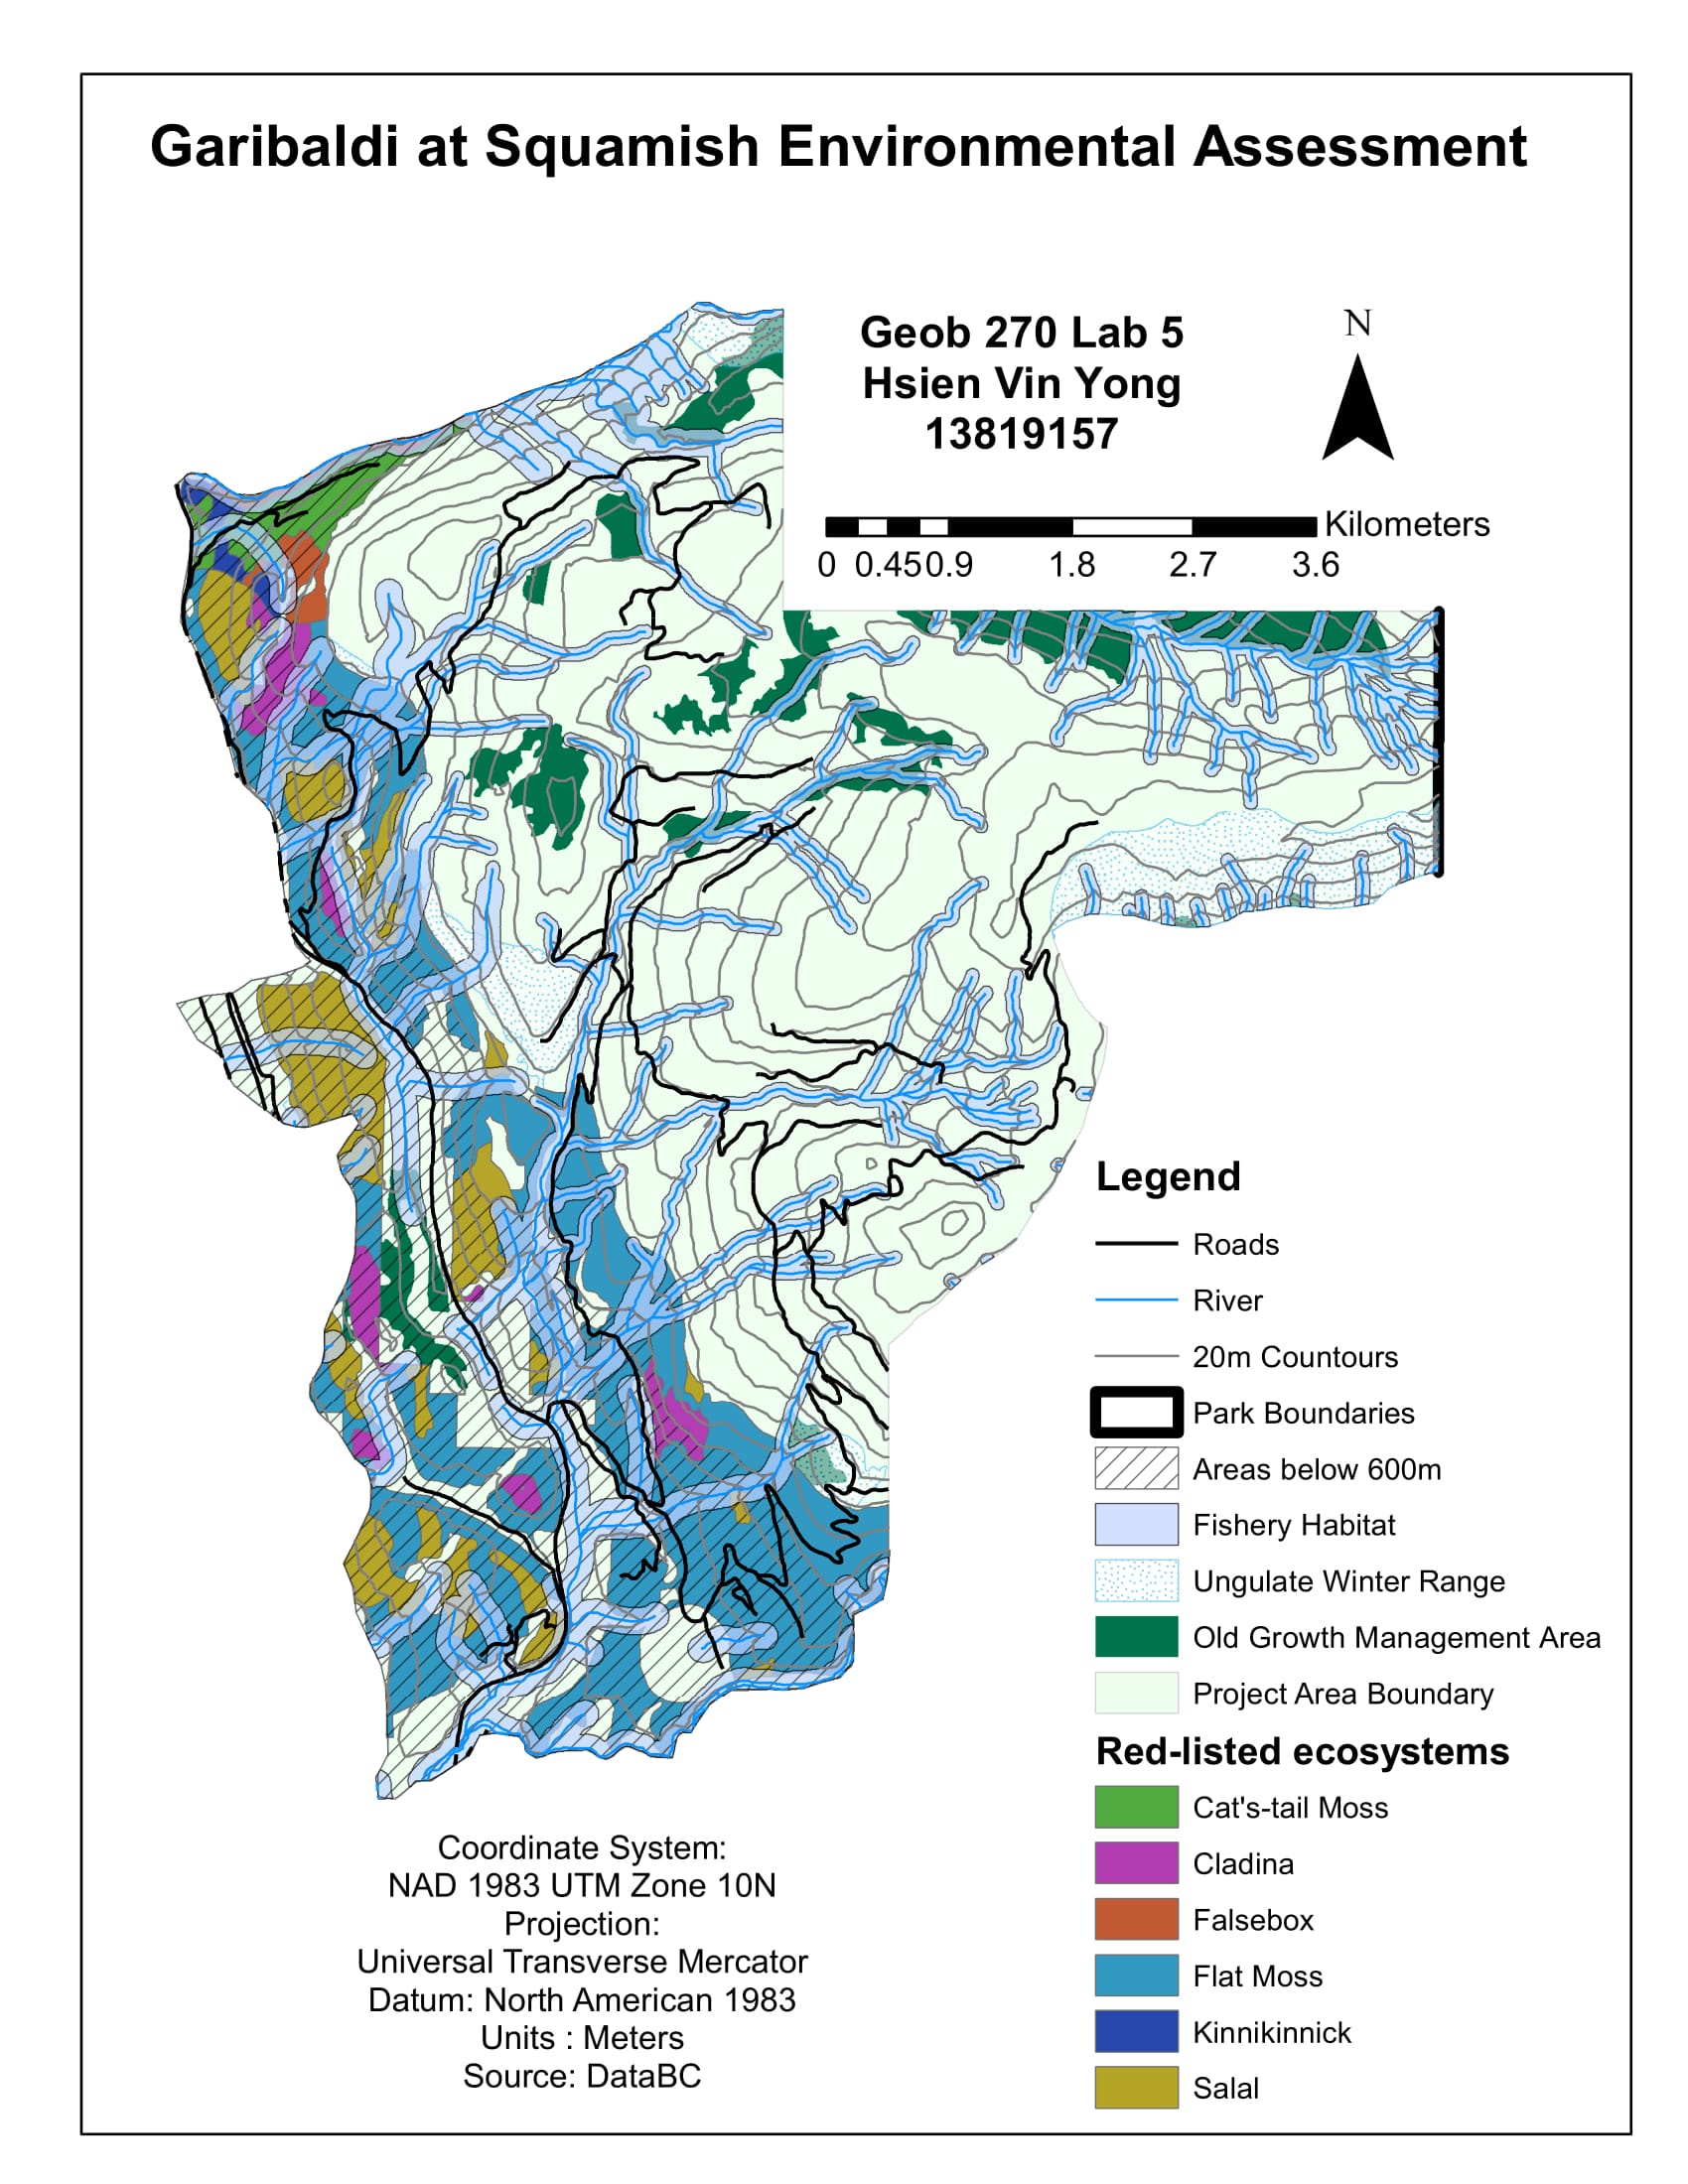
Garibaldi at Squamish Environmental Assessment
Lab 4: Housing Affodability
In this lab, I learned how to create a Housing Affordability Map to compare Vancouver and Ottawa.
Quantitative Data Classification
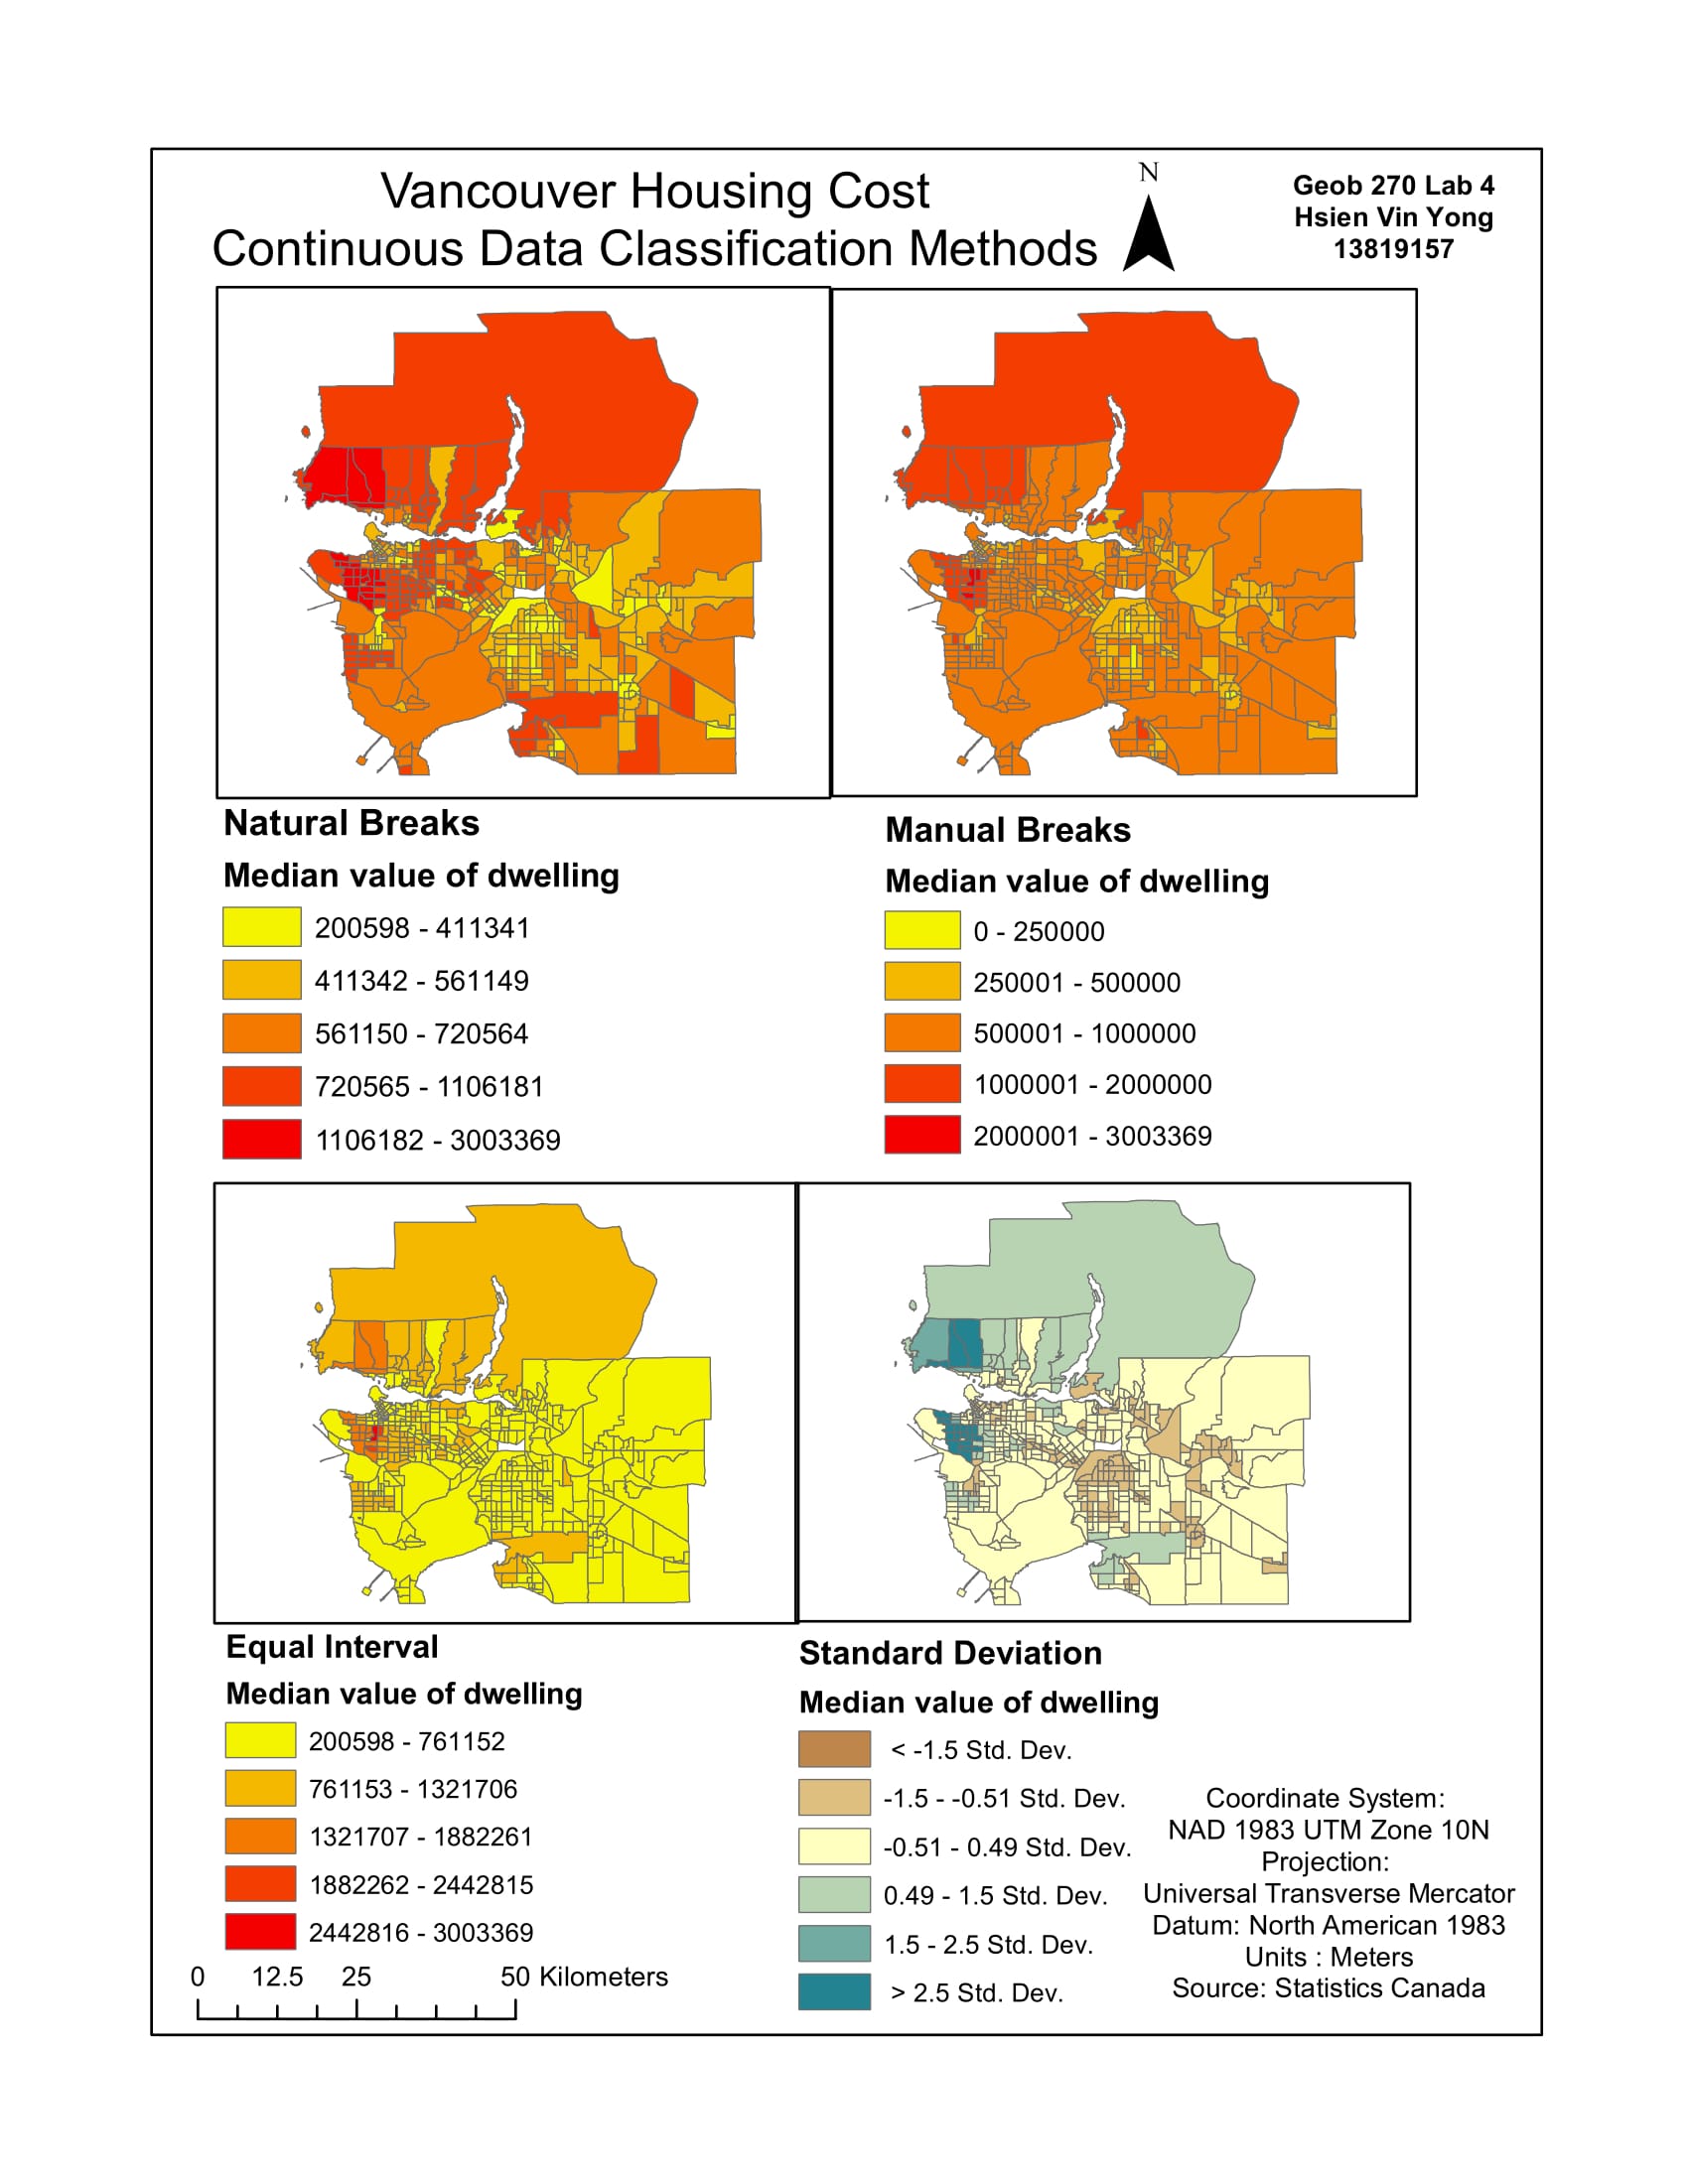
Vancouver Housing Cost: Continuous Data Classification Methods
Here I was given a question on which classification method would I choose and why if I were a Journalist or a Real Estate agent. As a Journalist, I would choose Manual Breaks classification method because it helps visualize which areas are the most and least expensive in terms of cost classification or break values that are round, even and is easily understandable by the general audience. As a real estate agent, I would choose the equal interval classification method because it helps visualize that the cost of housing is even across Vancouver with only a few dark tracts. Which helps prospective home buyers think that they are getting a good deal especially in the UBC neighborhood as it is known for its good location and reputation. The ethical implications is that any group or individual can use any classification method that showcases to their audience on what they want them to see in a way that suit their motives. In the case of the real estate agent, the buyer does not visually see how much UBC properties deviate from the standard, as these properties are more expensive than most of Vancouver.
Housing Affordability
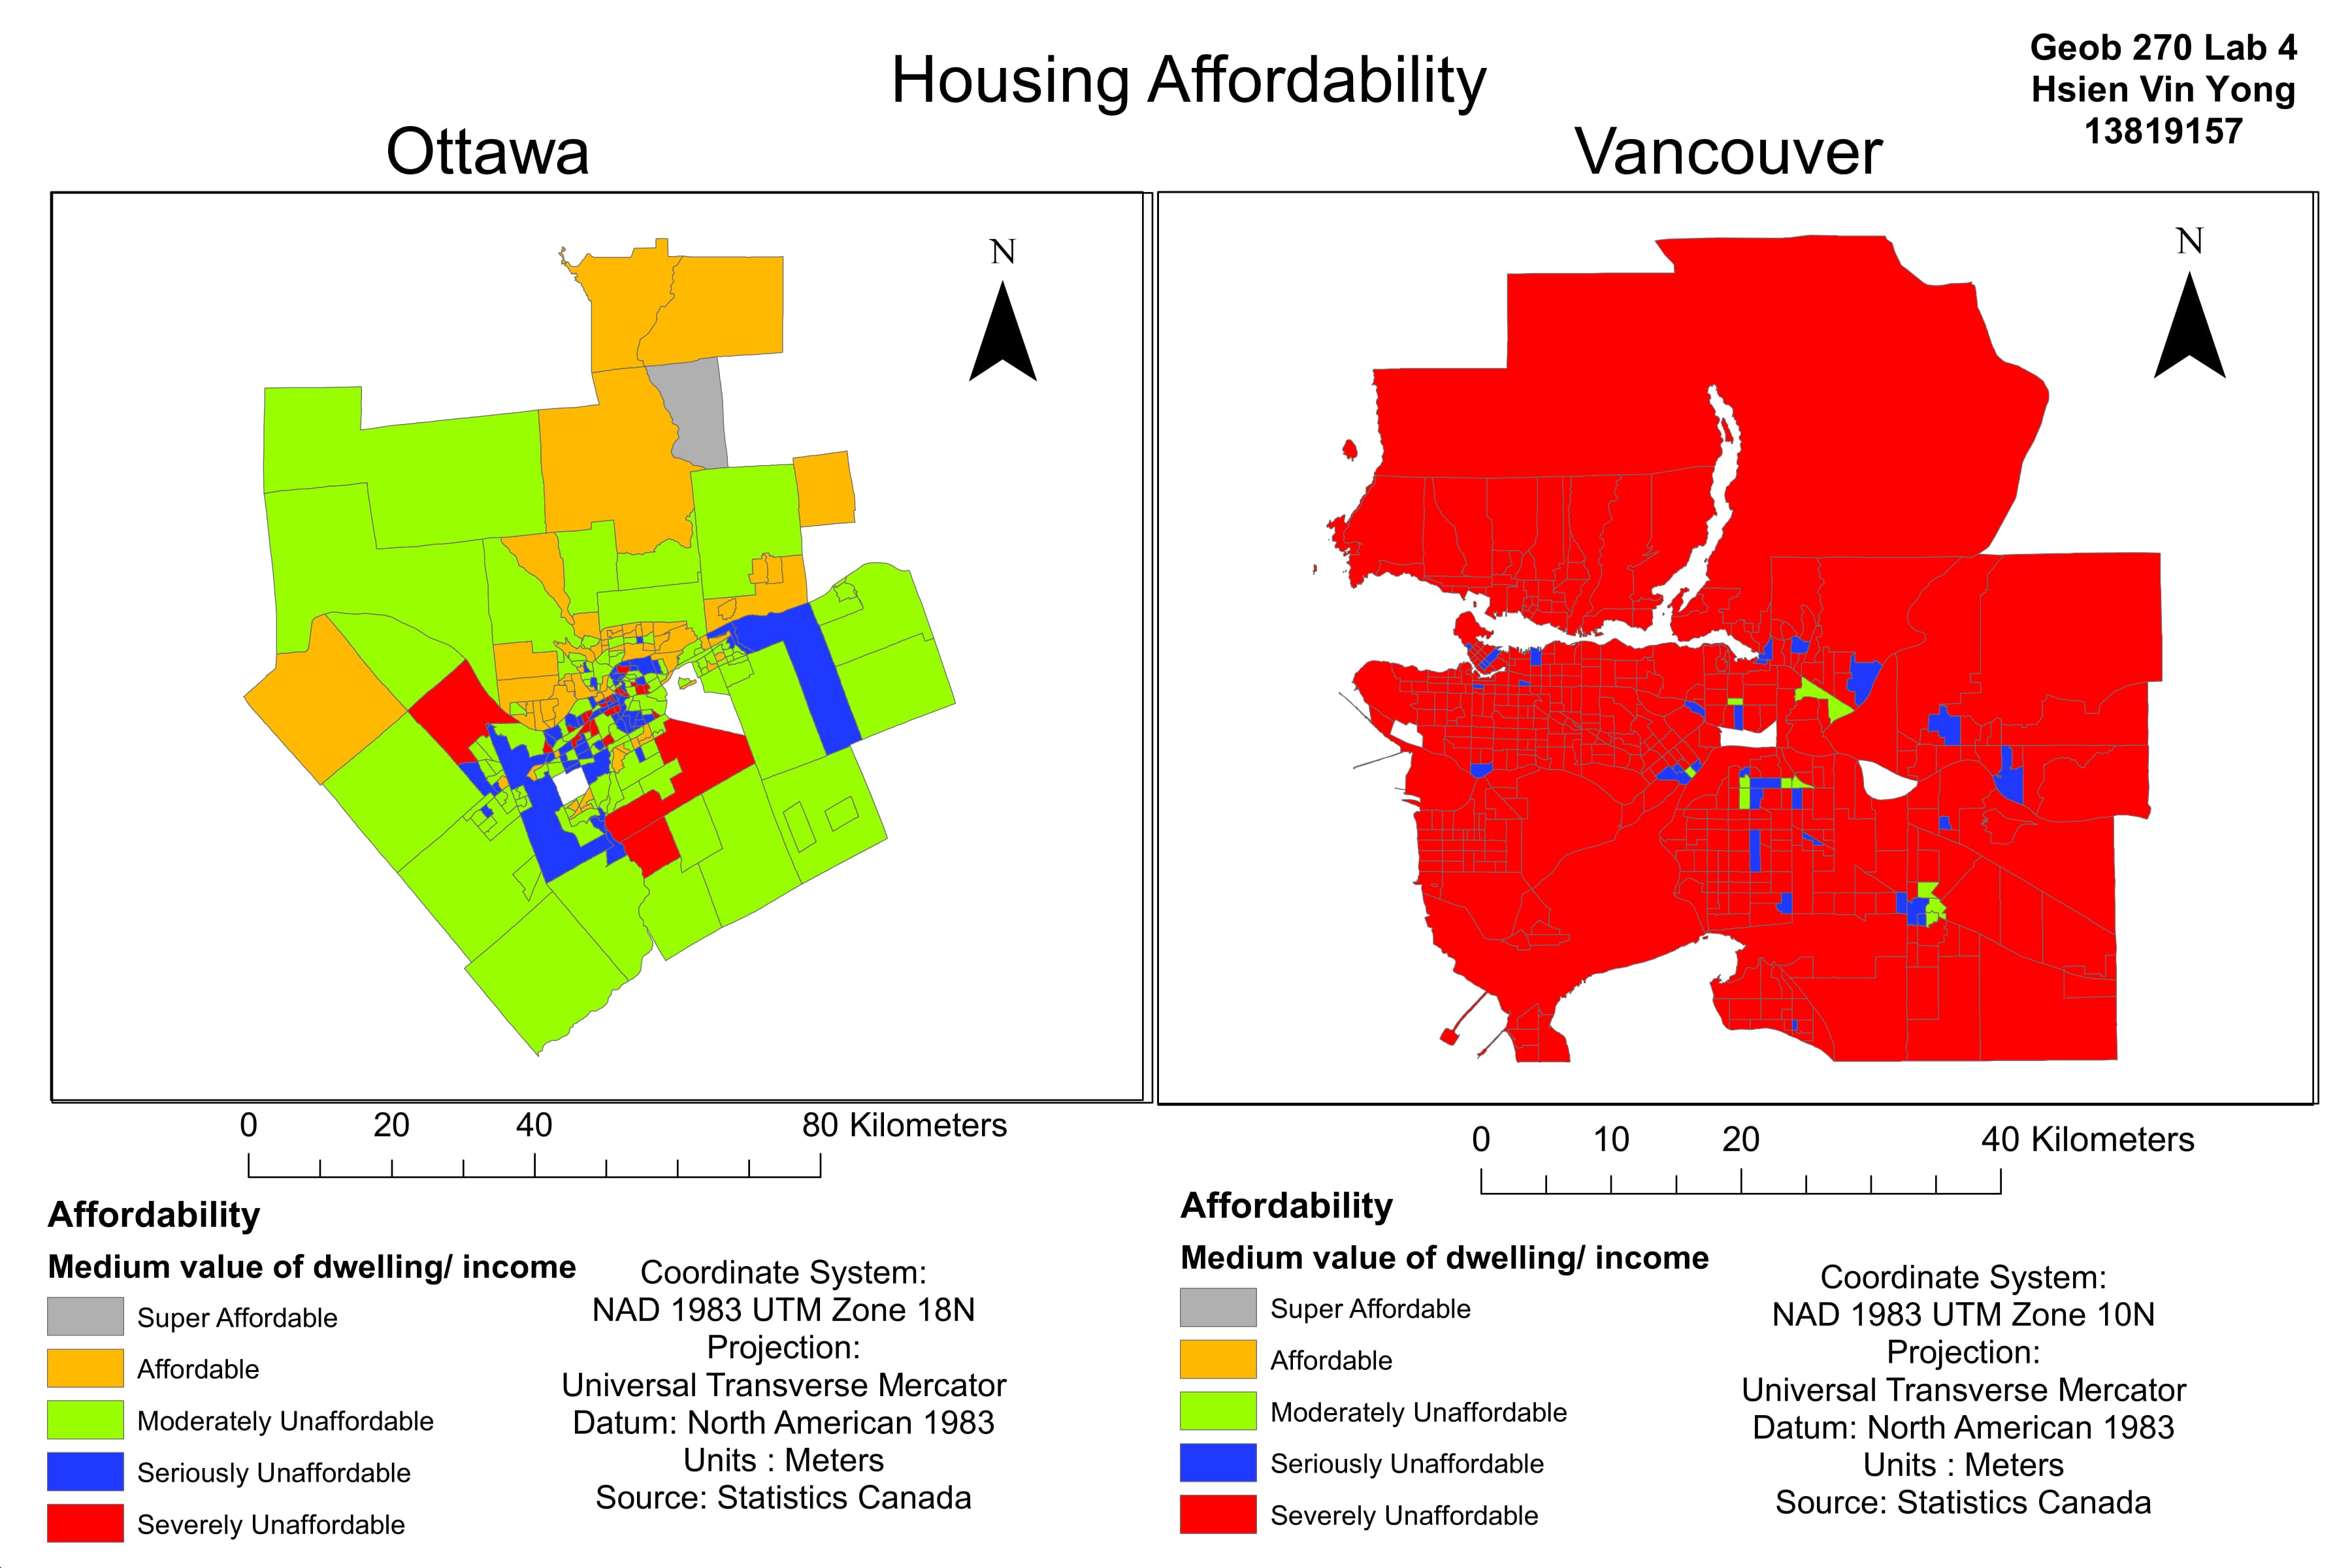
Housing Affordability: Ottawa and Vancouver
Affordability measures the ratio of median income to housing costs, which is a better indicator of housing affordability than housing cost alone because it factors into account the ability of the buyer to purchase a home of a certain with their given income.
The 11th Annual Demographia International Housing Affordability Survey determined the following housing affordability ratings as: 3.0 and under as Affordable, 3.1 to 4.0 as Moderately Unaffordable, 4.1 to 5.0 as Seriously Unaffordable and 5.1 & over as Severely Unaffordable. The purpose of this ratings is to monitor the rates of affordability and to alert policy makers regarding the decreasing of affordability in cities. This rating system can be trusted as it covers 378 metropolitan markets in nine countries and it is recommended by the United Nations and major World Banks for assessing affordability.
Affordability is not a good indicator of a city’s livability because it does not factor in employment availability, poverty rates, and access to quality healthcare and education. In order to determine the livability of a city, these factors as well as others must be included with housing affordability so proper livability assessment can be made.
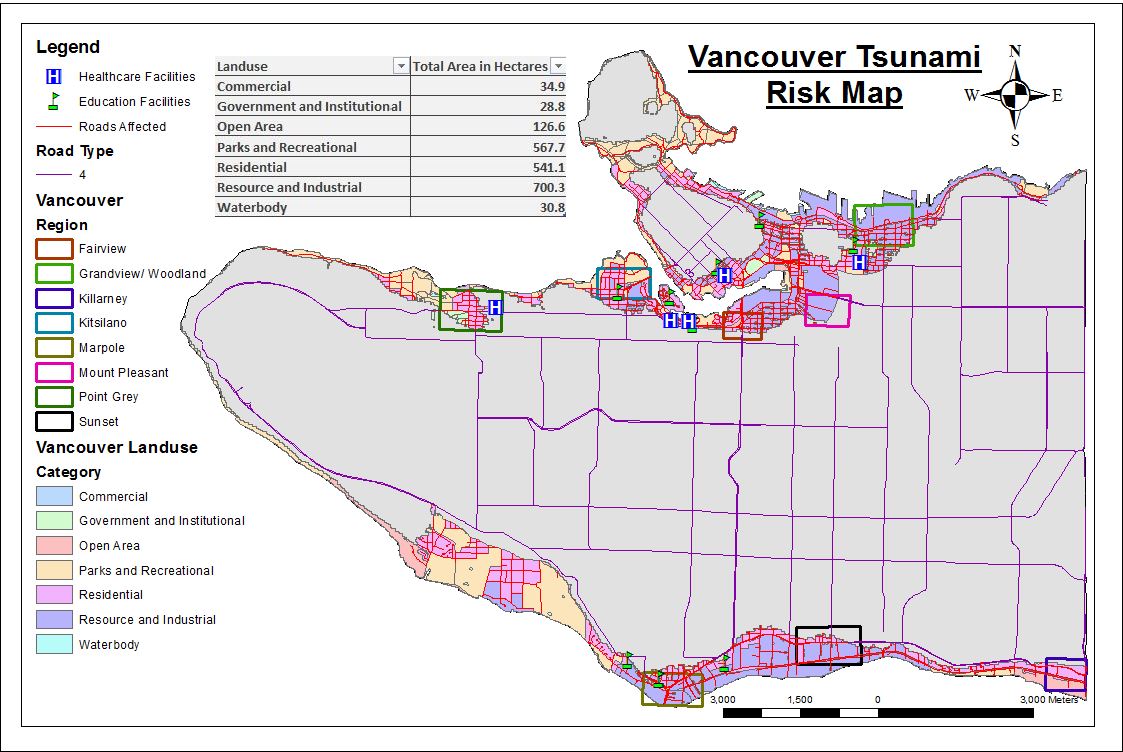
Lab 3: Planning for a Tsunami with ArcGIS
Percentage of City of Vancouver’s Total Area that is Affected by a Potential Tsunami
16% of the city of Vancouver would be in danger if there is a tsunami hits. To calculate this, I found the areas of ‘Vancouver_Danger’ and ‘Vancouvermask’ layers by going to their attribute tables respectively. Thus, I calculated the geometry of the area in square meters.
Total danger area of Vancouver =20302078.291704 meters – Summing up the category of ‘Sum of Danger Area in m2’ from table above
Total area of Vancouver =131033339.950334 meters – Going to the attribute table of ‘Vancouvermask’ layer in ArcMap
Percentage of the city of Vancouver total area affected by potential tsunami= (20302078.291704/ 131033339.950334) x 100%= 15.49383% ~ 16%
Education and Healthcare Facilities that are Affected by a Potential Tsunami
In order to find these facilities, I used Intersect tool in ArcToolBox, going to Analysis Tools > Overlay > Intersect. Then, I combine the ‘Vancouver_Danger’ layer with the ‘Vancouver_health’ and ‘Vancouver_education’ layer separately. Then, I opened the Attribute tables of the two newly intersected layers to see the names of the healthcare and education facilities that could be affected by a potential Tsunami. Here are the list of the education and healthcare facilities within the Vancouver Danger Zone:
Education facilities within the Vancouver Danger Zone:
- ST ANTHONY OF PADUAECOLE ROSE DES VENTS
- HERITAGE 3R’S SCHOOL
- VANCOUVER MONTESSORI SCHOOL
- FALSE CREEK ELEMENTARY
- EMILY CARR INSTITUTE OF ART & DESIGN (ECIAD)
- HENRY HUDSON ELEMENTARY
- ST JOHN’S INTERNATIONAL
- ST FRANCIS XAVIER
- INSTITUTE OF INDIGENOUS GOVERNMENT (IIG)
Healthcare facilities within the Vancouver Danger Zone:
- FALSE CREEK RESIDENCE
- BROADWAY PENTECOSTAL LODGE
- COAST WEST COMMUNITY HOME
- YALETOWN HOUSE SOCIETY
- VILLA CATHAY CARE HOME
Lab 2: Coordinate Systems and Spatial Data Models
Projection Obstacles
In lab 2, we learn how to repair misaligned and improperly referenced spatial data. Coordinate system information (such as area, angles, direction, and distance) are crucial when working with spatial information but, improperly referenced data is a common occurrence. When this spatial data is projected into a different coordinate system, this may cause problems in how it is displayed when added to the map (Misaligned layer). To fix this, you would have to use ArcToolbox and use the Data Management Tools to change the layer’s projection into the right coordinate system.
Landsat Data Advantages
Landsat is a remote sensing program that has been continuously scanning earth since 1972. It uses sunlight as its energy source and measures the response of objects and surfaces on Earth. Landsat satellites are able to use different wavelengths to produce images of the objects and surfaces of the Earth.
Landsat data is used to measure land change due to natural disasters, for example the effects of the tsunami on the coastal vegetation before and after the tsunami. A research question for geographical analysis would be like this: ‘What was the effects did a natural disaster such as Tsunami have on the coastal vegetation in a specific location? The location you would choose would be the specific location in which the Tsunami happened in (e.g. The 2004 Indian ocean Tsunami in Acheh, Indonesia). The interval in which you would used would be 2 weeks before the tsunami, the period after the Tsunami, and 10 years after the tsunami. It is important to take into account of seasonal changes when looking at the data, for example, for the 2004 Indian Ocean Tsunami data, you would have to look out for monsoon seasons.
Lab 1: First Discovery of GIS
After approximately of 3 hours of Training through esri training, I have learned basic knowledge regarding GIS that would help me in completing my upcoming lab assignments. Through the training I received an introduction to the basic components of GIS, where I learn fundamental concepts relating to GIS with hands-on experience with maps and geographic data with the use of GetData and ArcMap.