Mapping Data with Google Fusion Tables
Import your data
- Go to Fusion Tables (http://www.google.com/fusiontables/Home/)
- Click See my tables (If you aren’t already logged into your Google Account, sign in with your username and password)
- Click the Create button. Choose Table
- Specify the file to upload, and press the Next button.
- Find the Excel file, cleaned and prepped in Exercise 2: Cleaning Data: V2.0 UNHCR Horn of Africa
- Fusion Tables will guess which row in the data has the column names. If it doesn’t pick the right one, select it. Then click Next.
- Name your new table and enter metadata. Call it UNHCR Horn of Africa Refugee Camps.
- Press Finish.
Map the data
- Fusion Tables attempts to auto-detect the location columns. If not, you’ll need to tell Google which columns contain location data.
- Click Edit. Click Change columns. Select the “Latitude” column and change it’s Type to “Location.” Check the Two column location box. Select Latitude from the Latitude drop down menu and Longitude from the longitude drop down menu.
- Click Save.
- From the Visualize menu and choose Map.
- You will need to tell Google, again, which location data you wish to use to populate the map.
- Find the drop-down menu above the map called Location and select Latitude.
You can customize the map and info bubbles. But first, let’s add an image and another layer of information for one of the camps
To add a polygon shape outline of a camp:
- Return to the Table view of your data by clicking Table Tab.
- Click Edit, Add column
- Name the column “Geometry” and select “Location” for Type
- Click Save
- In the row for Bokolmanyo camp, click in the new Geometry column and paste the following coordinates:
- <Polygon><outerBoundaryIs><LinearRing><coordinates>41.53784,4.548319,0.0 41.537502,4.548147,0.0 41.537423,4.547734,0.0 41.537276,4.54716,0.0 41.537045,4.546735,0.0 41.536624,4.546321,0.0 41.536141,4.546103,0.0 41.535248,4.546344,0.0 41.53452,4.546632,0.0 41.53441,4.547126,0.0 41.534265,4.54784,0.0 41.533828,4.548348,0.0 41.532547,4.548425,0.0 41.532118,4.548214,0.0 41.531836,4.547922,0.0 41.531798,4.547139,0.0 41.531945,4.546616,0.0 41.532139,4.545914,0.0 41.532263,4.545572,0.0 41.532305,4.544985,0.0 41.532481,4.544412,0.0 41.532939,4.543855,0.0 41.533102,4.543249,0.0 41.533483,4.542707,0.0 41.534089,4.542396,0.0 41.534628,4.542363,0.0 41.534857,4.541788,0.0 41.534594,4.540771,0.0 41.534261,4.539899,0.0 41.534005,4.539042,0.0 41.534018,4.538416,0.0 41.53413,4.537855,0.0 41.534544,4.537691,0.0 41.53532,4.537511,0.0 41.536352,4.537324,0.0 41.537403,4.536906,0.0 41.538493,4.536641,0.0 41.538526,4.536624,0.0 41.539914,4.53609,0.0 41.54122,4.535704,0.0 41.541618,4.535916,0.0 41.541667,4.535982,0.0 41.54185,4.536429,0.0 41.542265,4.537041,0.0 41.542845,4.537024,0.0 41.542895,4.537008,0.0 41.542995,4.536959,0.0 41.543857,4.536677,0.0 41.544787,4.536427,0.0 41.545683,4.536841,0.0 41.546097,4.537603,0.0 41.546229,4.538381,0.0 41.546328,4.538911,0.0 41.546727,4.539092,0.0 41.547359,4.53967,0.0 41.547591,4.540332,0.0 41.547358,4.541176,0.0 41.546976,4.541738,0.0 41.54666,4.542449,0.0 41.54666,4.542515,0.0 41.546176,4.542911,0.0 41.545429,4.542994,0.0 41.544732,4.543109,0.0 41.54455,4.543455,0.0 41.54465,4.543803,0.0 41.545065,4.544695,0.0 41.545346,4.545537,0.0 41.545677,4.546594,0.0 41.545909,4.547552,0.0 41.54571,4.548296,0.0 41.544865,4.548839,0.0 41.544549,4.549348,0.0 41.543903,4.549692,0.0 41.54329,4.549591,0.0 41.542711,4.549242,0.0 41.542216,4.548675,0.0 41.541803,4.547898,0.0 41.541654,4.54752,0.0 41.541045,4.547515,0.0 41.540353,4.547677,0.0 41.539478,4.547907,0.0 41.538689,4.548198,0.0 41.538182,4.548308,0.0 41.53784,4.548319,0.0</coordinates></LinearRing></outerBoundaryIs></Polygon>
- Now re-visualize the map
- This time, in the Location drop-down menu, select Geometry (instead of Latitude)
- There should be a polygon overlay on the Bokolmanyo camp.
To add an image to the info window:
- Return to the Table view of your data by clicking Table tab.
- Click Edit, Add column
- Name the column “Image,” leave the Type as “Text” and change the Format to “Four Line image”
- Click Save
- Search Google Images, Flickr or some other image database for a photo of one of the refugee camps
- Copy the Image Address and paste it into the appropriate row under the new Image column
- It should show up as a thumbnail image in the column
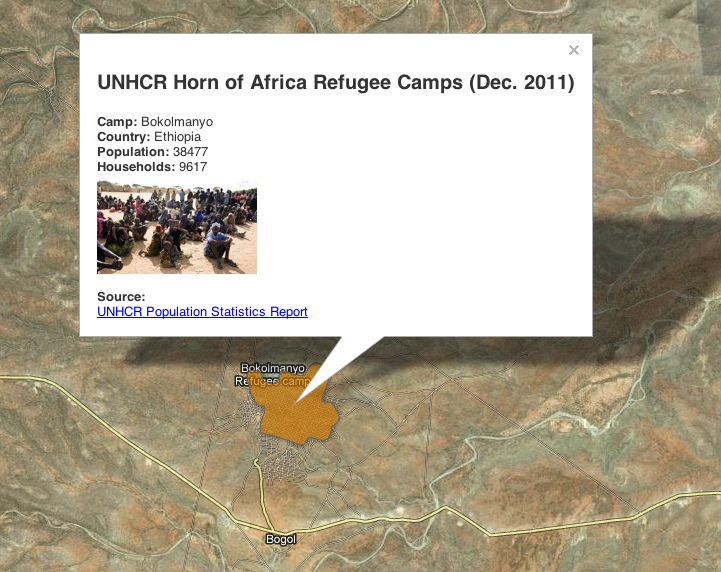
- Re-visualize the map. The image you chose should show up in the info window when you click on that camp
Customize the image window:
- While viewing the map, click on Configure Styles
- Choose a different, more prominent marker icon
- Click Save.
- Click on Configure info window
- You can use the automatic settings to add or remove elements from the spreadsheet to the info windows, or you can use Custom settings
- Copy and Paste the following HTML to clean up the info window, or, if you know HTML, make up your own:
<p style=”font-size:15pt; font-family: sans-serif”><b>UNHCR Horn of Africa Refugee Camps (Dec. 2011)</b></p><div class=’googft-info-window’ style=’font-family: sans-serif’><b>Camp:</b> {Camp}<br><b>Country:</b>{Country}<br><b>Population:</b> {Individuals}<br><b>Households:</b> {Households}<br><img src='{Image}’ height=’100′ style=’vertical-align: top’/><br><br><b>Source:</b><br><a href=”{URL}”>UNHCR Population Statistics Report</a></div>
With this custom HTML box you can include links, photos, videos, etc.
- For more on this, see the Google Fusion tutorial: http://support.google.com/fusiontables/bin/answer.py?hl=en&answer=1244603#custompopup
Now, when you click on a camp, the info box should look a little sharper
Sharing your map:
- You can share a link to the map by clicking Get link (top right).
- You can embed the whole map in a blog, etc. by clicking Share (top right), then select either Public or Unlisted from the Visibility options, then return to the map and click Get embeddable link

