Summary of Key Findings
– Winter – Average monthly temperatures have increased and total monthly precipitation has decreased
– Summer – Average monthly temperatures have increased and total monthly precipitation has decreased
– Temperature and precipitation are impacted by Pacific Decadal Oscillations (PDO) and El Nino Southern Oscillations (ENSO), especially when warm PDO is in phase with El Nino, which results in high winter and summer temperatures and low summer precipitation
– These results provide evidence that water availability in the summer is decreasing as a result of winter precipitation occurring more as rain rather than snow and less recharge in the storage reservoirs from decreasing summer precipitation.
Annual Precipitation and Temperature
On an annual basis, the Sunshine Coast typically experiences cool and wet winters and warm and dry summers as shown in the figure below.
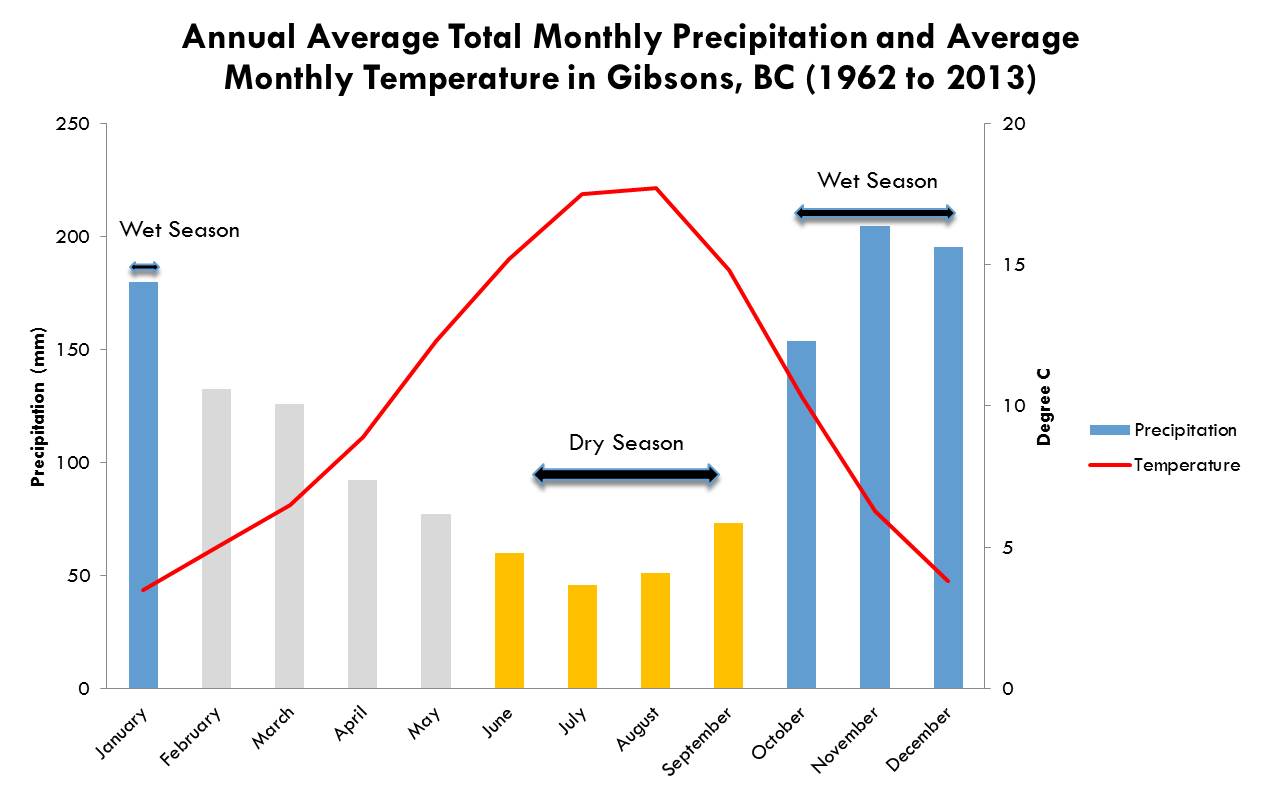
Figure 4: Annual aerage total monthly precipitation and average monthly temperature in Gibsons, BC (1962 to 2013)
In Gibsons, from 1962 to 2013, total annual precipitation significantly decreased (Seasonal Mann-Kendall, p=0.022, Sen’s slope = -0.294), and mean annual temperatures significantly increased (Seasonal Mann-Kendall, p=6.3×10⁻²⁴, Sen’s slope = 0.34) (Figure 5).
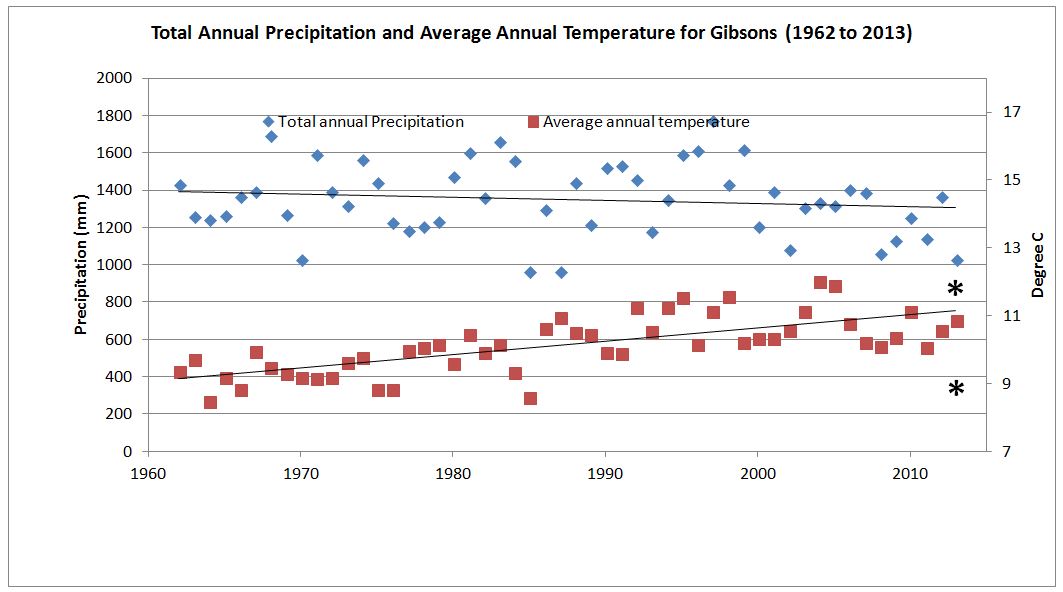
Figure 5: Total annual precipitation and average annual temperature in Gibsons BC from 1962 to 2013. Both trends are significant (denoted by * on right hand side of trendline): Temperature (Seasonal Mann-Kendall, p = 6.3×10⁻²⁴, Sen’s slope = 0.34) and Precipitation (Seasonal Mann-Kendall, p = 0.022, Sen’s slope = -0.294)
Mean monthly temperatures in the winter months have increased between 1962 and 2013. Similar trends have been experienced for maximum and minimum temperatures as well. For maximum temperatures during the winter season, increases have been experienced in all months with the only significant increases occurring in January (Mann Kendall, p=2.8×10⁻³). Monthly minimum temperatures during the winter season have significantly increased for all months (Figure 6).
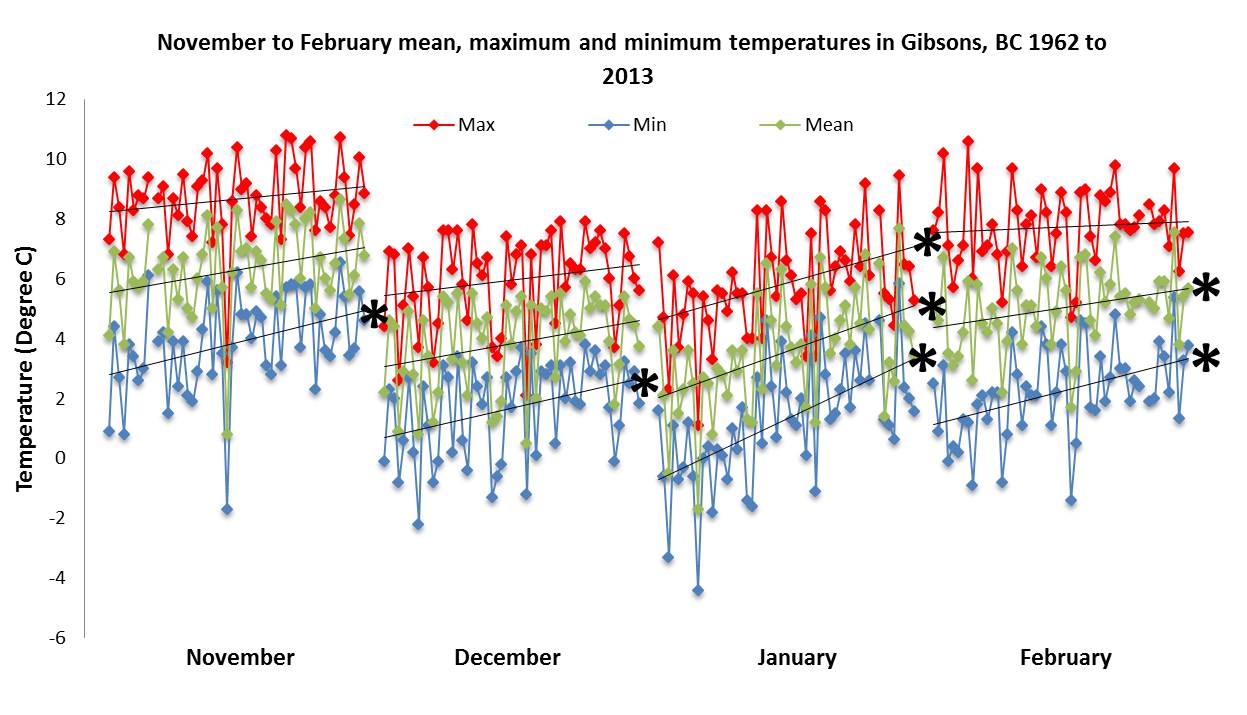
Figure 6: Historic monthly mean, maximum and minimum temperatures for November to February collected at the Gibsons Gower Point climate station, BC from 1962 to 2013 – Significant trends (denoted by * on right hand side of trendline) include: Maximum temperature for January (Mann Kendall, p=0.0028), Minimum temperature for November (Mann Kendall, p=0.013), December (Mann Kendall, p=0.016), January (Mann Kendall, p=1.2×10⁻⁵), and February (Mann Kendall, p=7.2 x 10⁻⁴), and mean temperatures for January (Mann Kendall, p=1.7×1045) and February (Mann Kendall, p=0.03).
Although historic trends for total monthly precipitation during the winter have increased during November and January, the increases in precipitation during these two months have been small relative to the increases experienced during December and February (Figure 7). Therefore, on a seasonal basis, precipitation during the winter has increased and in recent years has been more likely to fall as rain rather than snow, which can impact water supplies for the summer season (Carson, 1998).
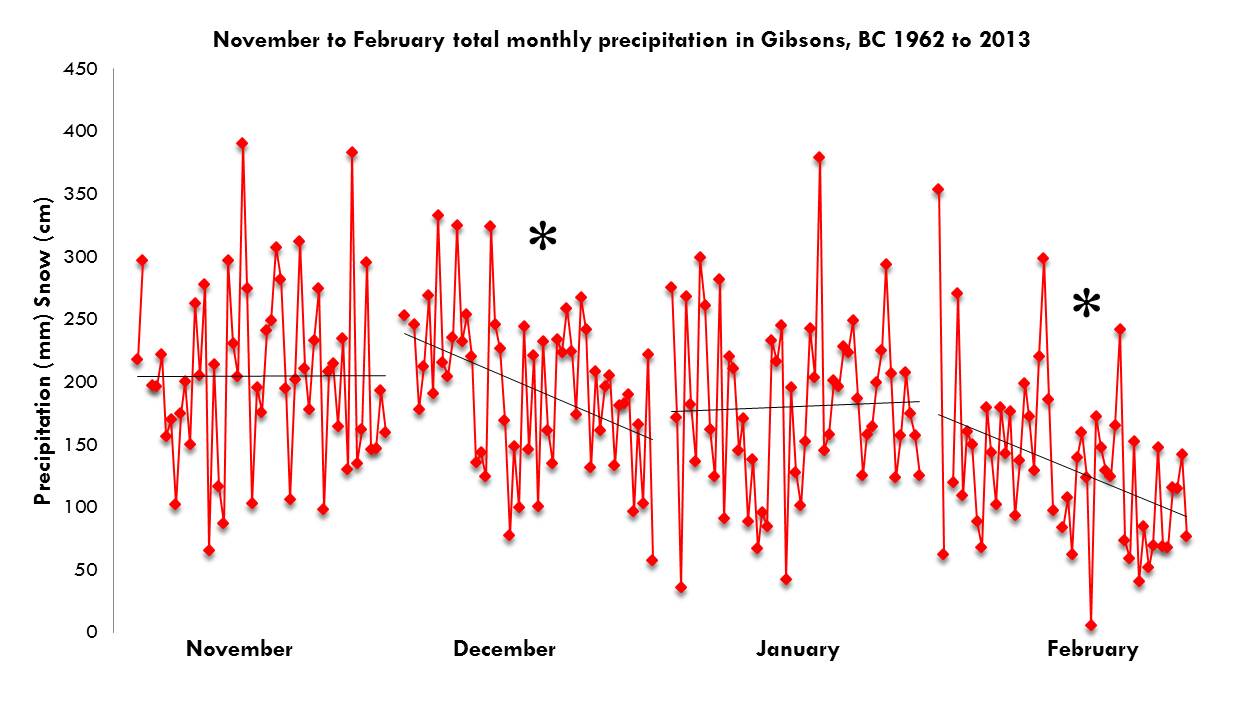
Figure 7: Historic monthly total monthly precipitation for November to February collected at the Gibsons Gower Point climate station, BC from 1962 to 2013 – Significant trends (denoted by *) include: February (Mann Kendall, p=0.046) and December (Mann Kendall, p=0.01)
This transition from precipitation falling as rain rather than snow is illustrated in Figure 8, which shows lower frequencies of snowfall and higher winter temperatures in Gibsons over the Last decade (2004 to 2013), compared to the previous 4 decades (1962 to 2003). It is recognized that the climate experienced at the elevations of the Gibsons climate stations (<34 m) do not accurately represent the climate experienced at higher elevations; however, due to the significance in some of the historic climate trends it is assumed that similar conditions have been experienced in the Chapman watershed and the average annual snowpack in this watershed has decreased since 1962.
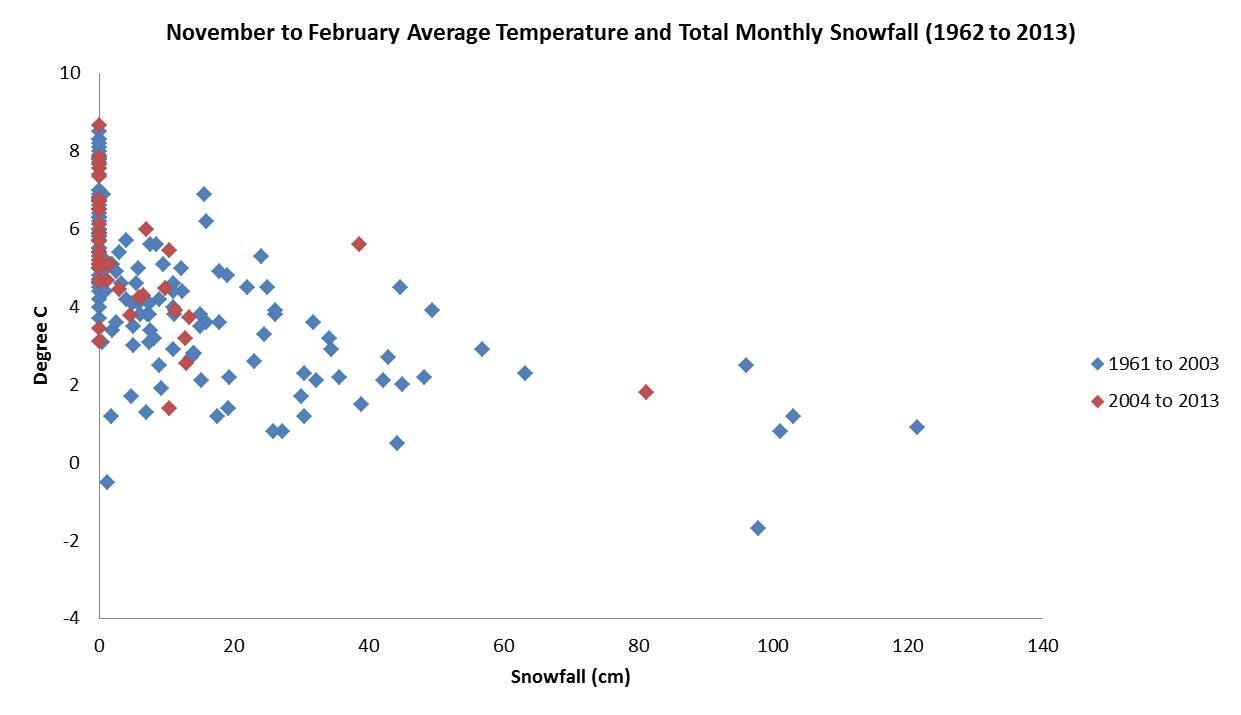
Figure 8: Average temperature and snowfall data collected at the Gibsons Gower Point/Gibsons climate stations showing trends in the last 10 years and the previous 42 years for November to February 1962 to 2013
Monthly maximum, minimum and mean temperatures have increased for all months during the summer season between 1962 and 2013; however, the only significant increases occurred for minimum and mean temperatures (Figure 9). Although all of the summer months experienced a decrease in precipitation, the only significant decrease occurred in August as precipitation during this month decreased by nearly 40 mm (Mann-Kendall, p = 0.034) (Figure 10). Despite this, the decreases in July and September precipitation were still notable with July experiencing a 33 mm decrease (Mann-Kendall, p = 0.087) and September decreasing by 37 mm (Mann-Kendall, p = 0.11).
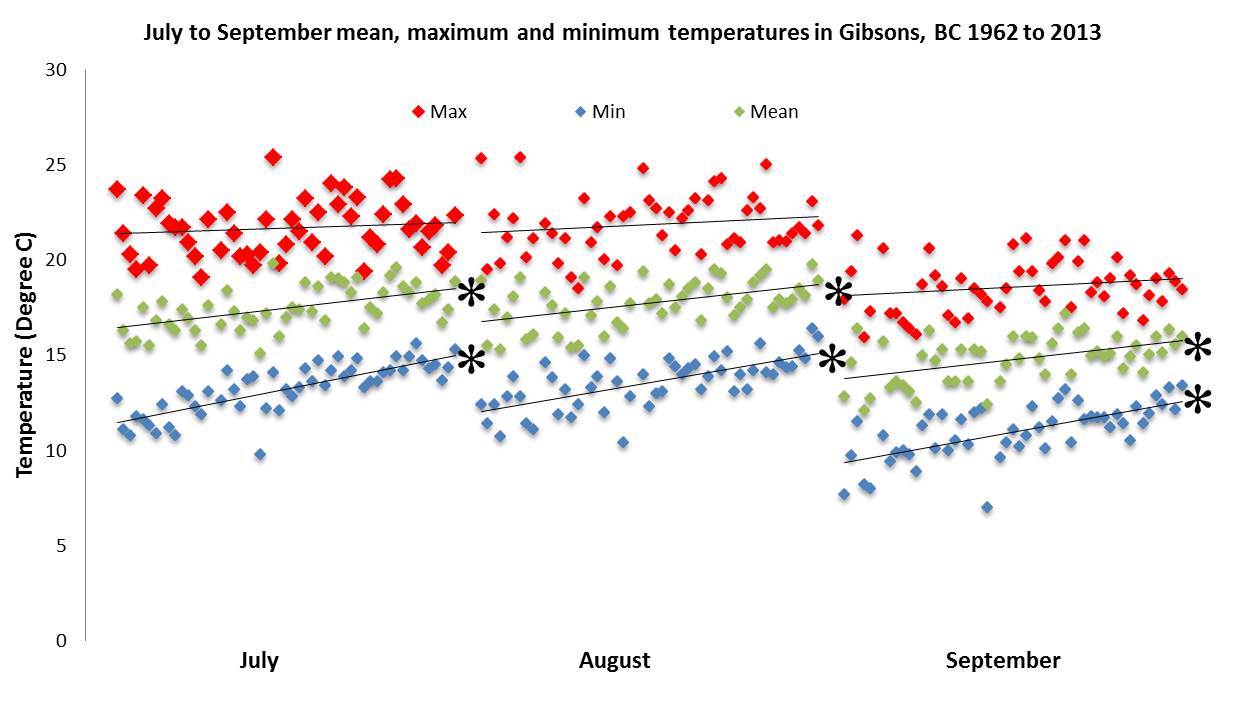
Figure 9: Historic monthly mean, maximum and minimum temperatures for July to September collected in Gibsons, BC from 1962 to 2013 – Significant trends (denoted by * on right hand side of trendline) include: minimum temperature for July (Mann Kendall, p=2.22×10165), August (Mann Kendall, p=3.58×10⁻⁷), and September (Mann Kendall, p=4.8×10⁻⁷), and mean temperatures for July (Mann Kendall, p=5.5×10⁻¹), August (Mann Kendall, p=1.2×10⁻⁴), and September (Mann Kendall, p=2.3×10⁻³)
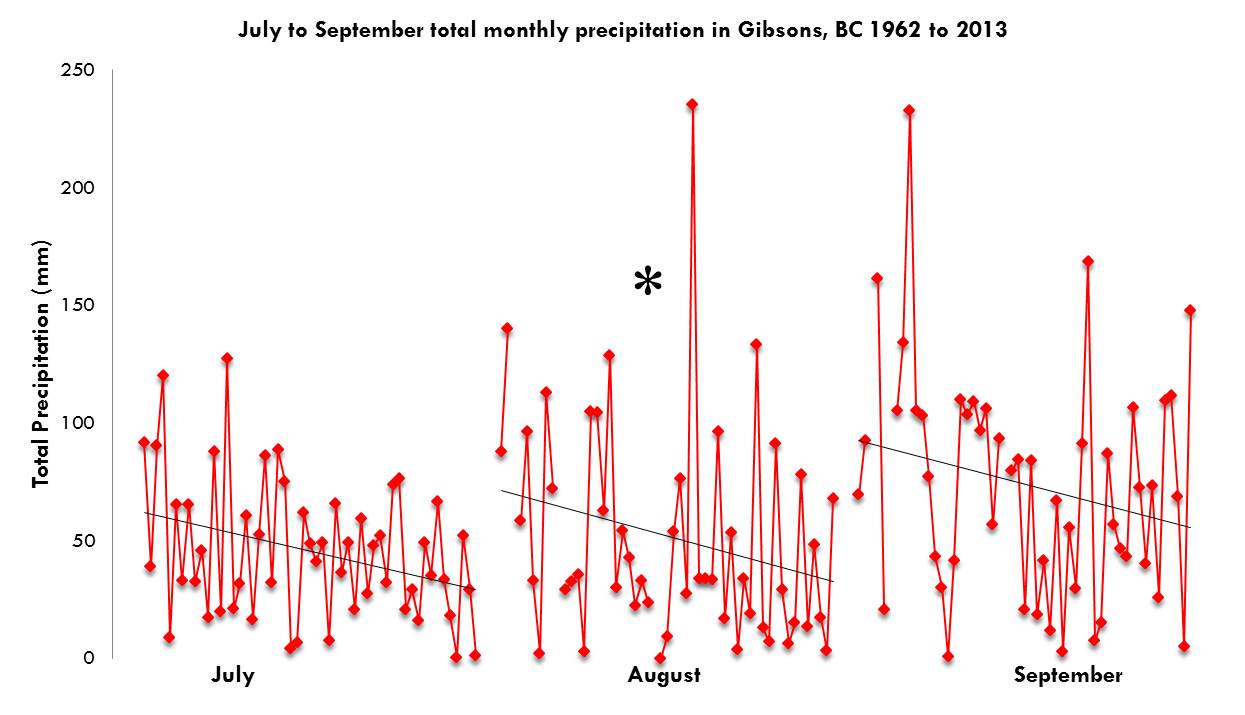
Figure 10: Historic monthly total monthly precipitation for July to October collected in Gibsons, BC from 1962 to 2013 – Significant trends (denoted by *) include: August (Mann Kendall, p=0.034)
Climate in relation to Pacific Decadal Oscillations and El Nino Southern Oscillations
Temperatures were consistently higher during warm PDO and lower during the cool PDO for all seasons in Gibsons between 1962 and 1998. The coldest average monthly temperatures were experienced during January (1.3 °C ± 1.72 °C) during cool PDO/El Nino and were highest for July (18.3 °C ± 0.82 °C) during warm PDO/La Nina. Warm PDO/La Nina showed to have the highest and lowest total monthly precipitation out of all PDO/ENSO periods, with November experiencing an average of 263 mm (± 44 mm) and July experiencing an average of 37 mm (± 20 mm). The highest annual average total precipitation occurred during cool PDO in phase with El Nino (1518 mm) and the lowest occurred during warm PDO in phase with El Nino (1381 mm) (Figure 11). Average winter precipitation was highest during warm PDO in phase with La Nina (766 mm) and lowest during warm PDO in phase with El Nino (706 mm). Average summer precipitation was highest during cool PDO in phase with El Nino (233 mm) and lowest during warm PDO in phase with La Nina (144 mm). Significant differences between average monthly temperatures during different PDO/ENSO events are provided in Table 8. For monthly precipitation, the only significant difference among PDO/ENSO events occurred in May between Cool PDO in phase with El Nino and Warm PDO in phase with La Nina (Wilcox, α = 6.99 x 10⁻³)
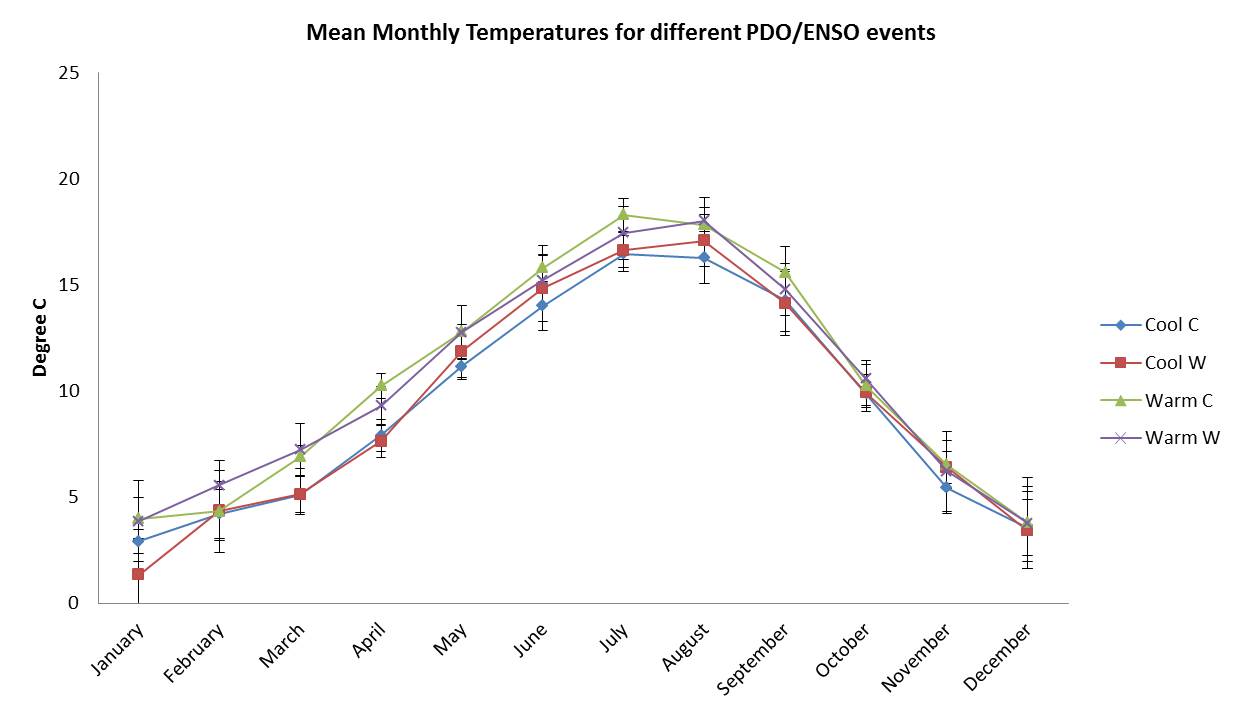
Figure 11: Mean monthly temperature data collected at Gibsons, BC, for defined PDO/ENSO periodsbetween 1962 and 2013 (PDO is indicated as Cool or Warm and ENSO is indicated as W (El Nino) or C (La Nina))
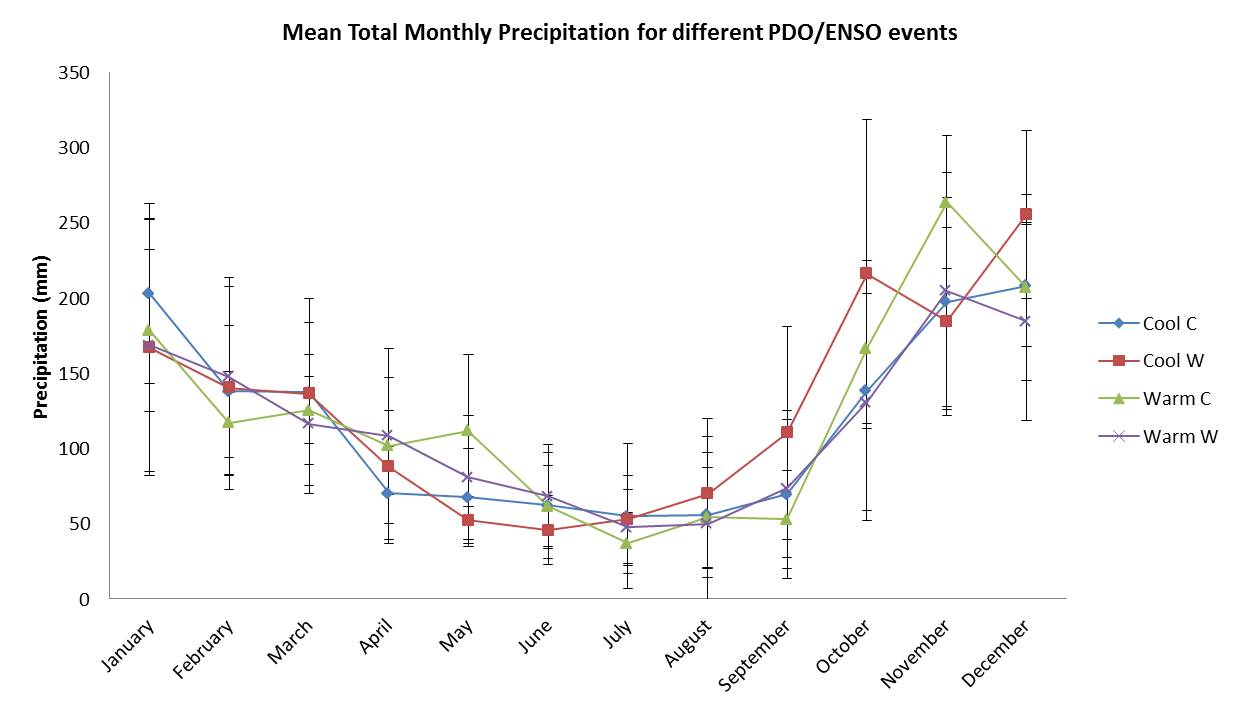
Figure 12: Mean monthly total precipitation data collected at Gibsons, BC, for defined PDO/ENSO periodsbetween 1962 and 2013 (PDO is indicated as Cool or Warm and ENSO is indicated as W (El Nino) or C (La Nina))