Summary of Key Findings
– Evidence that spring peak flows are occurring earlier on Chapman Creek
– Lower base flows in recent decades on Chapman Creek indicates that there is less water for the environment (fish)
– The annual hydrograph is impacted by Pacific Decadal Oscillations (PDO) and El Nino Southern Oscillations (ENSO), especially when warm PDO is in phase with El Nino, which results in earlier peak flows and lower early summer base flows
– The earlier spring peak flows indicate that the warming temperatures are causing the snowpack to melt earlier in the year, which suggests that water availability for the summer is decreasing
– The existing hybrid stream flow regime in Chapman Creek (characterized by both a winter and spring freshet) is showing signs of shifting to a more rain dominated regime (characterized by a single winter freshet) from increasing temperatures and decreasing precipitation
Annual Hydrograph for Chapman Creek
The streamflow regime in Chapman Creek is defined as a hybrid regime, which is characterized by a winter freshet influenced by winter rain and a spring freshet influenced by spring snowmelt (Pike et al., 2010) (Figure 13). Annual discharge patterns in Chapman Creek can act as an indicator for water supply for the Chapman water system based on the timing and magnitude annual flows, which is especially true for spring freshet (Pike et al., 2010). When the timing of spring freshet occurs earlier in the season, it means that the winter snowpack is melting earlier and more rapidly, which further indicates that the available water supply in the watershed will be consumed earlier than under normal conditions.
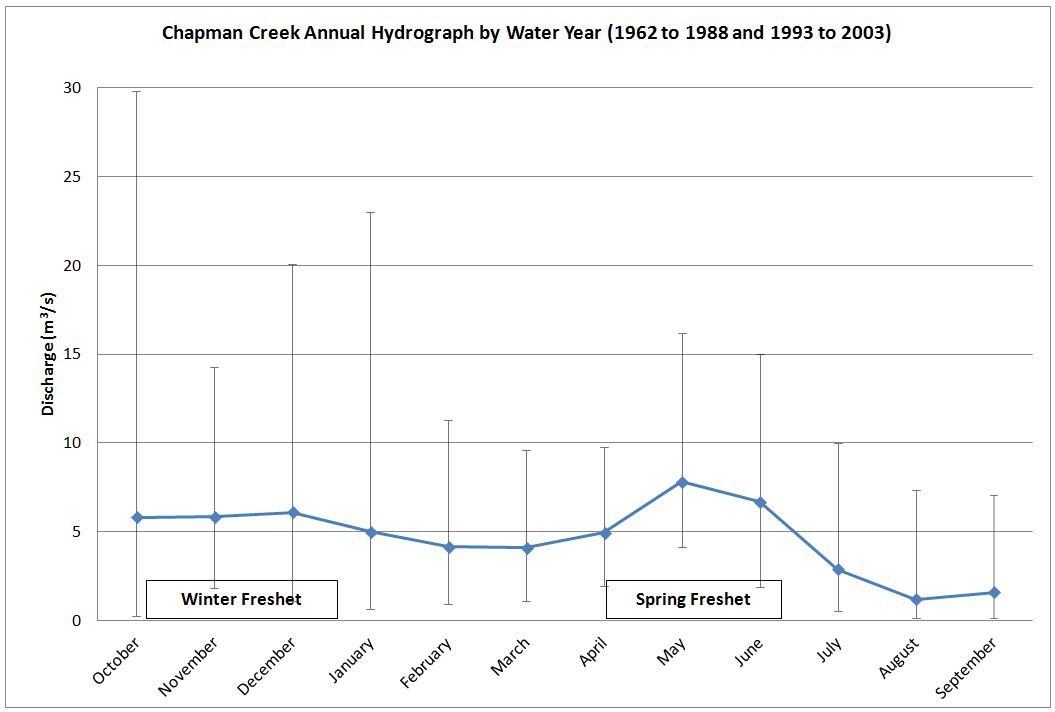
Figure 13: Average annual hydrograph (with maximum and minimum flows) showing a hybrid streamflow regime characterized by winter freshet and spring freshet for the water year (October to September) for Chapman Creek, BC, from 1962 to 1988 and 1993 to 2003
Comparison of Chapman Creek and the Capilano River
Historic discharge in Chapman Creek was significantly correlated to discharge (Spearman Rank, p= 1.35 x 10-173) in the Capilano River (Figure 14), which also maintains a hybrid streamflow regime, and is demonstrated in the annual hydrographs below. These results suggest that the two river systems have experienced similar trends in discharge and provide confidence that discharge data from Chapman Creek can be analyzed and used as an indicator of available supply.
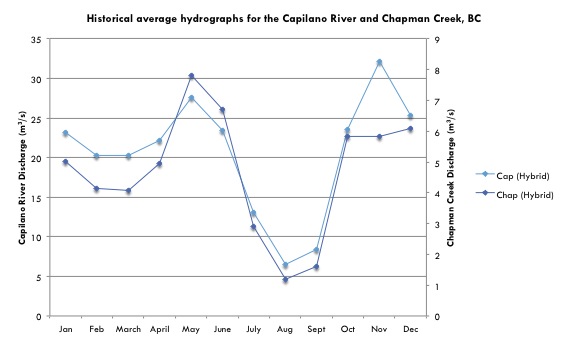
Figure 14: Annual hydrographs for Chapman Creek and the Capilano River, BC showing the similarity of annual discharge patterns
Spring Discharge
The average annual spring peak flow in Chapman Creek typically occurs between April and June. Between 1962 and 1998 and 1993 and 2003, historic discharge trends during the spring months have significantly increased in April (Mann-Kendall, p = 4.2 x 10⁻³) and significantly decreased in June (Mann-Kendall, p = 0.02) (Figure 15).
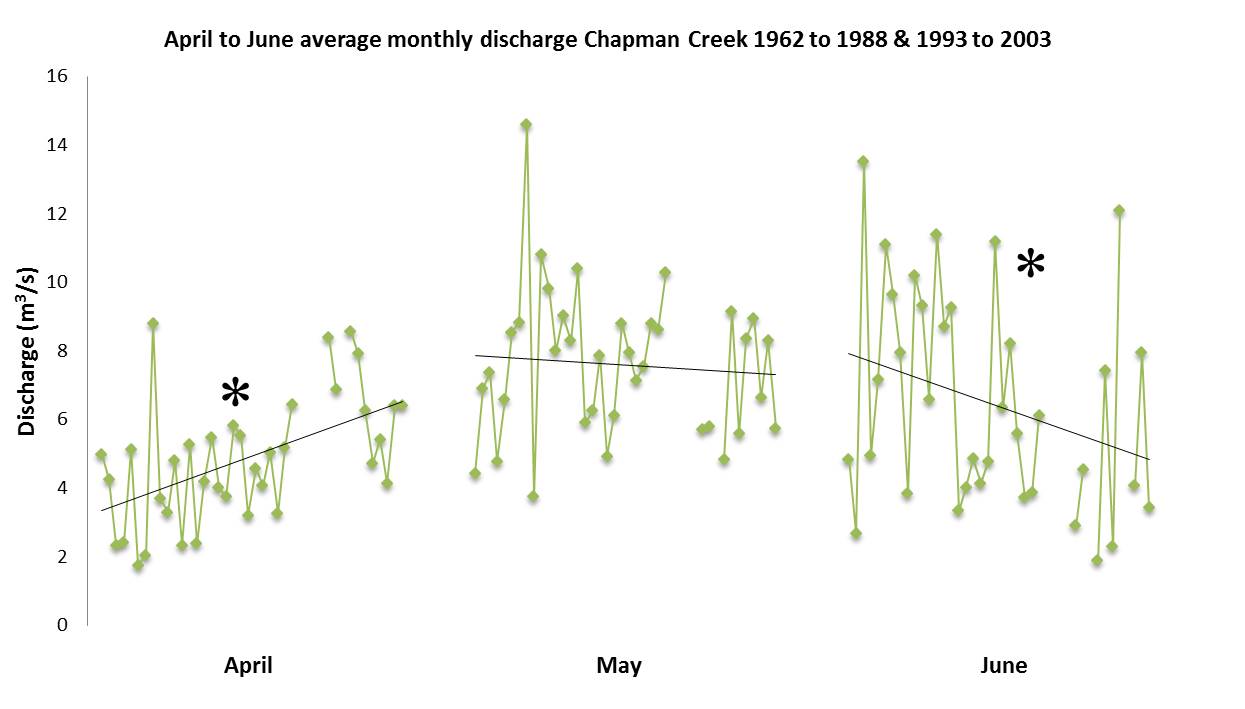
Figure 15: Historic mean monthly discharge for April to June in Chapman Creek, BC from 1962 to 1988 and 1993 to 2003 – Significant trends (denoted by *) include: April (Mann Kendall, p=4.2×10⁻³) and June (Mann Kendall, p=0.02)
Hydrograph by Decade
When examining average annual discharge by decade, there appears to have been a shift in the timing and magnitude of spring peak flows between the 1960’s and 1990’s (Figure 16). In the 1960’s, peak flows occurred in either May or June at relatively the same magnitude. During the 1970’s and 1980’s, spring peak flows appeared to shift from May and June to only May. Then in the 1990’s, the spring peak flows appear to be continuing to shift towards occurring earlier in the season during April and May with lower peak flow in May than in other decades.
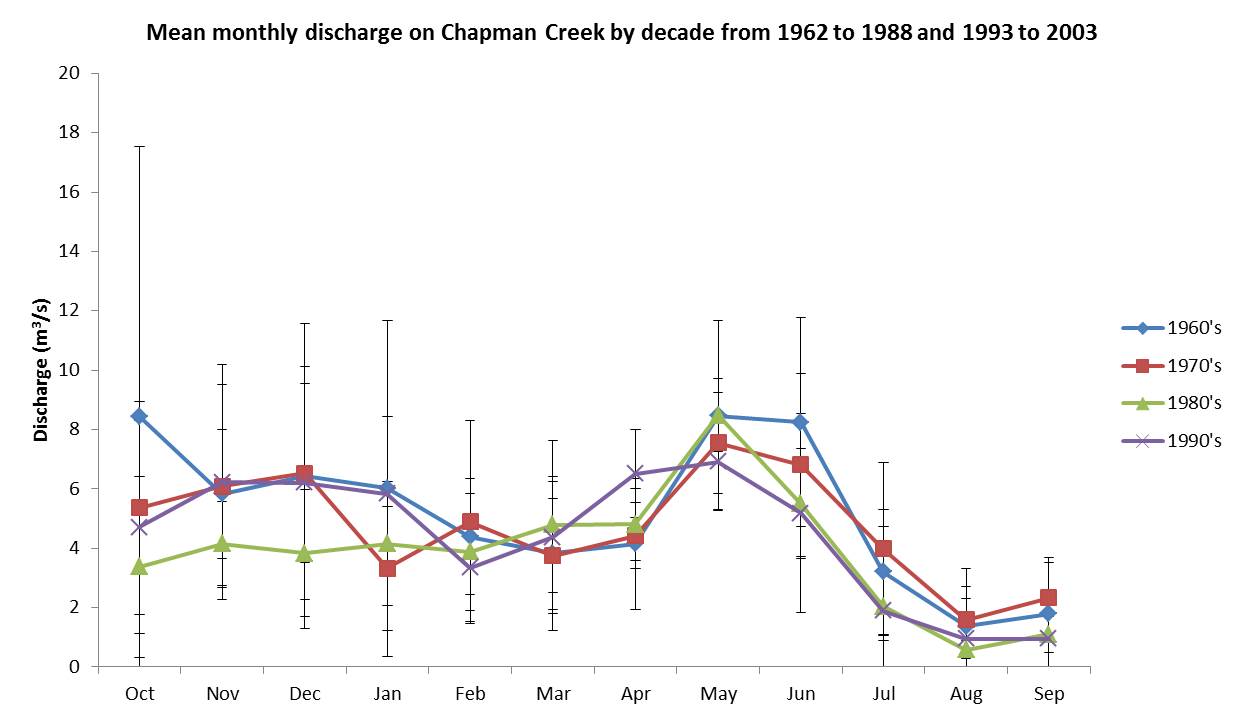
Figure 16: Mean monthly discharge with standard deviation bars (standard deviation ±) on Chapman Creek, BC, by decade between 1962 and 2003 – the 1960’s include 1962 to 1973 (n=12), the 1970’s include 1974 to 1983 (n=10), the 1980’s include 1984 to 1988 (n=5), and the 1990’s include 1993 to 2003 (n=11)
Discharge during Pacific Decadal Oscillation and El Nino Southern Oscillation Events
In regards to how streamflow in Chapman Creek is impacted by PDO and ENSO, the results showed that warm PDO years had higher than average winter flows and lower than average spring and summer flows and cool PDO years showed the opposite. Cool PDO/LA Nina years were the most consistent for low winter flows and high spring/summer flows. In the figure below, the results show that warm PDO periods tend to experience earlier and lower magnitude peak flows. The only significant difference in mean monthly discharge during different PDO and ENSO events occurred in June between warm PDO in phase with El Nino and cool PDO in phase with La Nina (Wilcox, α = 0.0082). This suggests a warm PDO in phase with El Nino will result in earlier peak flows then years during cool PDO in phase with La Nina.
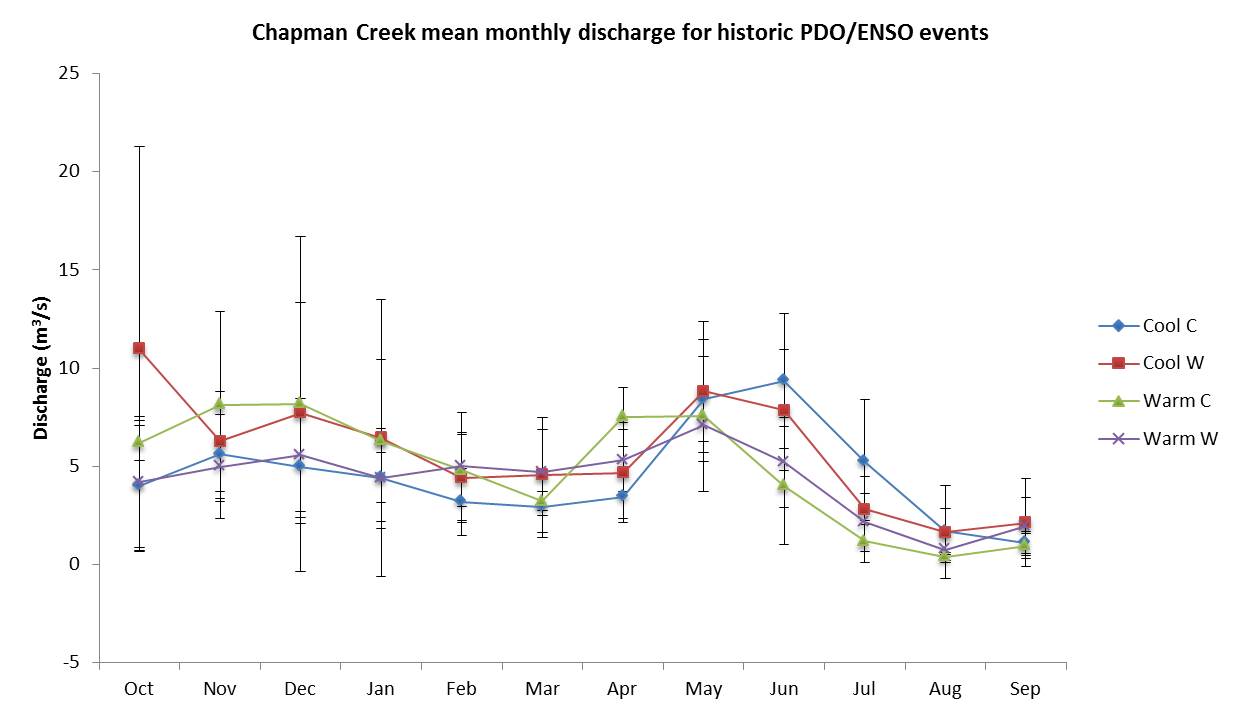
Figure 17: Mean monthly discharge on Chapman Creek for defined PDO/ENSO periods. Streamflow data were grouped by PDO events in phase with ENSO events and is not in chronological order. (PDO is indicated as Cool or Warm and ENSO is indicated as W (El Nino) or C (La Nina))