All posts by tatum lawlor

Smelly Maps

I found myself in a bit of a smell-mapping wormhole after listening to Act Three of episode 110: Mapping of This American Life (I live in Hastings-Sunrise, so am subject to the putrid smell of the West Coast Reduction on north-west windy days.) In doing so I stumbled upon the work of Kate McLean, “an artist and designer, creator of smellmaps of cities around the world.” McLean’s full portfolio of work is available HERE.

“Smell remains an under-valued and under-researched sense which possesses the capacity to induce time-travel and momentary location-displacement, translating anonymous space into personalised place.” – McLean, K (2013) PhD Abstract Version 3

Related Resources:

Lee, Vivian. 2014. “Data for a New York ‘Smellmap’ Collected Sniff by Sniff” New York Times. https://www.nytimes.com/2014/09/12/nyregion/the-data-for-a-map-collected-sniff-by-sniff.html?_r=1

Young, Molly. 2011. “The Smelliest Block in New York.” New York Magazine. http://nymag.com/guides/summer/2011/smelliest-block/

McLean, Kate. Daniele Quercia, Rossano Schifanella and Luca Maria Aiello. 2015.  “Smelly Maps: The Digital Life of Urban Smellscapes” In Proc. of the 9th International AAAI Conference on Web and Social Media (ICWSM).

Daniele Quercia, Luca Maria Aiello, Rossano Schifanella. 2016. “The Emotional and Chromatic Layers of Urban Smells” In Proc. of the 10th International AAAI Conference on Web and Social Media (ICWSM).

Good City Life. Smelly Maps. http://goodcitylife.org/index.html

Enlarge

NYC_Greenwich_Block_lores_Smellmap_©KateMcLean2014
NYC Thresholds of Smell: Greenwich Village

Enlarge

smell_amsterdam
Smellmap: Amsterdam

Enlarge

Smellmap_20150219_©A_Licata0071
Smellscape Mapping: Marseille

Aris Venetikidis: Making sense of maps – TED TALK


“Map designer Aris Venetikidis is fascinated by the maps we draw in our minds as we move around a city — less like street maps, more like schematics or wiring diagrams, abstract images of relationships between places. How can we learn from these mental maps to make better real ones? As a test case, he remakes the notorious Dublin bus map. (Filmed at TEDxDublin)” 

Village Voices: An Audio Walking Tour of the Cathedral Area

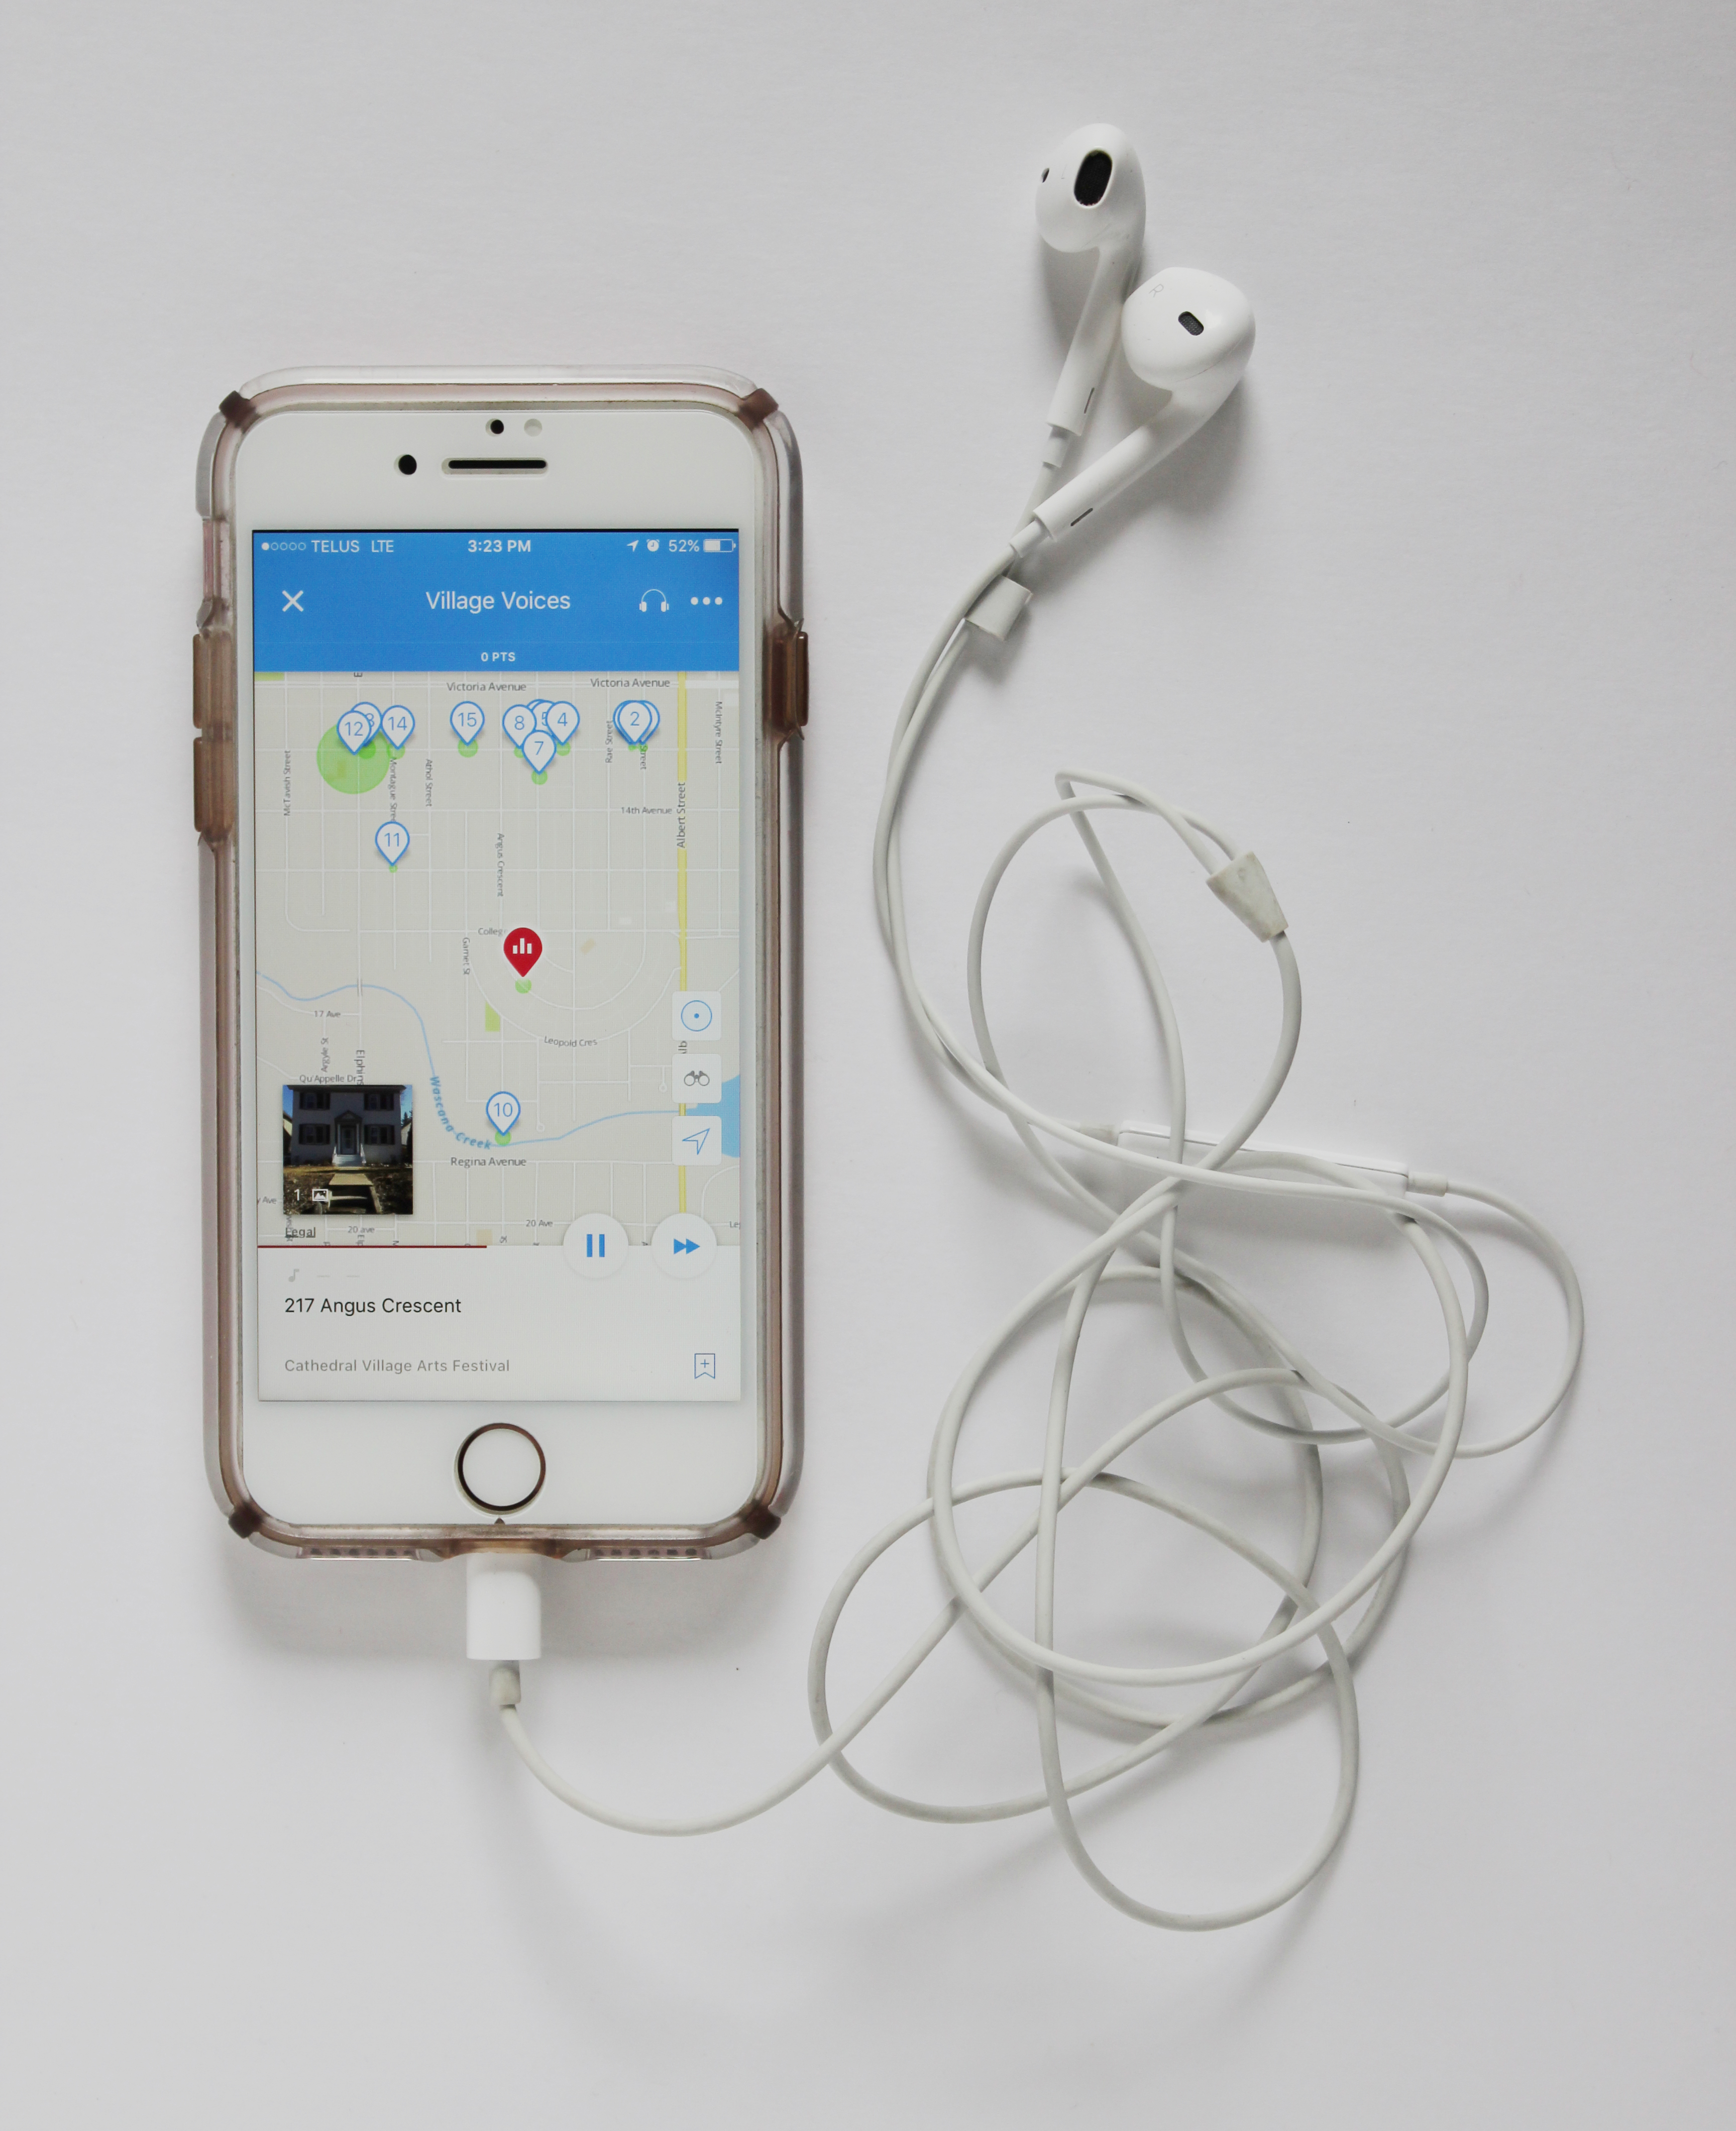
Evie Ruddy is a digital media artist, freelance journalist and creative writer, specializing in digital story telling. “Village Voices: An Audio Walking Tour of the Cathedral Area,” while evidently a form of digital story telling, is also a cybercartographic map. Cybercartography is defined as “The organization, presentation, analysis and communication of spatially referenced information on a wide range of topics of interest and use to society in an interactive, dynamic, multimedia and multi sensory format (Taylor, N.D., p.2).”

This interactive, GPS located and triggered audio map shares personal and collective histories through a multi-media multi-sensory experience, facilitated through a smart phone audio guide application called izi.TRAVEL. This map prioritizes spatially located qualitative information over the creation of a graphic artifact. Its significance lies in its content, its utility, and its focus of performance and narrative.

When it comes to learning about our environments in all capacities this fully immersive and ’bottom-up’ method of communicating location-based information is very meaningful. It triggers emotional responses to location based information

One of the short fallings of this map is it its reliance access to smart phone technology. Only those privileged with the ability to spend 100$+/mo on a phone plan have access to the full, 1:1 audio map experience. This platform also relies heavily on the use of Google Maps imagery, appropriating the issues that come along side it.