Characterizing multi-decadal land dynamics of the Vancouver urban area using a novel urban greenness score
Agatha Czekajlo (a.czekajlo@alumni.ubc.ca)ᵃ, Nicholas C. Coops ᵃ, Michael A. Wulder ᵇ, Txomin Hermosilla ᵇ, Yuhao Lu ᶜ, Joanne C. White ᵇ, Matilda van den Bosch ᵈ ᵉ
ᵃ The Department of Forest Resources Management, University of British Columbia, 2424 Main Mall, Vancouver, BC V6T 1Z4, Canada
ᵇ Canadian Forest Service, Pacific Forestry Center, Natural Resources Canada, 506 West Burnside Road, Victoria, BC V8Z 1M5, Canada
ᶜ School of Architecture and Landscape Architecture, University of British Columbia, 2260 West Mall, Vancouver, BC V6T 1Z4, Canada
ᵈ School of Population and Public Health, The University of British Columbia, 2206 East Mall, Vancouver, BC, V6T 1Z3, Canada
ᵉ The Department of Forest and Conservation Sciences, The University of British Columbia, 2424 Main Mall, Vancouver, BC, V6T 1Z4, Canada
Presentation for the 41st Canadian Remote Sensing Symposium (CRSS-SCT) – July 13-16ᵗʰ, 2020 (Online)
Hosted by the Canadian Remote Sensing Society – https://crss-sct.ca/conferences/csrs-2020
Here I provide a summary of my CRSS-SCT 2020 presentation, which is based on data and methods published in Czekajlo et al. (2020). The data used for this analysis and the original paper, which includes 18+ Canadian cities, is #openaccess and downloadable from Canada’s National Forest Information System.
Background
Over the past quarter century major Canadian cities have experienced a remarkable growth in population, which has spurred an increase in urban development through densification and sprawl. For example, a recent report by Statistics Canada (2016) has identified a substantial increase of the Vancouver metropolitan area since the 1970s, increasing by over 500 sq-km as the population doubled. As a result of continued city development, urban trees and other vegetation, which provide essential ecosystem services such as shade, water retention, and air purification, have experienced changes as well. To mitigate potential negative impacts on urban greenness, and promote sustainable development, urban planners need spatially explicit and accessible information about the current status of urban greenness as well as its recent changes.
Purpose
Characterize Vancouver’s current greenness status and its recent change with a novel urban greenness score metric using Landsat satellite imagery and remote sensing techniques.
Study area
Vancouver (BC, Canada) urban area, delineated using the Vancouver census metropolitan area and adjoining dissemination areas (DAs) as per the 2016 Canadian census. DAs were grouped into 3 population density tertiles: low, moderate, and high. DAs that were dominated by water or agriculture, or without population density data, were excluded using land cover data from Hermosilla et al. (2018).

Vancouver study area, with census dissemination areas (DAs) grouped by 2016 population density (low, moderate, or high).
Data
Landsat satellite imagery from 1984-2016 was acquired during the growing season (August 1ˢᵗ ± 30 days) and with < 70% cloud cover. Annual cloud-free composites were created using the Composite-to-Change (C2C; Hermosilla et al. 2016) best-available pixel algorithm (BAP; White et al. 2014). The C2C BAP algorithm identifies the highest quality pixel from available imagery of a given year to create a single annual cloudless composite.
Select time steps of cloud-less Landsat composites for the Vancouver urban area developed using the Composite-to-Change Best-Available-Pixel (BAP) algorithm.
Methods
Following the methods by Czekajlo et al. (2020) and Lu, Coops, and Hermosilla (2017), the relative spectral purity of vegetation greenness (as well as high albedo and darkness) was quantified using the variance attributed to the three leading minimal noise fraction components from all 33 annual cloud-free image composites of the Vancouver urban area. The vegetative greenness fractions were smoothed temporally using locally weighted scatterplot smoothing (LOESS) to minimize intra-seasonal variation.
Select time steps of vegetative greenness fractions for the Vancouver urban area.
To quantify the multi-decadal change in greenness, all 33 years of vegetative greenness fractions were used to calculate the Theil-Sen estimator on the DA level. A negative change, no change, and positive change in greenness were identified using 1 unit of standard deviation (as shown in panel A of the figure below). The spectrally unmixed vegetative greenness fraction for the final year (2016) was extracted from the 33-year time series and summarized by mean on the DA level, and then categorized into low, moderate, and high levels of greenness using natural breaks (as shown in panel B of the figure below). The final greenness fraction in 2016 shows the current status of urban greenness, but integrating the greenness change provides a historical context, that can help differentiate areas with the same present-day greenness level but with varying past experiences. These differences are identified in panel C of the figure below, which shows the temporal trajectory of several example DAs that are identified in both panels A and B that have different changes in greenness but can result in the same final greenness level.
The three types of greenness change (negative (–), no change (0), and positive (+)) as well as the three final greenness level (low, moderate, and high) were combined to create a 3 x 3 matrix that is the urban greenness score. Using this accessible framework, urban planners, academics, and citizens can identify the current greenness of an area and relate it to its recent historic trajectory to show how an area became the way it is based on its vegetative greenness.
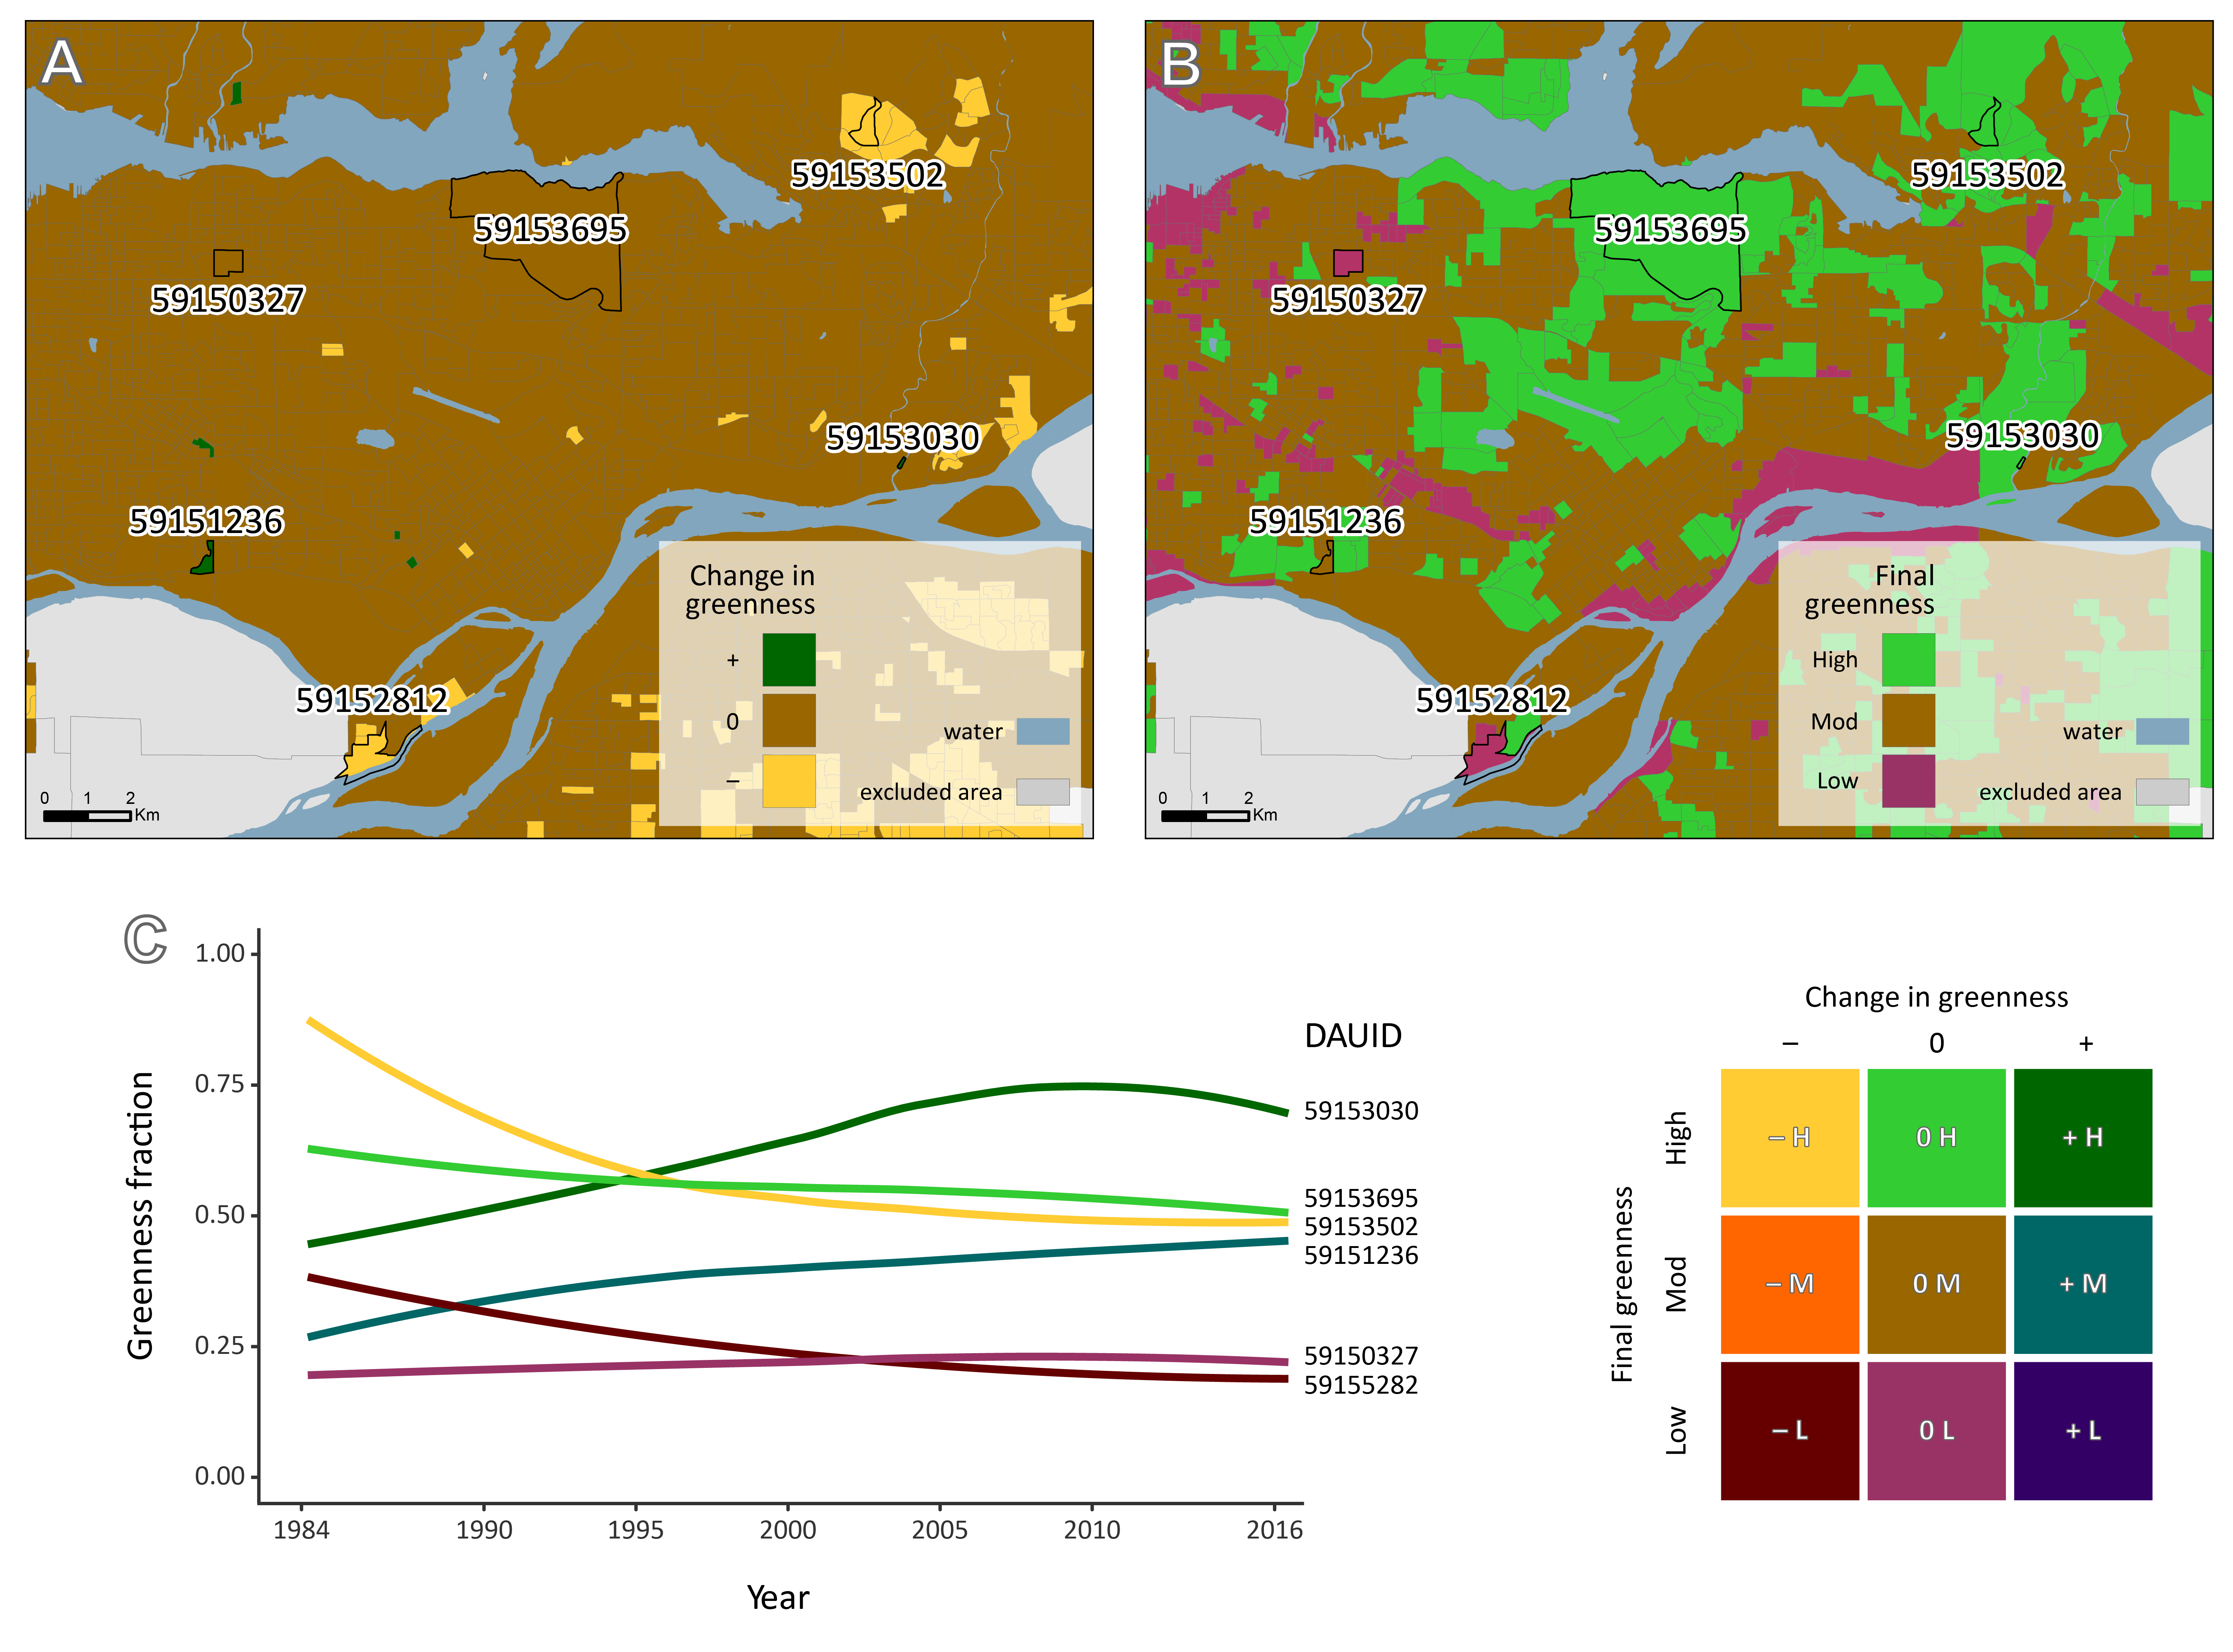
Maps and time series showing the temporal evolution of greenness on the DA level. Panel A shows change in greenness (negative (–), no change (0), and positive (+)), while panel B shows the final (2016) greenness (low, moderate, and high). Panel C shows the temporal trajectory of select DAs identified in panels A and B, colour coded using the 3 x 3 matrix (i.e. urban greenness score) that combines change in greenness and final greenness variables.
Results
Overall, the Vancouver urban area remained relatively green throughout the 33-year time series, from 1984 to 2016. However, hotspots of greenness loss were identified in the periphery of the Vancouver urban area. This pattern can be seen on the map below as colours of red, orange and yellow, signifying a negative change in greenness and various final greenness levels. But despite this greenness loss, most developed areas in Vancouver had a moderate or high level of greenness in 2016 (final greenness), indicating that Vancouver is currently quite green.
Map of urban greenness score for DAs of the Vancouver urban area.
Although there was a greater regional loss in greenness (~ 14%) than gain (just < 1%), most DAs sustained a moderate level of greenness during the time series. Moderately dense areas observed the greatest overall greenness loss (~19%), whereas ~ 10% of DAs in both the low and high population density groups saw a greenness loss. Although a negative relationship was observed between the final greenness level in 2016 and population density of the same year, there was still ample variability in urban greenness score distributions between areas of different densities. This observation suggests that urban development patterns play a large role in influencing the availability of urban greenness.
Percentage of dissemination areas (DAs) classified by each urban greenness score for population density tertiles, as well as for all DAs, of the Vancouver urban area.
Implications
The application of the urban greenness score, such as for the Vancouver urban area, provides an enriched characterization of contemporary urban greenness and its multi-decadal trends. This framework provides a robust method for continued urban monitoring, which is key to long-term strategic planning, and can be applied across Canada or internationally as the data used at the basis of the urban greenness score are open and accessible Landsat satellite imagery. The urban greenness score is also accessible for future cross-disciplinary analysis, such as studying the potential influencers of urban greenness like policy, or the impacts of urban greenness on public health and social equity.

This work is licensed under a Creative Common Attribution-NonCommercial-NoDerivatives 4.0 International License.