My work in developing the novel urban greenness score can be found #openaccess here:
Czekajlo A, Coops NC, Wulder MA, Hermosilla T, Lu Y, White JC, van den Bosch M. 2020. The urban greenness score: A satellite-based metric for multi-decadal characterization of urban land dynamics. International Journal of Applied Earth Observations and Geoinformation, 93, 102210. https://doi.org/10.1016/j.jag.2020.102210.
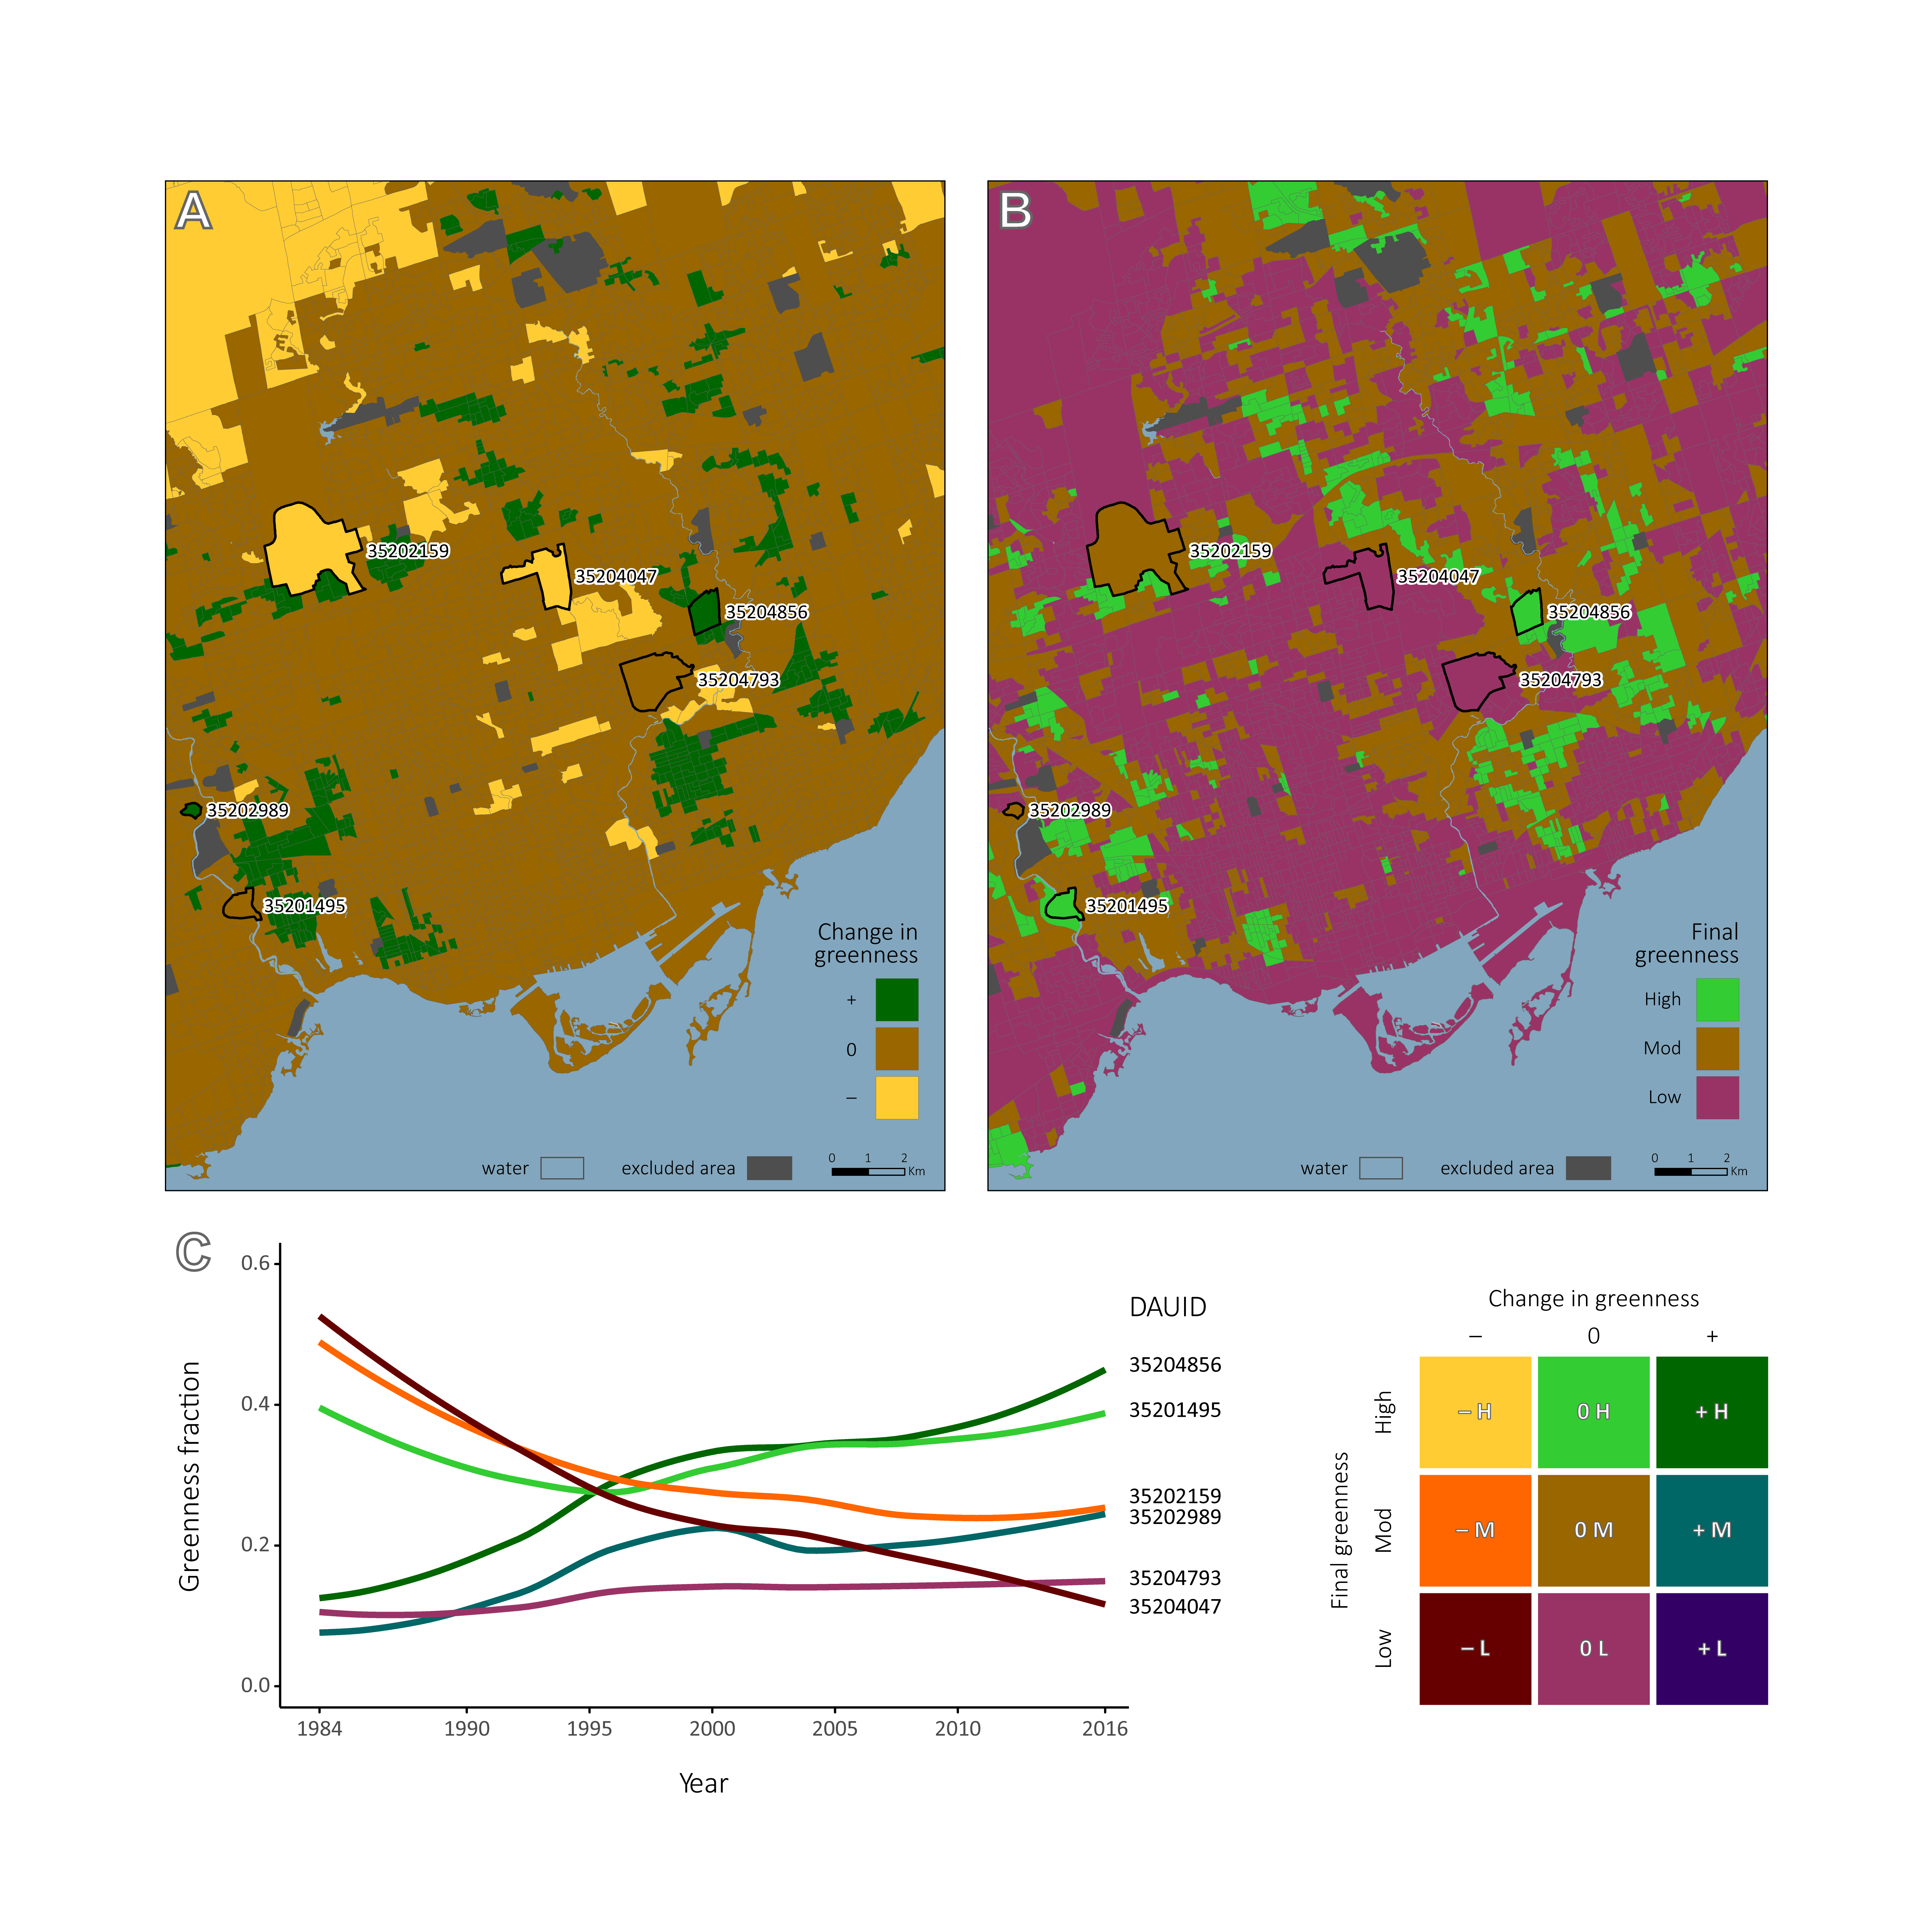
Maps of greenness change (A) and final greenness (B) for a portion of the Toronto urban area on the census dissemination area (DA) level. Graph showing time series of greenness fraction for select DAs (C) , identified using the Statistics Canada census unique DA identifier code (DAUID) and outlined in black on maps A and B of various urban greenness score as distinguished by colour (and shown by 3 x 3 matrix). Sourced from Czekajlo et al. (2020).
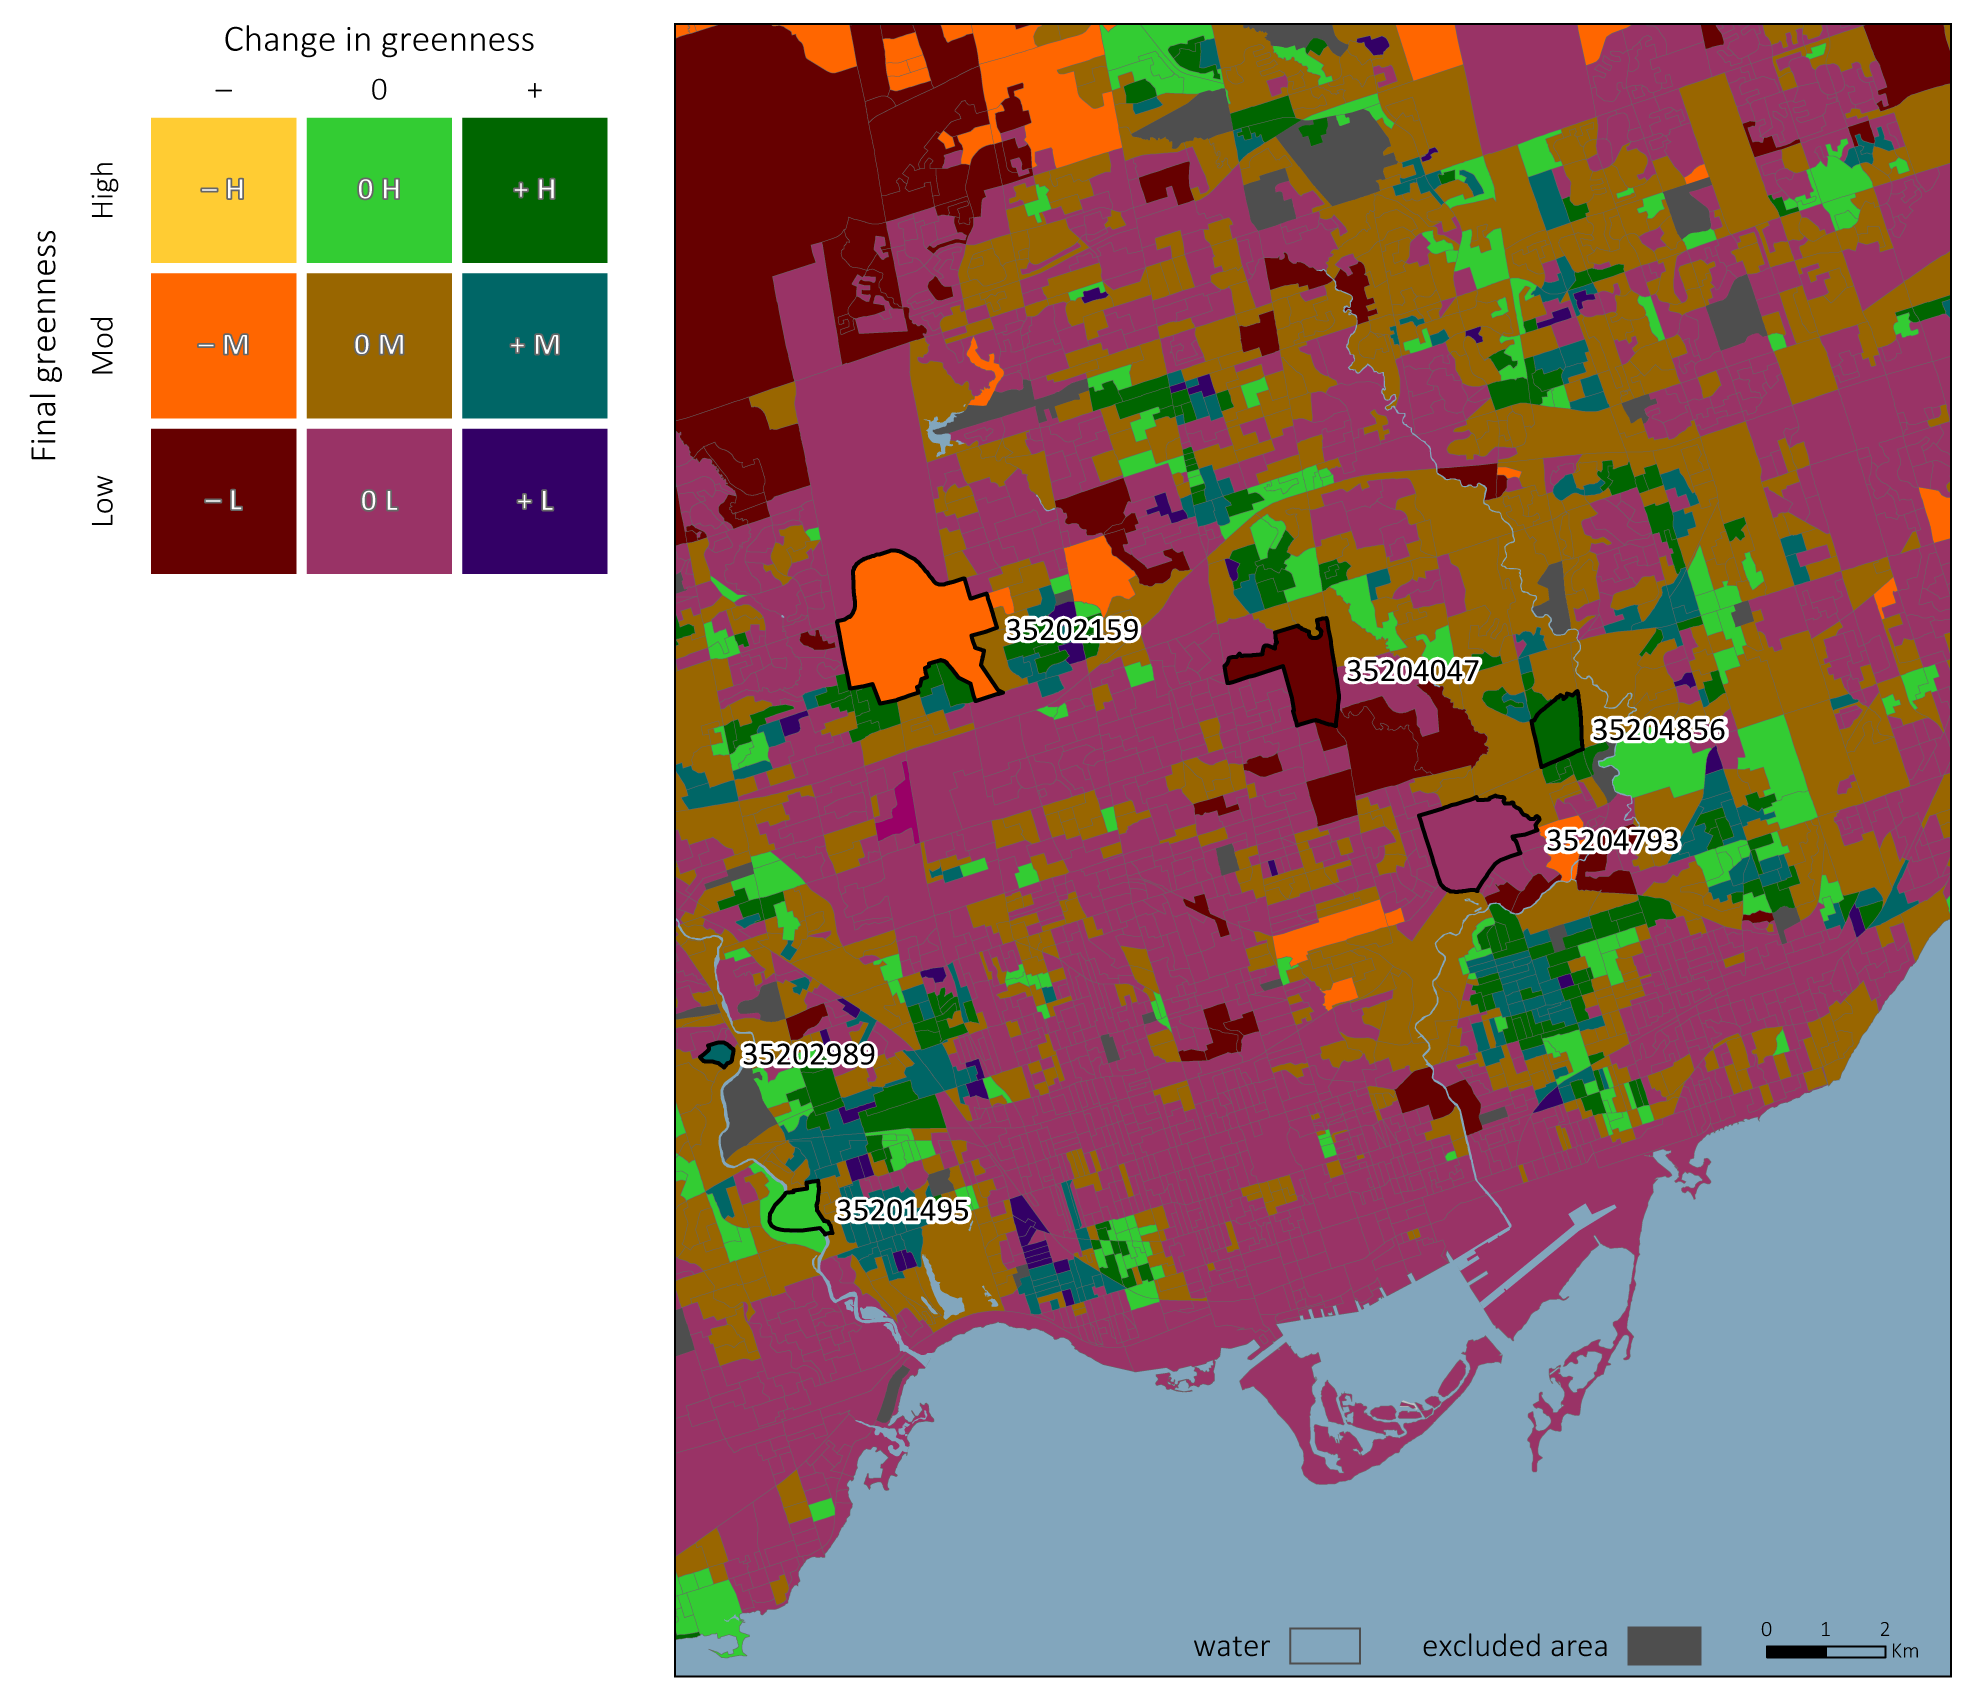
Maps of the urban greenness score, which combines the multi-decadal change in greenness and final (2016) greenness level for a portion of DAs in the Toronto urban area. Examples of each green score are identified by Statistics Canada census unique DA identifier code (DAUID) and outlined in black, linking to the previous figure. Sourced from Czekajlo et al. (2020).