In this lab, we looked at housing affordability using Canadian Census Data from 2011 and 2016 for Metro Vancouver. I classified data in a variety of ways to examine how different classification methods can be used to display the same dataset differently.
Quantitative Data Classification
In this map, four data classification methods are used and as shown on the map below, each produces a different map. The data classification method chosen when making a map like this will depend on what the map creator wants to convey. The standard deviation map shows areas that are more or less expensive than the mean. Using manual breaks allows the map creator to determine how the data is classified and is heavily influenced by the map creator’s goals. Equal interval classification breaks the data up evenly across the entire dataset. This classification method is not particularly useful when classifying data with extreme outliers like Metro Vancouver’s housing costs. The natural breaks classification method relies on an algorithm to classify the data. The classification method used when creating a map will vary with the purpose of the map but care should always be taken to ensure that the classification method presents the data as truthfully as possible.
[Click on any map to enlarge]
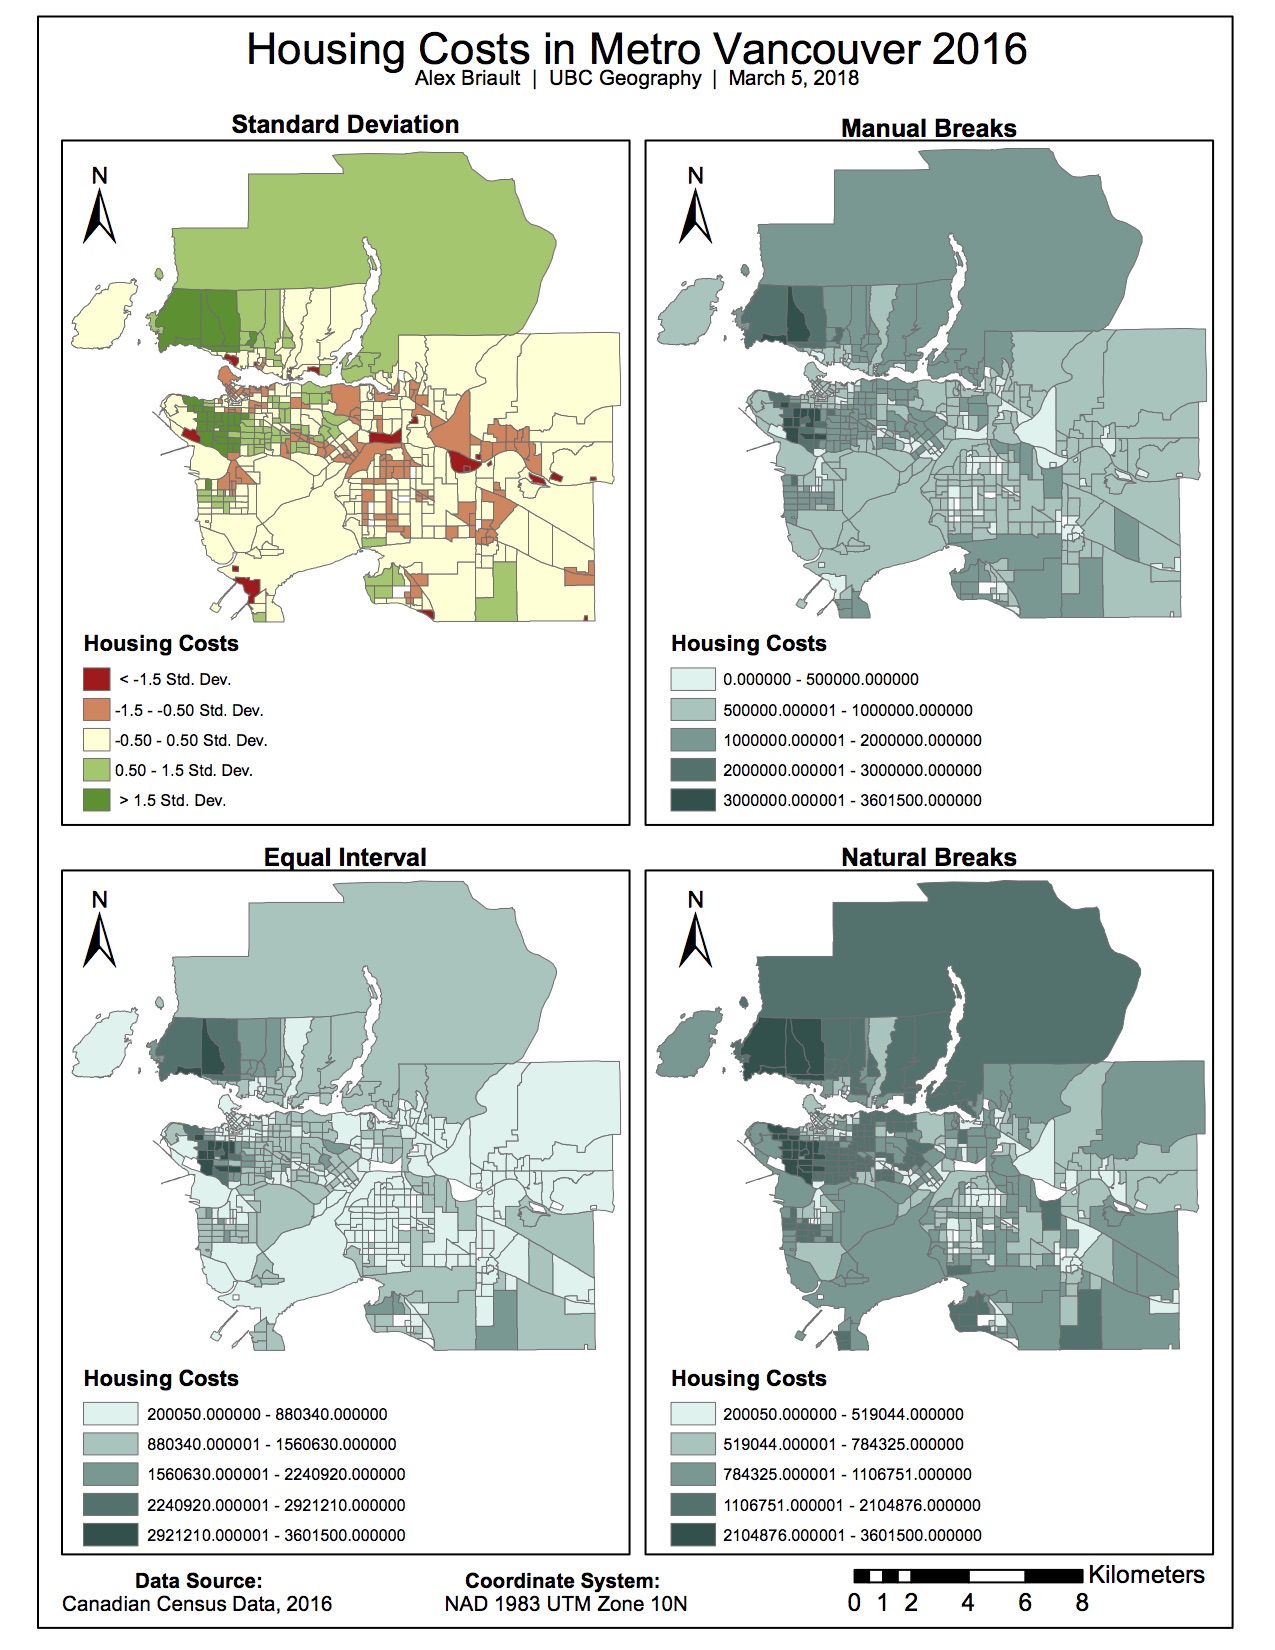
Map 1: Housing Costs in Metro Vancouver using four data classification methods.
Housing affordability
In this set of maps, housing costs in Metro Vancouver are compared between 2011 and 2016 using Canadian Census data. Because of Statistics Canada’s data suppression rules, using only census data results in some census tracts having no data because they number of respondents or population was less than 40. Another issue with using this data is that census tracts may include large uninhabited areas and the few houses within those tracts skew the data. This is visible in the census tracts extending into the North Shore Mountains and in Stanley Park.
Shelter cost is simply the value of a home if it were to be sold. It does not account for affordability of housing based on income levels. Using only the variable of ‘shelter cost’ and then comparing costs across census years does not show if housing became more or less affordable because income data is missing.
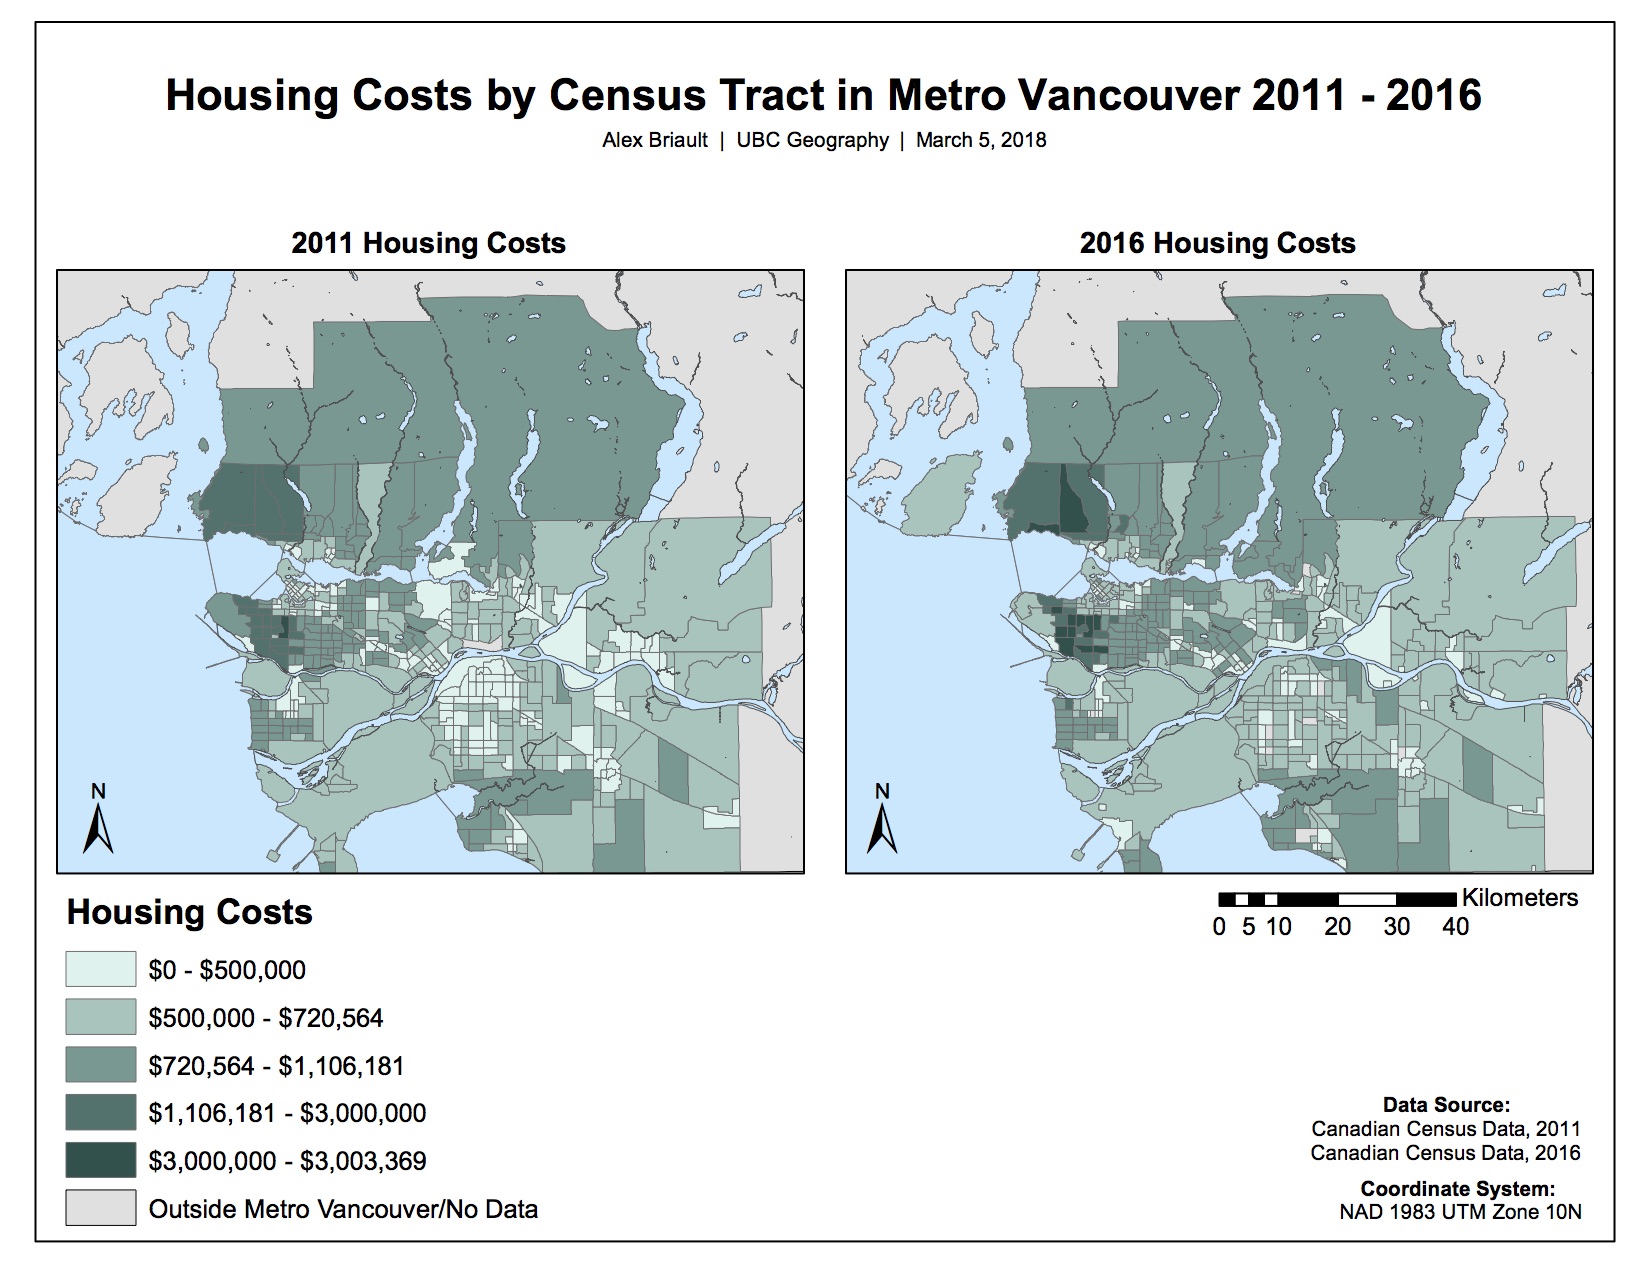
Map 2: Comparing housing costs by census tract in Metro Vancouver