Although a large proportion of the world’s population live in large cities, in Canada, 40% of the population live in mid-sized cities (50,000 to 550,000 people) [1]. Mid-sized cities often face different challenges when it comes to sustainable transportation compared to large cities, but are important to focus on as well.
Community members living in mid-sized cities are often heavily reliant on vehicles. Most mid-sized cities in Canada are relatively new and were built during the automobile era, which allowed for infrastructure to be spread out. Zoning laws in cities also make it hard for its residents to use multimodal modes of transportation due to the large size of neighbourhoods and how far away they are from daily amenities.
The reason that public transportation works so well in large cities is because there are a lot of people traveling in the same places, which means that buses can run more often and be more reliable. In smaller towns, it is a challenge to get people to take public transportation because they often have to bike or even drive long distances to get to the bus stop, making the use of public transport a hassle. In addition, traffic delays in mid-sized towns aren’t problematic enough to promote other modes of transportation, because people ultimately want to choose the fastest and most efficient ways to travel.
Being from a mid-sized town myself, I was curious to look into the green transport initiatives that my hometown, Kelowna BC, is taking. The Kelowna metropolitan area has a population of nearly 200,000 people and it is rapidly increasing. It is expected that 50,000 people will move to Kelowna in the next 20 years [2]. With a rapid increase in population comes a lot of opportunity for sustainable initiatives going forward.
The City of Kelowna hopes to increase the ease of public transport use in the future by prioritizing buses over other traffic at key locations, and increasing the frequency and reliability of public transport. Rapid transit systems such as bus rapid transit, or light rail traffic are not economically feasible for the City of Kelowna at this point, but may be examined more in the future. The majority of Kelowna residents currently feel that automobile transport is the only viable transportation option, and one of the City’s main goals is to shift this mindset in the coming years [3].
Green Infrastructure in the City of Vancouver focuses on sustainably managing rainwater runoff due to the high volumes of annual rainfall that Vancouver receives. According to the City of Vancouver, Green Infrastructure “mimics natural water processes. It works with plants, soils, trees, and built structures to capture and clean rainwater before returning it to our waterways and atmosphere.” The following video explains Green Infrastructure in the City of Vancouver in more detail.
In rural areas, rainwater would typically be absorbed into the ground and would either slowly drain into a stream or river, or be transpired through plants. In large cities however, rainwater often becomes contaminated with pollutants on impervious surfaces such as roofs or pavement and is then released back into rivers or streams at an “unnatural” pace. This can disrupt the natural process that rainfall would typically undergo, and if large rainfall events occur, rainwater can often end up in the sewage system, resulting in contaminated water.
Some examples of green infrastructure that have been implemented in the City of Vancouver include green roofs, rain-friendly streets, swales, rain gardens, and parks. Green roofs are considered “living roofs” and are covered with various plants and trees in order to reduce rainwater runoff. Green roofs can also help to insulate buildings, and provide habitat for smaller forms of wildlife, and pollinators. Rain friendly streets, swales and rain gardens are all infrastructures designed to reduce rainwater runoff. Lastly, parks also mitigate rainwater runoff and are a beautiful space that communities can enjoy.
Some of the benefits of green infrastructure include improving water and air quality. With additional green space in cities, less rainwater is contaminated due to runoff, and green space can help sequester CO2. Green space also helps to reduce the risk of flooding and better manages rainwater. Green infrastructure can also help cities become more resilient to climate change. Incorporating green infrastructure elements reduces heat island effects in cities and helps to keep them cool during extreme heat waves. Sewer infrastructure costs can also be decreased with green infrastructure implementation, because the volume of runoff entering the sewage system is reduced. The lifetime of sewage systems is therefore increased, and less maintenance is required. Lastly, green infrastructure can help improve the mental and physical health of communities, by creating an inviting open green space for exercise and enjoyment.
Reference:
“Green Infrastructure, Sustainably Managing our Rainwater,” City of Vancouver: https://vancouver.ca/home-property-development/green-infrastructure.aspx
Metro Vancouver water supply depends on the stock of natural capital of the Vancouver watershed. Vancouver raw water is from snowmelt and rainwater from the mountains. The raw water is of such quality that expensive preliminary treatment process similar to wastewater treatment process described later in this write up is eliminated. The availability of quality raw water for water supply is a global concern. In some countries and from the experience of the author, some cities water treatment plants have multiple unit processes of larger scale of the wastewater treatment process described in this paper due to poor quality raw water available to meet water needs. However, questions needing answers are: what is the value of the Vancouver water shed? Could it be valued at combined valuation of water supply and wastewater collection and treatment system’s performance level that return all used water to standard and quality taken from nature? Lastly the write up briefly address inter-dependency of systems in order to set the stage to appreciate systems thinking; and need to preserve our natural capital to maximize our ecosystem benefits.
Figure 1: Greater Vancouver Watershed
The Water Supply System
Vancouver watersheds are protected mountain watersheds covering an area of approximately 60,000 hectares. The system itself comprises six mountain storage lakes, five dams, two major water treatment facilities; over 520km of large diameter transmission mains, 25 storage reservoirs, 19 pump stations and 8 re-chlorination stations (McMahon J, 2018). Figure 2.Figure 2: Water supply: Sources and Distribution
Water Supply & Distribution: The regional water district department provides large scale trunk transmission and treatment systems for potable water and coordinate with member municipalities. Figure 2, The municipalities take responsibilities for the reticulation systems and consumer connections (households, commercial and industrial uses). Figure 3. Hence Metro Vancouver water services department is able provides clean, safe drinking water through its member municipalities for 2.5 million residents in the Lower Mainland (McMahon, J; 2018; (“Metro Vancouver _About Us,” n.d.).
Figure 3: The municipal dimension: Water to your home
Environmental Health & Sustainable Water Use
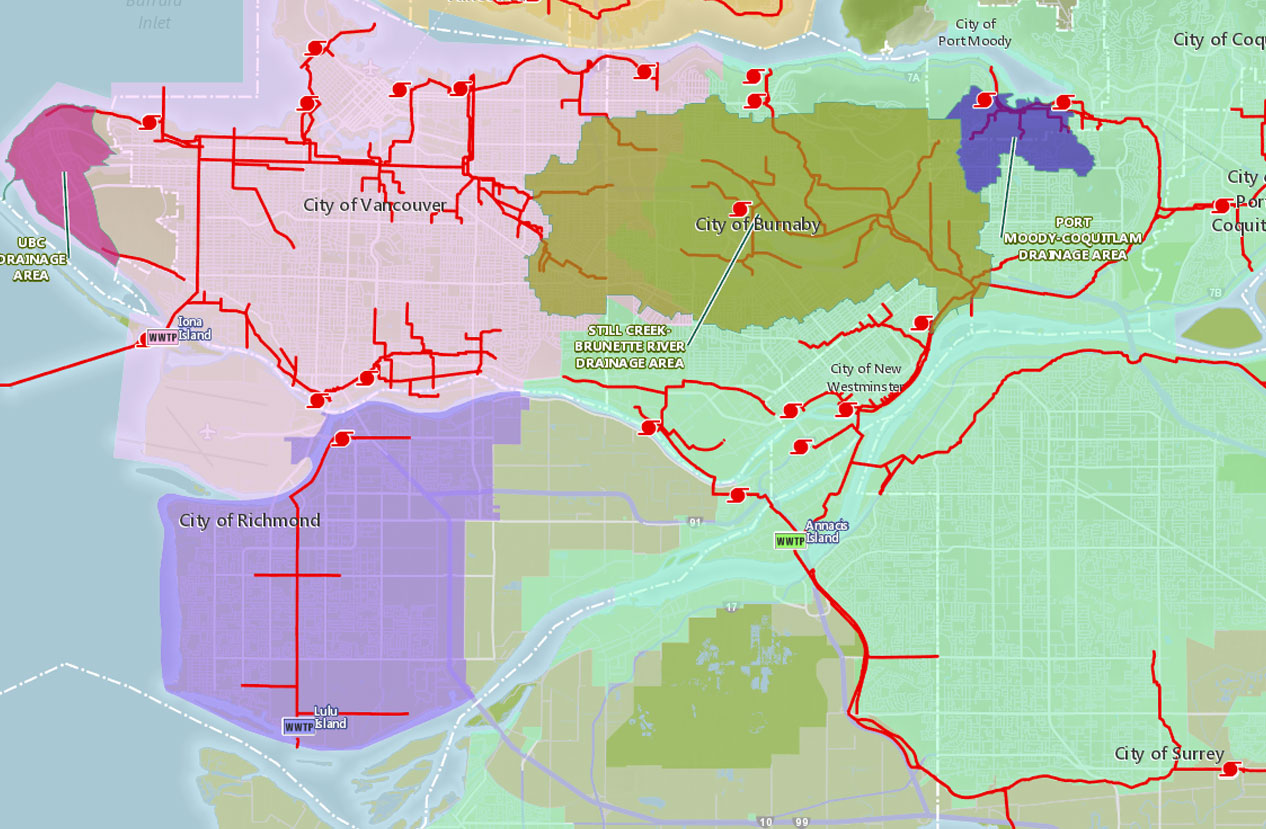
Wastewater Collection, Treatment & Disposal: The sewer collection include the sewer catchment areas, sewer mains, sewer pump stations and wastewater treatment plants. These facilities and systems components of the wastewater systems comprise of 530km of trunk sewer; 33 pump stations. Figure 4.
Figure 4. Liquid waste collection map
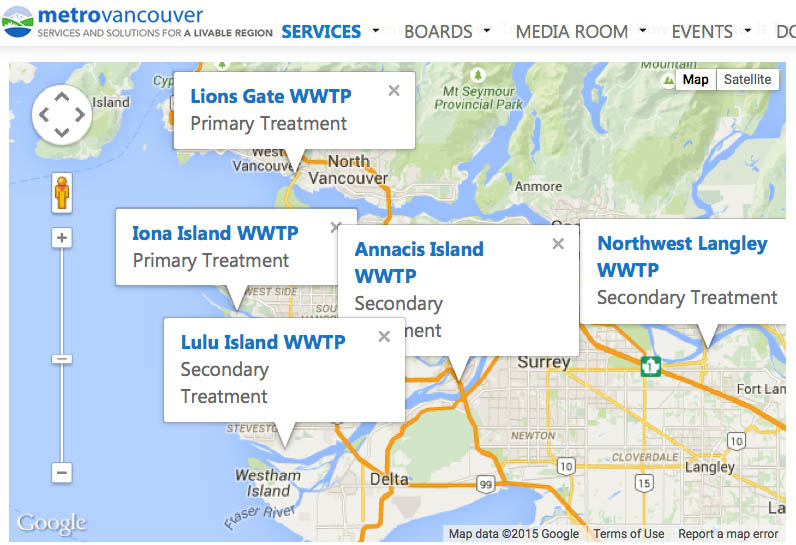
Treatment Plants: Five waste water treatment plants. Lions gate and Iona-primary treatment; while lulu, Anancis and NW Langley include secondary treatment processes (McMahon J, 2018). Figures 5. The Anancies wastewater treatment plant is the largest of the five with a 350MLD capacity; occupying 51 hectares; Design Population of 1million (Mayer, C; 2018).
Figure 4: wastewater Treatment Plants
Wastewater Treatment Process ( Case study: the Anancis wastewatertreatment plant: Video: https://vimeo.com/217633801 -CTRL click to play video)
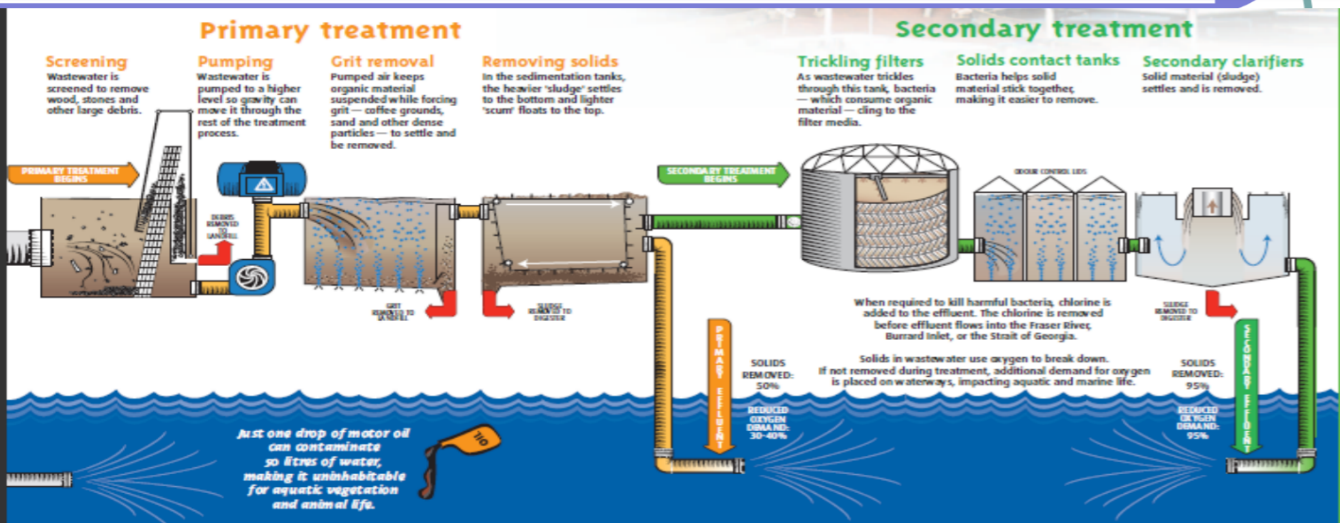
Figure 6 : Treatment of used waterAnancis Island Wastewater Treatment Plant (Process Diagram-Primary & Secondary Process); Source: Morales M, 2011
Industrial are pre-treated at source to acceptable standards before they are received into the treatment plant. As a case study we use the The Anancis wastewater treatment comprises of two-unit processes: primary and secondary treatment processes. The primary process comprises of receiving the wastewater from the trunk main into the treatment plant; then screening and grit removal; settling. Debris from screening and grit removal are dewatered and sent to landfill (Mayer C, 2018). The secondary unit process extended the treatment wastewater process through biological process of filtration and clarification and sludge digestion. Figure. 6 (Morales, n.d.). Through the secondary process a higher quality effluent is achieved for discharge into the river. Figure 6 is the treatment process of the Anancis plant as observed from the field tour. A retrieved online video of the Anancis wastewater treatment plant operation with our field trip facilitator Craig Mayer is embedded: Video: https://vimeo.com/217633801 -CTRL click to play video (Vancouver, 2017)
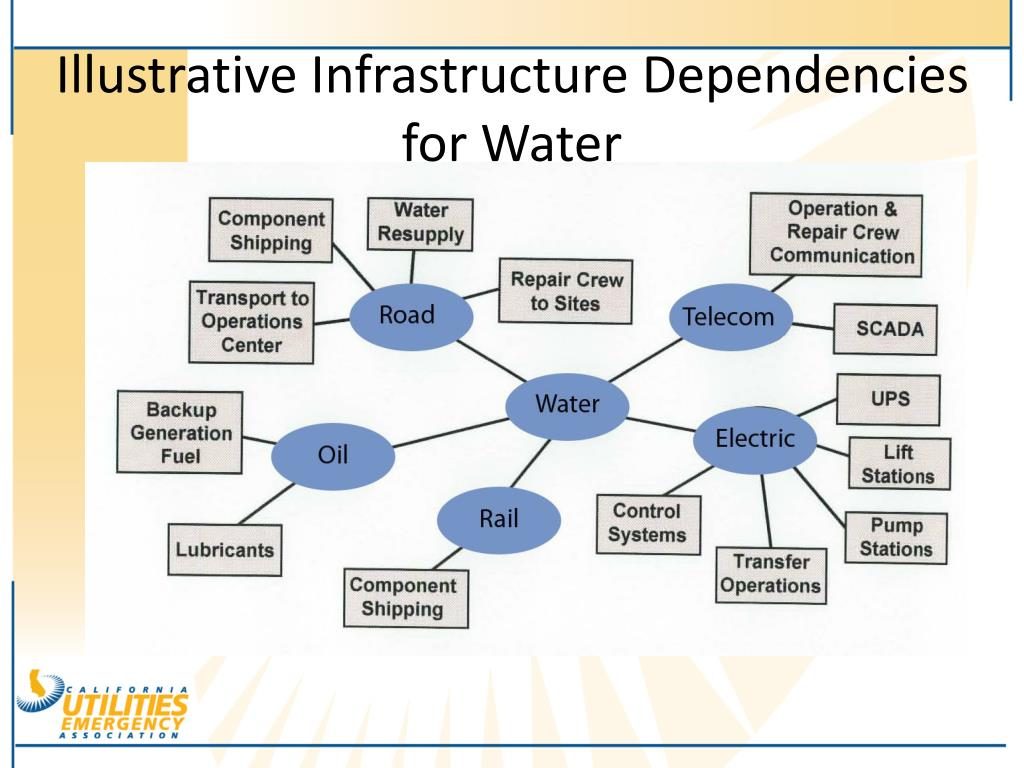
Inter-dependencies with other Urban Systems
Takeaway and Questions
Vancouver is naturally endowed with good source of water supply. Not all wastewater treatment plants in Vancouver has tertiary treatment process like the Anancis plant. Some effluent quality standards discharged remain below standard- aggregate wise, water returned is less in quality than water taken from nature. While it is natural to assume that the rest of the purification process will be taken over by nature; we should be mindful that there was no contamination of our natural water courses when we harvested it from the watershed. It is proper for Vancouver to ensure all effluent discharge is of substance and quality to that taken from nature before discharge. The interdependency of our infrastructure systems as show above also show how we are entirely dependent on nature from which it is critical to preserve our natural capital. In so doing, how do we ascribe value to benefits derived from our ecosystems? What budgetary allocation should be made for example to preserve the Vancouver watershed? What is the valuation of this natural asset? Should it be assessed as the equivalent capital cost capital cost and operation cost of wastewater supply system at current dollars or equated as size of the Vancouver economy?
REFERENCES
Drinking Water Management Plan June 2011.pdf. (n.d.). Retrieved from http://www.metrovancouver.org/services/water/WaterPublications/DWMP-2011.pdf
Mayer C, 2018: “Authors Notes from Field Trip/Tour of Anancis Wastewater Treatment Plant, June 19, 2018_ Master of Engineering Leadership (MEL) Student, UBC
McMahon J, 2018: Utility Systems – Liquid Waste and Water Metro Vancouver June 19, 2018” Field Trip Ppt Presentation (Master of Engineering Leadership (MEL) Student, UBC.
Morales, M; 2011: Wastewater Management in Metro Vancouver http://tonydorcey.ca/597/11WastewaterMetro.pdf. Retrieved 6/26/2018-10:57:52
Metro Vancouver _About Us; 2018: ) Retrieved June 29, 2018, from http://www.metrovancouver.org/about/Pages/default.aspx
Penn, Michael R; 2012: Introduction to Infrastructure: an introduction to civil and environmental engineering John Wiley & Sons Inc. 2012 ISBN 978-0-470-41191-9 (pbk)
Vancouver, M. (2017). Anancis Waste Water Treatment Plant Tour – Oct 2012. Retrieved from https://vimeo.com/217633801
Water for Life’ 2005-2015: International Decade for Action “Water for Life” 2005-2015. Focus Areas: The human right to water and sanitation. (n.d.). Retrieved from http://www.un.org/waterforlifedecade/human_right_to_water.shtml
This past November, I was fortunate to have had the opportunity to attend the 2017 Metro Vancouver Zero Waste Conference. The theme for this year’s event was a Circular Economy Within Reach, and throughout the day, experts on several aspects of the topic discussed solutions to reach a circular economy.
The Circular Economy on the International Space Station
The day started with an incredible keynote from scientist and retired NASA astronaut Cady Coleman who shared her unique perspective on zero waste when she lived aboard the International Space Station for six months. Despite the high bar set by Dr. Coleman, the following discussions continued to deliver fascinating discussions throughout the day.
Scientist and retired NASA astronaut Cady Coleman delivered the opening keynote speech for the conference (Metro Vancouver, 2017)
Plastics: Reimagining a Global Material
Although the conference had several interesting sessions, I found one debate on plastics particularly interesting. The panel consisted of three experts on the issue of plastic waste: Professor Richard Thompson, who is studying the impacts of plastic in our oceans, Mats Linder from the Ellen MacArthur Foundation, and Andrew Falcon, CEO of Full Cycle Bioplastics. All of them agree that plastic is an indispensable material to modern life, and believe that because of its durability and versatility, it has to the potential to reduce our waste and even reduce our environmental footprint. Unfortunately, the design for limited material recovery and reuse has been catastrophic for our oceans and marine life.
The Current Plastic Packing Material Flow (Ellen MacArthur Foundation, 2016)The New Plastics Economy (Ellen MacArthur Foundation, 2016)
References
Metro Vancouver. (2017, November 20). Why Metro Vancouver’s 2017 Zero Waste Conference Is Being Called ‘The Best Yet’. Retrieved from Metro Vancouver Zero Waste Conference Blog: https://zwcblog.org/2017/11/20/why-metro-vancouvers-2017-zero-waste-conference-is-being-called-the-best-yet/#more-2516
Orloff, A. (2016). The Built Environment. Metro Vancouver Zero Waste Conference. Vancouver: Metro Vancouver. Retrieved 12 10, 2017, from http://www.zwc.ca/archive/2016/sessions/Pages/built-environment.aspx
World Economic Forum, The Ellen MacArthur Foundation, and McKinsey & Company. (2016). The New Plastics Economy: Rethinking the future of plastics. The Ellen MacArthur Foundation. World Economic Forum. Retrieved from https://www.ellenmacarthurfoundation.org/news/the-new-plastics-economy-rethinking-the-future-of-plastics-infographics
Beijing is the capital of China, and the largest city in northern China. In recent decades, Beijing has progressed rapidly in economic development and urbanization. However, municipal solid waste has become one of the significant environmental problems in the city. This article aims to provide an overview on Beijing’s urban solid waste management with regard to its generation, composition and management.
Generation and trend of municipal solid waste
According to the data published by Beijing Statistics Bureau, it is demonstrated that the amount of disposed solid waste in Beijing increased steadily over the past two decades, from 2,800 thousand tonnes in 1995 to 7,903 thousand tonnes in 2015. A multi-regression analysis shows that GDP is identified to be the strongest explanatory factor for the growth of the total solid waste amount in Beijing, indicating that the environment has been paying the price for the economic growth.
Composition of urban solid waste
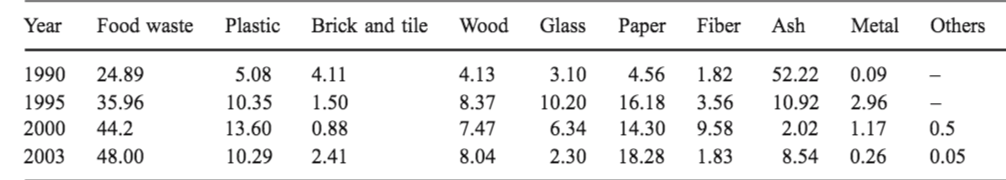
From table 1, it is shown that solid waste composition has been found to be relatively stable. Food waste always comprises the highest proportion except in 1990, and its representation has an increasing trend. Plastic, paper and ash also occur in relatively high proportions.
Table 1 Composition (%) of urban solid waste from 1990 to 2003 in Beijing
Municipal solid waste management
There were 22 treatment establishments for solid wastes in Beijing in 2004, and the number has increased to 28 in 2016. Sanitary landfill is the main treatment approach of municipal solid waste, while composting and incineration only make up small proportions. Recent research results indicate that the treatment capacity of the treatment plants proves to be insufficient as the capacity can not satisfy the need of treatment. In addition, the traditional landfill practice produces a large amount of greenhouse gases, and some of the pungent gases are poisonous. In order to mitigate the health risk for the population near the landfill, a proper collection and venting system need to be created.
Discussion
The solid waste management in Beijing has been greatly improved during the past decade. However, problems remain in respect of domestic garbage reduction, resource utilization and industrialization. Future challenges for the local government include the implementation of an effective waste minimization program, systematic urban solid waste management;; and improvement in data availability in monitoring the characteristics of municipal solid waste.
 Figure 1: G