Exploring job statistics of librarians and archivists in America

by Mya Ballin & Liz Day

Objective

The objective of our info visualizations was to enable an individual to get an idea of the library, information science, and archives jobs in America over the past decade. We imagined that intended users would be those who are considering graduate school and want to know about what job prospects might be on the other side before committing, as well as those who are currently in school who are looking to get an idea of what their prospects will be upon graduation. Additionally, this resource could be potentially used by current librarians and archivists as a tool to discover where their current job sits in the context of jobs at large.

We wanted users to be able to achieve certain queries pertaining to their interests–geographic and professional (in a very general sense)–mainly those identification and comparison. Questions that we imagined users being able to answer included:  What states employ the most librarians/archivists? Where can I be expected to be paid the most? What industry hires the most librarians/archivists?

To this end, interactive options are mainly related to filtering and selection, which we felt were adequate for the needs of the user in relation to understanding the data.

The data

All the datasets used in this project were sourced from the Bureau of Labor Statistics (BLS), a unit of the Department of the Labor, and under the purview of the US federal government. 

The national map visualizations, the comparisons of 2010 and 2019 wages bar chart, and the top and bottom 5 earners, work off of the same dataset which is a combined set of annual labor and wage statistics from 2010-2019 for each individual profession. This combined set provided us with many more attributes (27) than were needed to produce any visualizations. The California view uses identical data attributes to the national wage and job availability data set but goes more granular, by looking at the same data broken down to region, instead of counted at the state level. All components of the infographic portion of the vis (pie chart, job breakdown, word map) use data from the larger job grouping of “Educational Instruction and Library Occupations Group”, this data set looked at the saturation of librarians and archivists, compared to other professions under the same occupational group according to the BLS. 

Data wrangling was mostly spent integrating different data sets, as the data obtained had a dataset for each year used. There are a number of null values for occupation type and years without any statistically significant data, this is only obvious when the visualizations are viewed by specific year or occupation type.

Tools

The primary tool that we used to transform the data into an information visualization was Tableau. As we had become familiar with using this tool to analyze fairly large data sets through the course of the class, it felt natural to gravitate towards this program for our final project. Tableau provided key capabilities that allowed us to create both the interactable and encodable elements through which we imagined our objective could be achieved.

The easy way in which data points can be grouped together proved to be particularly useful when we sought to create the distribution of wage graphs, as it meant that we did not have to manually create and populate a new column of data. Because of the national nature of the dataset, doing so would have been incredibly time consuming, but Tableau allowed us to create this very helpful visualization simply through its own capabilities.

The ability of Tableau to create dashboard views turned out not to work in our favor, as embedding a dashboard in our website skewed the dimensions of each individual vis in such a way that it no longer was particularly effective in its presentation. Additionally, the program’s geographic properties, while helpful in creating choropleth maps, is dependent on very rigid maps or the ability of the user to acquire geographic polygons. If this is readily available, such as the example that we saw in class where polygons were provided by a governmental department, this isn’t such a hassle, but if such information is not easily discoverable, Tableau’s workarounds do not feel adequate. This proved frustrating on two separate occasions for this project: one in which we were interested in creating a cartogram and one when we were interested in only including one state (California) in our vis. After trying several solutions for both of these desired vises, we decided that the hoops that would have to be jumped through could not be justified when the time could be spent on making a much more readily possible vis as effective and expressive as possible, and so those ideas were dropped in favor of our current vis idioms.

In addition to Tableau, we also used infogram to create various visualizations. The program’s ability to offer a wide range of preset idioms that could be customized to ones data was incredibly useful, and it meant that we had access to a lot of idioms that we might not have otherwise thought of or considered. The person breakdown chart is an example of this.

Infogram’s animations and smooth aesthetic make it an incredibly attractive interface that is easily accessible for non-designers and programmers, and one that increases the attractiveness of the visuals for the user. However, some of the ways it makes itself easily usable also makes it a little too rigid. For example, when trying to assign state to hue, it turned out to be surprisingly difficult to ask Infogram to do so when it wasn’t the x or y axis. As a result, each bar had to be assigned its own color individually and the charts for each profession had to be separated from one another. Gradients were not an automatic capability either, which made the creation of the variation in saturation for the word cloud more difficult than when we had used the word cloud tool for the in class exercise.

The last tool that we used in order to tell our story was Weebly. This was incredibly effective in allowing us to actually lead the user through a narrative. One downside of this, however, is that the heavy amount of embedding that needed to occur in order to bring everything onto one page means that it takes a long time for the site to load, particularly when it comes to the Tableau vises. Additionally, dimensions of infographics proved to be slightly difficult to manage, and therefore a lot of tweaking was required in order to produce a completely effective product.

Analytic steps

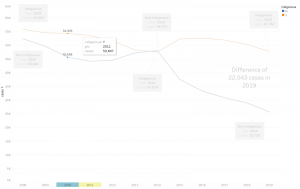
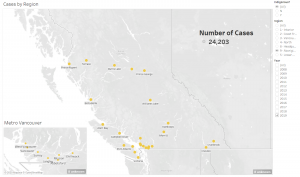
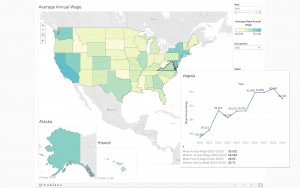
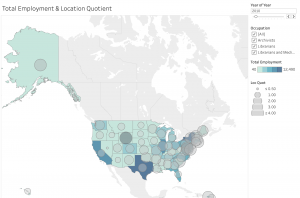
The BLS provides occupational profiles, but in the form of static maps and charts, and disjointed by occupation and year. We decided that we wanted to create similar maps views but, both integrated and interactive. Since the key to the project was showing the differences (or similarities) by state, the project began with two map views (one showing wage data, the other showing job numbers data). These two visualizations exist in an interactive form providing a great deal of data on wages and job numbers over a 10-year period. There are also two animated versions of these maps, to simply show national changes over time, with a less granular view of data.

From these map visualizations we were able to build upon what narrative we wanted to tell and what visualizations would support that. We looked to see how the occupations of librarians and archivists compared to other professionals in the same industry group according to the BLS. And, wanted to draw attention to what we had determined was pertinent information for the viewer (mainly top and bottom five earners by state, and overall annual wages by number of states). This information is already provided in the initial map view, but we felt it important to bring attention to. Finally, as residents of California, we felt it important to be as granular as possible by looking at the same wage and job number data, but under the lens of metropolitan regions within a state.

There was no specific argument trying to be presented prior to beginning the project. But, upon creating the initial national map visualizations, we concluded that wages and job numbers have been going up historically.  We wanted to see how this wage information compared to other professionals and how LISA professionals compare to colleagues of similar fields. The goal is to have the user interact with the various infoVises and for themselves to conclude if either of the two professions are viable for them based on potential earnings and potential job availability.

Design process and principles

The vis idioms we selected were specifically chosen based on our desire to create a collection of graphics that explored a variety of different attributes including space, time, and hierarchy. We chose to use choropleth maps and, in our total employment map, a version of a cartogram in order to expressively and effectively communicate the data. We chose to use maps because the key of our data was based on state, and in order to represent it most effectively, using position on a common scale is considered to be the most effective. Because, as previously mentioned, creating a true cartogram was not possible given the time restraints and difficulties with creating polygons, using a version that utilized a form of area enabled us to utilize another magnitude channel that is relatively high on the effectiveness scale.

Color scheme was another key design element that we thought about. Tableau offers a large range of presets, but many of them transition from one hue to another through white, which can be kind of confusing if you have a lot of items that would be in the middle ground. The green-blue preset spectrum, however, is very clear in its transition and does not create the same kind of confusion that many of the color to color spectrums do, and so we elected to use this palette for our most important choropleth map.

For the infogram visualizations, we tried to use hue to create a pop-out effect by incorporating primarily luminance based distinctions between objects that were not our target, and using a completely different hue just for the most salient points. Color choices were made using guidance that explained distinctions visible by those who are colorblind in order to hopefully ensure that the visualizations are accessible.

The Story

The overall intention of the project is to provide burgeoning information professionals – mainly aspiring Archivists and Librarians, about the general landscape of wages and job prospects in the United States. With questions like: will I be able to get a job after I graduate? Are there library jobs back where I’m from? Is this occupation going to be able to financially provide for me? As a future archivist, what industry will I find a job in? 

By presenting geotemporal wage and job availability in the form interactive maps (indicated by color gradation, and shape size), users are easily able to make assessments of wages nationally over time, and the number of employed professionals over time. Through this the user is able to then query specific locations, time periods, or occupations to narrow down granular data that would interest them specifically.

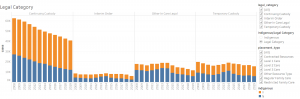
Beyond national wage and job statistics, the infographic portion of the project provides further information for LISA professionals as compared to other colleagues that fall under the same “Educational Instruction and Library Occupations Group”. It shows previously provided information (wage data by state) in a bar graph vis, to be able to compare states with the highest and the lowest wage earners.

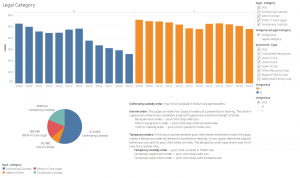
Finally, the project looks specifically at the state of California (home-state of both of us), providing a different view of the statistical data from the initial national map, by breaking wages and number of professionals employed by region. This gives the user, in this specific case Mya and Liz, an understanding of what they can expect as far as income and job availability in their home states, compared to what is considered a ‘living wage’.

After viewing the entire project, we hope the viewer has made judgments on where they might get a job, how much they might be paid, and their status compared to other similar professionals.

Pros and cons of your designs

The strength of our designs is their ability to allow users to get both geographic and temporal perspectives easily. The implementation of animation and the utilization of the tooltip function to show not only single data points, but state-specific graphs means that the visualizations are highly capable of answering multiple questions that a user might have.

However, that being said, the strength of our project as a whole relies on our ability to include a fair amount of explanation and narrative, which means that the visualizations are reliant on a certain amount of context. This is the case for any visualization, but it could certainly be said that certain idioms and vises do a better job of creating story on their own. Our decision to create vises that utilize narrative outside of themselves means that the project must come in a package in order for it to be at its most effective.

Another con of our design, or perhaps just of our data, is that because we focused on this one set that did not have librarians and archivists centrally in mind when it was created. There were a lot of questions that we had about methodology–such as whether considerations for contract/temporary work had been identified–that we could not answer and would perhaps have been considered in the context of profession-specific data. That being said, we did try to find if such sets might be available, and it did not appear to be the case. As a result, working with this data is probably the most informed we could be. Similarly, the MIT Living Wage Calculator, while technically accurate, also presented some interesting conclusions. For example, while using the data we concluded that it would be possible to live in the Bay Area on the wage presented by the BLS for the area, both project members were highly skeptical of this actually being a reality.

Include embedded visualizations or snapshots and links to public websites (e.g. Weebly, Wix, Tableau Public, Infogram, Canva, etc.) where your infovis can be https://libr514jobs.weebly.com/found. 

All visualizations can be found embedded into our project website: https://libr514jobs.weebly.com/

References

Bureau of Labor Statistics. Librarians and media collections specialists. (n.d.). Retrieved  from https://www.bls.gov/oes/current/oes254022.htm

Bureau of Labor Statistics. Archivists. (n.d.) from https://www.bls.gov/oes/current/oes254011.htm

MIT Living Wage Calculator. Living Wage Calculation for San Francisco-Oakland-Hayward, CA.  Retrieved from https://livingwage.mit.edu/metros/41860

Munzner, T. (2015). Visualization analysis and design. Boca Raton: CRC Press, Taylor & Francis Group.

Tracking Violence Against CYIC

By Amanda Grey, Kay Tao, and Julia Zhu

We have created a Tableau Story which will show people the violent situations that children and youth in care (YCIC) of the British Columbia (BC) government face. This is a serious subject, sowe needed to consider carefully the approach we would take. We consulted Spotlight: Child Welfare’s Best Practices: child welfare journalism (Cohen, 2019) in order to avoid treating the subject as “trauma porn,” and they are the reason why our first story point, Reasons Why Children and Youth Enter Care, begins with text reminding people of the goal of our infovis, reminding people that it’s a sensitive subject. Our audience is the general public who may not know anything about CYIC. Who is in the system, how the system works, and what some of the shortcomings of the system might be are topics that we are trying to enlighten for the viewer. In the course of everyday life, the general public gathers general impressions through news coverage or social media about CYIC, so we wanted to give them the opportunity to delve into the data in a way that’s more accessible and visually engaging than the tabular datasets that are published by the BC government. Our communicative goal is to highlight injustices that can occur to helpless children and youth in the care of the BC government, and who these children and youth are.

As with most plans, several adjustments had to be made once we actually started working on the project. After much discussion, we decided to scrap the concluding infographic and integrate the introduction information throughout the story. We ended up with a larger number of story points and Tableau infovis than we had originally planned, and we were having trouble determining what an infographic would bring to the narrative. Our original plan of having an infographic as a conclusion to summarize the data was inconsistent with the exploratory nature that we wanted this infographic to have: allowing the viewer to walk away having discovered their own connections and discoveries. Potentially we could have come up with good infographics to include with this narrative, but we did not have enough time to spend planning it out. We decided that it was better to focus our attention on producing a high quality project in Tableau, than to create a mediocre infographic. The second thing that was changed from our Project Proposal was our plan to create a more robust introduction. This was mostly due to the increased number of visualizations that we had created. Rather than providing all of the context, definitions, and information at the beginning, we decided it would be better to have that information, where applicable, be included in the story point. This reduces the amount that we are relying on the viewer to remember the information they read at the beginning – provided that they even read it at all. By distributing the information along with the infovis it is relevant for, breaking it down into smaller chunks, and removing information that doesn’t directly relate to our infovis creations, we have made the textual content easier to navigate and process.

Dataset 

Since our project focuses specifically on children and youth in care (CYIC) of the BC government, we went looking for government data to see what information they have been keeping track of. Since the government tracks data over several years, we knew that this would be a good way of gathering consistent data. All of our data comes from the BC Ministry of Children and Family Development (MCFD): the branch of the government who is responsible for taking care of CYIC. The data is open source and publicly available for download.

Our first story point shows the reasons why children and youth are ordered into care. For this data, we used datasets published by the MCFD on Permanency for Children & Youth in Care. We used MCFD office and region location data to map the regions associated with demographic data, as there was no boundary information available. We also used the demographics dataset available from DataBC. Again, this dataset was available in Excel format, including year information, case numbers, and placement/legal category information. For our critical injuries and fatalities infovis, we used data from the MCFD report on Case Data and Trends to illustrate the differences in critical injuries and fatalities among children and youths who lived in care homes and those who did not, as well as differences between Aboriginal and non Aboriginal children and youths. That report also gave us data on children and youth in care who had gone back to their families but were again maltreated. All datasets were downloaded in Excel format.

Tools

Microsoft Excel: We used Microsoft Excel to combine, clean, and wrangle the data. For our group, the strength of Excel laid primarily in its familiarity. For the most part, we were dealing with small datasets which were easily handled by Excel. However, the data set for the demographics of children in care was very unwieldy and here Excel showed its weakness in handling large datasets. The demographics dataset was several thousand rows long, and the year month was included in a single field as y/m, eg., 199001. As the month information was extraneous, we needed to remove the month from the y/m field. By using find and replace, we were able to slowly work through the data and clean it by removing irrelevant data, such as street address, and keeping latitude/longitude data and region names.

Tableau Desktop: To create our visualizations, we used Tableau Desktop. To create a dashboard, we combined several worksheets together. During this process, we noticed several advantages and disadvantages of Tableau. The interface can be confusing sometimes, with key tasks such as calculations being hidden behind dropdown menus. However, once you know what to do being able to drag and drop the different pills makes the interface easy to use. Additionally, the “Show Me” feature is incredibly helpful to show the different idioms that Tableau is capable of creating as well as the types of data required to use them. A definite pro for Tableau is the ability to explore and try out different idioms, data types, and marks and easily being able to go back using the undo button; no matter what we tried, we did not break Tableau and felt comfortable exploring the interface. This does not mean that we had an easy time of it. For the Type of Death Depending on Care Category chart, we ran into some issues with Tableau. We wanted to include a “Total” on the filter for “Causes of Fatality” but we were unable to do so because Tableau could not sum up aggregate and non-aggregate data. However, the data that we were trying to sum up were all aggregate data and the sum should have worked. We have no idea why this would not work and we were not able to find a solution.

Tableau Story: In order to tell a story, we used Tableau’s Story feature to combine all of our worksheets into a cohesive group to present our data. Even though our datasets all came from the government, we were limited in our ability to link them together into a combined dataset. We linked together the data that we could, but we ended up having five different datasets which we were using. Tableau Story allowed us to connect to all five datasets in order to use the dashboards that we had created. This was extremely helpful, since it meant that we didn’t need to worry about combining our data using unwieldy composite keys or manipulating the data. The process of creating a Tableau Story was very easy and intuitive, but we were frustrated by the sizing features. All of the dashboards were sized for maximum readability, but once the dashboards were imported into the story, they would be resized. Once the Story was uploaded, the sizing would be different than what showed on Tableau, making it hard to prevent images/text from being cut off. Even though Tableau has automatic sizing, it didn’t work as expected- it didn’t resize to fit the screen, and would often cut off text or cause the reader to need to scroll through content.

Analytic Steps

Our analytic steps varied depending on the data we were dealing with. Initially, we wished to use a map to indicate which regions had more CYIC. However, the MCFD regions did not line up with the health regions, and region 9 overlapped with other regions, which meant that a chloropleth map was not a viable option. Thus, we decided to use MCFD regional offices to illustrate on a map where the regions would be located, and the colour of the mark would indicate the region, and the size of the mark would indicate the amount of cases. However, as the case numbers in each region were similar in scale, using size to illustrate the number of cases was not as effective as we hoped. The scale, however, when responding to the region filter, lists the amount of cases, so it is effective as a tool for showcasing the number of cases in a region.

During the first stage of our project, we ended up with a large amount of bar charts since most of our data was measurements and length is the most expressive way to represent that data. However, since our audience is the general public we didn’t want to run the risk of them becoming bored looking at a bunch of bars. We then discussed and explored different idioms which could be used. For example, the two infovis used to show the reasons why CYIC entered into care were a result of exploring what design options were available in Tableau and were changed from bar charts into packed bubbles and a scatterplot. The packed bubbles were possible because there are only a few bin sizes and it’s easy to see the size differences. Likewise, the Breakdowns of Critical Injuries and Fatalities infovis were changed into pie charts because the amount of categories was below the bin threshold.

Design Process

In order to efficiently present our data, we considered expressiveness and effectiveness, as well as interactive visualizations to engage with our users. For example, we used highlighting and linking features in our story to highlight each unique datapoint. 

In the “trends” storypoint, we chose to highlight and label the number of cases by year, so viewers could easily compare the difference in case numbers year over year. We also used annotations to point out key areas of the data so viewers, even if skimming the graph, could quickly take away key numbers.

We used switches in Legal and Placement story points as a tool for viewers to easily compare the number of indigenous/non-indigenous individuals in each situation, enhancing the expressiveness of our vis when it comes to differentiating the number of indigenous/non-indigenous in a certain category, by year. In the Category switch view mode, the viewer can see the total number of CYIC in each category, which is another aspect that we wish to communicate.

For location data, we chose to use a map to most effectively communicate where in BC these cases were, linking them to the caption “number of cases” to the side.

Pie graphs were used when we wanted to show proportions of a whole-specifically, they help the viewer quickly grasp the proportion of individuals in each category, letting the bigger and smaller slices quickly stand out.

We chose what we perceived to be the best method to visually encode our dataset attributes to satisfy expressiveness, and chose the best channels for the most important attributes, satisfying effectiveness.

Finally, we decided to create a title page for the project as a neutral landing place for visitors before they are presented with data. The image we chose for this was of a mother bear and her bear cub to represent taking care of children. Although it has been suggested that this image might not be clearly related to the topic, we wanted to avoid the type of “trauma porn” mentioned in our introduction that would be associated with using pictures of actual children. Additionally, since the comparison between Indigenous and non-Indigenous children is a strong component of our project, we wanted to avoid misrepresenting or over-emphasizing Indigenous peoples. In the end, we decided that using an image of animals, instead of people, with a theme related to the topic but not directly connected was the best way to approach this sensitive issue.

Reflection on Designs

One of the strong points of our designs is that we tried, wherever possible, to include explanations of what the terms used in the charts mean. For example, we wrote descriptions of the different legal categories used by the MCFD when categorizing their children and youth in care. This helps the viewer understand what is being visualized. Additionally, our use of positioning and spatial region for the Cases by Region infovis by using a map of BC will be extremely useful to individuals who may not know the geography of British Columbia, but also useful to viewers who will be able to recognize locations and regions. 

However, there are several things about our design that could be improved on. There are several story points where the infovis could be linked together so that there is more interaction between the charts. This would allow the viewer to analyze and make connections easier. Due to a lack of time, there are a lot of small details that we could have edited in order to make our designs more polished, such as making sure that our tooltips contain more information, cleaning up filter wordings, and more consistent colour choices. In the Cases by Region chart, size is being used as an indicator of the number of cases. However, we think that this information isn’t really helpful because the reason for the increased number of cases is because of population density. By presenting the size indicator, we may be misleading the viewer into thinking this is a bigger issue than it is, even though the data is correct. Additionally, there is an issue with discriminability since it is difficult to differentiate between the different size categories. The reason we decided to keep this in was to be able to see the total number of cases for the filtered selections. Further time and investigation might show how to do this without using size in the marks.

Another issue is that viewers may not feel the need to read through the whole thing or explore the visualizations provided. Because of the amount of information provided, the viewer might find it overwhelming and lose interest. However, if the viewer takes the time to read through the explanations provided and use the filters, the viewer can form a much more nuanced view of the issue.

References

Cohen, Dylan. (2019). “Best Practices: child welfare journalism. Working with lived experience.” Spotlight: child welfare. Retrieved from https://www.spotlightchildwelfare.com/wp-content/uploads/2019/05/Best-Practices-child-welfare-journalism-dylan-cohen-FINAL.pdf

Ministry of Children and Family Development. (N.D.). Admissions into Care [Data file]. Retrieved from https://mcfd.gov.bc.ca/reporting/services/child-protection/services-to-children-in-need-of-protection/case-data-and-trends

Ministry of Children and Family Development. (N.D.). Breakdown of ‘Neglect’ [Data file]. Retrieved from https://mcfd.gov.bc.ca/reporting/services/child-protection/permanency-for-children-and-youth/case-data-and-trends

Ministry of Children and Family Development, (N.D.). Child Protection Services – Four Key Stages. Retrieved from https://mcfd.gov.bc.ca/reporting/services/child-protection

Ministry of Children and Family Development. (N.D.). Children and Family Development – Cases in Care Demographics [Data file]. Retrieved from https://catalogue.data.gov.bc.ca/dataset/children-and-family-development-cases-in-care-demographics

Ministry of Children and Family Development. (N.D.). CYIC Recurrence of Maltreatment [Data file]. Retrieved from https://mcfd.gov.bc.ca/reporting/services/child-protection/permanency-for-children-and-youth/performance-indicators/children-in-care

Ministry of Children and Family Development. (N.D.).  Fatalities of Children in Care & Receiving Services Under the CFCSA – by Calendar Year [Data file]. Retrieved from https://www2.gov.bc.ca/gov/content/family-social-supports/data-monitoring-quality-assurance/reporting-monitoring/statistics

Ministry of Children and Family Development. (N.D.).  Fatalities of Children Receiving Services (Not In Care) by Calendar Year [Data file]. Retrieved from https://www2.gov.bc.ca/gov/content/family-social-supports/data-monitoring-quality-assurance/reporting-monitoring/statistics

Ministry of Children and Family Development. (N.D.). Reasons for CYIC by Court Order for Protection [Data file]. Retrieved from https://mcfd.gov.bc.ca/reporting/services/child-protection/permanency-for-children-and-youth/case-data-and-trends

Ministry of Children and Family Development. (N.D.). Provincial Rate of CYIC per 1,000 Population [Data file]. Retrieved from https://mcfd.gov.bc.ca/reporting/services/child-protection/permanency-for-children-and-youth/performance-indicators/children-in-care

Short-term Rentals, Long-Term Crises: Investigating Vancouver Airbnb Usage Amidst Housing Insecurity

Lian Furlong & Jessica Wilkin

Objectives

Our project is driven by an interest in how and why it is so challenging for low- and middle-income renters to secure affordable long-term housing in Vancouver. While there are many factors contributing to Vancouver’s housing crisis, one issue we wanted to examine in detail is the impact of short-term rental platforms on the city’s housing supply.

Airbnb, the most successful of these platforms, allows homeowners to rent out their properties to tourists and visitors at a considerably greater profit than can be expected from a long-term rental. Our objective was to examine Airbnb activity in Vancouver in the context of the city’s deeply inequitable housing market, and to encourage readers to explore correlations between these two issues.

We expect that our project will be of interest to Vancouver residents across all income levels and geographic communities. While there have been a number of government investigations and scholarly inquiries into the relationship between Airbnb and housing supply, we have seen little reporting that uses data to tell the story of Airbnb in Vancouver to everyday renters and homeowners. We therefore chose to create a simple editorial webpage that employs a combination of narrative text, static infographics, and interactive visualizations in the service of three goals:

  1. to provide readers with background knowledge about the state of Vancouver’s long-term rental housing market; 
  2. to inform them of how, where, and how many short-term Airbnb rentals are operating across the city; 
  3. to give them tools to explore relationships between long-term rental cost and availability, and the short-term rental market operating through Airbnb.

Datasets

Our visualizations draw from a combination of City of Vancouver reports and open-source data from the website Inside Airbnb. On topics of rental housing insecurity—including issues of affordability and vacancy rates—we derived our data from the “City of Vancouver’s Annual Progress Report and Data Book, 2019”: a 197-page document detailing municipal and census data relevant to housing issues in the city. Relevant tables in this document on subjects like vacancy rates over time, households paying more than 30% of income on housing costs, and median income by neighbourhood required manual entry into Excel in order to be ingested by visualization software.

For map visualizations focussing on Airbnb usage in the city, we sourced open-source data from Inside Airbnb, which compiles and publishes data about Airbnb rental listings for major cities worldwide. We assessed that this data had a high degree of credibility, since it was developed in consultation with data experts, community activists, and investigative journalists, including a local scholar studying Vancouver’s short-term rental market (Cox & Morris, n.d.; Sawatzky, 2016). The Inside Airbnb data is available as monthly sets, so we chose to visualize data in 6-month increments beginning in May 2018: the month after short-term rental regulations were enacted in the city (Housing Vancouver, 2019). To show and group data by neighbourhood boundaries in several of our map visuals, we imported geographical data on “Local area boundary” available through the City of Vancouver’s Open Data Portal (City of Vancouver, 2020).

Tools

Our project has both narrative and exploratory elements: infographics and simple visualizations that give accounts of Vancouver’s long-term rental precarity amid Airbnb’s popularity, and complex interactive maps that invite independent query. This multimodal approach called for a combination of tools: Tableau for map visualizations, Infogram for simple idioms and infographics, and Wix for web hosting and textual narrative. The infographic “Unavailable and Unaffordable: Visualizing the City of Vancouver’s Rental Housing Crisis” was made using Infogram. Infogram’s drag-and-drop design functions were intuitive for customizing designs, and its charts offered responsive, eye-catching interactions by default. This tool excels at facilitating visual, data-driven narratives, but there are many blocked functionalities for free users, which prevented our integrating map idioms, or combining column-line diagrams. For map-based visualizations, we turned to Tableau, which can sustain a high degree of interactivity, several filters and toggles, and the ability to encode attributes along multiple visual channels. Tableau’s mapping functionalities were necessary to visualize the massive, multi-attribute datasets comprising Inside Airbnb’s reports. We found embedding visualizations to be one less-intuitive process in Tableau; it took some trial-and-error to format dashboard sizes and layouts to look seamless in our Wix site.

To knit our disparate visualizations together into a coherent display, we chose Wix for its capacity to embed Infogram and Tableau creations, and for its ease-of-use, since only one team member has experience in web design. Wix was simple to learn and offered all the functionalities we needed to complete the project: text editing for narration, embed widgets for links and iframes, and simple visual elements similar to those offered in Infogram or Canva. While this tool meets our needs for this project, the free site can be a bit slow to load, which could pose accessibility issues for more bandwidth-intensive designs.

Initial Analysis

We were fairly clear on the ideas we wanted to communicate from the initial stages of our project. Our challenge was to make sense of our two primary data sources (the City of Vancouver’s housing reports and Inside Airbnb’s open-source data), which both contain a high volume of information and a broad range of attributes. Our first task was to determine which attributes would be most relevant for us, and where the two datasets intersect.

We began by visually exploring a portion of the Inside Airbnb dataset from May 2020. Because one of our goals is to allow readers to see the extent of Airbnb activity across the city, a map idiom was a natural choice. Inside Airbnb provides a GeoJSON file delimiting Vancouver neighbourhoods, which we were able to import into Tableau alongside a dataset containing detailed information on Airbnb listings. Joining these files together allowed us to create a dual-axis map that can display information at the neighbourhood level, but also at the level of individual listings.

Map visualization of Airbnb Listings in Vancouver

Creating this initial view helped us to determine two things. First, we would need to design a handful of interactive filters and parameters to help readers focus on different aspects of the Airbnb data, which can appear overwhelming in an unfiltered view. Second, we would need to provide enough context about the Vancouver rental market to help readers draw connections between long-term housing inequities and Airbnb activity.

One stumbling block we encountered was a dearth of long-term rental housing statistics that align with the neighbourhood boundaries as defined by Inside Airbnb. This made it difficult to represent both sets of information in the same view. We chose to address this by introducing our project with a set of infographics that contextualize Vancouver’s housing crisis. In this section, we compare several attributes: rental costs relative to income, and vacancy rates over time. We also include two additional Tableau-generated maps to help readers see income disparities between renters and home-owners, and between different Vancouver neighbourhoods. Our hope is that this information sets the stage and prepares the reader to meaningfully engage with the Airbnb visualizations that follow.

Design Approach

Our design approach was informed by an analysis of our target reader and their tasks. As Munzner states, before we can begin designing: “we must understand the cognitive tasks and visual queries a graphic is intended to support” (p. 14). We therefore sought to define our objectives according to our imagined reader’s top-, mid- and low-level goals.

At the highest level, our reader’s goal is to analyze data about Vancouver’s housing market in order to make new discoveries or increase their understanding of the topic. By framing our visualizations within an editorial narrative, we supply a hypothesis: that Airbnb exacerbates the existing housing inequalities in Vancouver by competing with the long-term rental market. Our reader’s task is to use our visualizations as a way to verify or disconfirm that hypothesis.

Infographic with information on hover

As described above, we decided to introduce readers to our topic with infographics and explanatory text. According to Lankow et. al, readers are drawn to formats that are “efficient, engaging and entertaining” (p. 45). Our infographics therefore feature an attractive header image, clean typography and ample white space in order to generate appeal. Charts are supported by simple descriptions and feature hover interactions with information-on-demand in order to assist readers with comprehension and retention.

Next, we chose to include a series of maps that integrate our quantitative and categorical data with base spatial data. Neighbourhoods within Vancouver are delimited by area marks using given geometry, while non-spatial data is encoded in one of two ways, depending on the level of detail required for analysis. The principles of expressiveness and effectiveness were carefully considered in each case in order to avoid misrepresenting the data and to ensure that readers’ visual queries could be served as rapidly as possible. This required distinguishing between our quantitative and categorical attributes, then choosing the most effective visual channel available for each one. These resulting maps take two forms:

  1. Several choropleth maps encode quantitative attributes (median income; percent of income spent on housing; number of Airbnb listings) at the neighbourhood level, where the degree of colour saturation shown for each neighbourhood indicates values.
  2. A dual-axis map encodes individual Airbnb listings as point marks layered on top of the neighbourhood geometry. In addition to showing each listing’s geographic coordinates, these marks encode categorical data about the type of property shown, using hue to distinguish rentals of entire homes from private or shared rooms.

Choropleth map and dual-axis map

Finally, we sought to support our readers’ search tasks by supplying several means for them to manipulate the visualizations. Our map views include multiple ways to filter out data in order to focus on specific elements or relationships. They also make use of tooltips that appear when the user hovers over a specific neighbourhood or a specific mark. These help to reduce clutter in the view, while providing readers with “information-on-demand.” The two maps showing Airbnb data are coordinated, so that when the user applies a filter or makes a selection, both views are automatically refreshed. This enables multi-dimensional exploration, and helps the reader make visual queries and comparisons across both maps simultaneously.

Storytelling

The website we created does not offer a story with a defined conclusion, but instead, we sought to give an open-ended account of how in recent years, Airbnb operations have flourished in Vancouver, while also posing potential threat to long-term rental affordability and availability. In telling this story, we follow Thudt et al’s (2018) suggestion that both exploration and explanation belong in data-driven stories:

While explanation is a powerful way to provide a narrative for readers and orient them within large and complicated issues and data sets, exploration enables readers to make their own inquiries, personalize their reading experience, and get a feeling for the limits and the shape of the data. Providing exploratory power can also be a way to communicate complexities in the data and mitigate some of the biases inherent in providing a narrative. (p. 61).

The infographic “Unavailable and Unaffordable” is one example of an explanatory approach. In it, we use simple visualizations and narrative to demonstrate how even though rent has largely kept pace with Vancouver’s median income in the past decade, those prices have merely remained too high; over one-third of renters spend an uncomfortable portion of income on housing, and vacancy rate has lowered to exacerbate Vancouver renters’ precarious situation. When renting a suite as an AirBnb for 10 nights brings 30% more income on average compared to long-term leasing, this profitability certainly threatens long-term rental stock.

The rest of our website—and its focus on interactive maps—is more exploratory in nature, with the intent of letting visitors personalize their search, inquiries, and conclusions about Airbnb usage in Vancouver, the effects of regulation, and housing insecurity. We preface each map with brief explanatory text and prompts to motivate interaction. In the last two maps for instance, users can query the efficacy of Vancouver’s short-term rental regulations, observe the prevalence of Airbnb usage in their own neighbourhood, and note the impacts of the COVID-19 pandemic on listings. Since short-term rental regulation and housing precarity remains a developing issue in the city, it seemed most appropriate to conclude inconclusively: to invite further questions into this unsettled debate.

Pros and Cons of our Approach

By applying our knowledge of information visualization design techniques and strategies, we were better able to represent the data in this data-driven narrative. Diagrams in our introductory infographic move in response to the user’s scrolling, and this draws the user’s eye toward their content as a central narrative component. Moreover, the infographic offers a moderate degree of interactivity, since their data points are selectable, and legends can be toggled as filters; these interactive elements encourage visitors to spend additional time with each visual, and to reflect on the written analysis that surrounds it. At the same time, the infographic’s layout and colour scheme is fairly minimal. While different attributes in a line graph are encoded with different hues for contrast, the same blue and green colour scheme operates throughout the infographic to minimize unintentional visual distraction. Ware’s (2008) contention that “a visual object [that] is distinct on one or more of the visual channels . . . can be processed to direct an eye movement” (p. 42) can be read both as a suggestion and a note of caution. Harnessing the viewer’s attention can be a careful balance, so our design choices reflect a desire to aid—rather than impede—the reader’s visual search.

The maps in our site’s latter half were designed for high interactivity, in order to promote self-guided exploration and analytic insight. All make use of various filters to accommodate users’ diverse search habits and queries, and in recognition that—as Heer (2012) explains—“analysts often want to shift their focus among different data subsets” (p. 4). Our map designs also reflect adherence to principles of effectiveness and expressiveness as best was possible; neighbourhoods are spatially segmented to align with city geography, orders of magnitude like listing numbers and income are encoded using hue and saturation, and in the last map, rental types are distinguished using dots with contrasting hues. Lastly, detailed tooltips in Tableau maps enable users to dig further into the detailed attributes corresponding with a mark label. Together, these design decisions assist visitors to intuitively observe patterns like where, for instance, rental affordability is worst in the City. They also empower our audience to personalize their investigations into these connected issues, to consider the impact of short-term rentals in their own neighbourhood, and to draw their own insights.

Some possible weaknesses of our designs reflect data limitations. For example, comprehensive neighbourhood-specific data on rent for Vancouver does not exist in a way that can be mapped without building custom polygons, since the existing data only refers to “rental market zones” that differ from neighbourhood boundaries. As a result, users are sadly not able to determine if rental affordability by neighbourhood corresponds with relative average rent. Similarly, the first set of diagrams in our infographic compare slightly different year spans, and this is due to income data only being available for census years. Another minor limitation of our design might be the clarity of neighbourhood labels on maps. Although we did customize their placement so as not to overlap, we were not able to constrain the width of text labels or reduce their font size any further, so longer text strings like “Kensington-Cedar Cottage” intersect with other boundaries in a way that might cause momentary confusion.

Works Cited

Cox, M. & Morris, J. (n.d.) About Inside Airbnb. Retrieved from: http://insideairbnb.com/about.html

City of Vancouver. (2020). Open Data Portal. Retrieved from: https://opendata.vancouver.ca/pages/home/

Heer, J. Shneiderman, B. (2012). Interactive Dynamics for Visual Analysis: A Taxonomy of Tools that Support the Fluent and Flexible Use of Visualizations. Queue, 10(2), 1-26

Housing Vancouver. (2019). Short-Term Rental Highlight Report. Retrieved from the City of Vancouver website: https://vancouver.ca/files/cov/short-term-rental-highlights-report.pdf

Lankow, J., Ritchie, J., and Crooks, R. (2012). Infographics: the power of visual storytelling. John Wiley & Sons.

Munzner, T. (2015). Visualization analysis and design. Boca Raton: CRC Press, Taylor & Francis Group.

Sawatzky, K. (2016). Short-term Consequences: Investigating the Extent, Nature and Rental Housing Implications of Airbnb Listings in Vancouver (Master’s Thesis, Simon Fraser University, Burnaby, BC). Retrieved from: https://summit.sfu.ca/item/16841

Thudt, A., Walny, J., Gschwandtner, T., Dykes, J., & Stasko, J. (2018). Exploration and explanation in data-driven storytelling. In N. H. Riche, C. Hurter, N. Diakopoulos, S. Carpendale (Eds.), Data-driven storytelling (pp. 59-84). CRC Press.

Ware, Colin. (2008). Visual Thinking for Design. Morgan Kaufman.

Understanding Anti-Asian and Federal Hate Crime Data in the United States

Group Members: Mandy Choie, Brian Mayne, Bryan Wood

Our project ended up being far more complex than we realized; it was a lesson in how mining and analyzing datasets can drastically change the trajectory of a data-driven assignment.

Initially, we sought to track the historical trajectory of anti-Asian hate crimes in the United States to better understand how the COVID-19 pandemic led to an increase in anti-Asian hate crimes across North America, comparing and contrasting the number of hate crimes against this group over different historical periods. However, we soon realized that the information we needed was unavailable – this might be because this data is too new to be definitively tracked or because tracking anti-Asian hate crimes is still a fairly new idea (Chen, 2017). Regardless, our narrative shifted from comparing historical incidents of hate crime data to investigating the nature of race-based hate crime data that is officially collected in the United States.

The FBI has been collecting hate crime data annually since 1996 and last reported hate crime statistics in 2018. While the FBI’s website provided the race-based hate crime data we were looking for, we quickly learned how problematic this data is. A number of sources including ProPublica (Thompson & Schwencke, 2016) and Southern Poverty Law Center (Shanmugasundaram, 2018) explain how hate crime data is under reported at all levels of the government, and many hate crime survivors (Schwencke, 2017) choose not to report being victimized. There is also clear evidence of confusion and errors in the data reporting, which is evidenced in the 2012 addendum to the FBI’s annual hate crime statistics (FBI, n.d.a). For some reason, nearly 1,500 agencies did not report their data to the FBI in time to be included in the annual aggregated report (FBI, n.d.a). The ways that the FBI categorizes the hate crime data are also questionable. The “Anti-Multiple Races, Group” and “Anti-Other Race/Ethnicity/Ancestry” categories obfuscate the racial identity of the victims in a way that gives no real meaning to these groups, which include a huge number of people. This highlights how poorly hate crimes are meaningfully identified and recorded which, by extension, questions law enforcement’s ability to competently address them.

Because hate crime data covers a massive amount of information across a diversity of marginalized groups, our analysis of this data does not and cannot fully represent all survivors of these crimes or the complex history of systemic racism against Asians or any single minority group in the United States. Instead, we hope to illuminate the issues of this data collection and how it creates an inaccurate picture of the reality of hate crimes in the U.S. Additionally, we hope that our visuals demonstrate how this data lacks nuance and context and is deceptively objective. This realization could help encourage more critical readings of all datasets, particularly those that are produced by the government or any large organization.

To develop our narrative, we reviewed the FBI’s definitions and methods of identifying hate crimes, the history of U.S. federal hate crime legislation, comparisons of hate crime reporting at the local and state levels, and multiple news sources that were critical of the FBI’s hate crime data collection. We were surprised by how recent many of the changes to the definition and collection of hate crime data are; however, since this data has only been officially collected since 1996, it’s no surprise that the government and law enforcement agencies are still trying to figure out how to collect and categorize this data.

The most troubling data point we discovered was that white Americans are the second-most victimized group in the United States. This places them just after black and African Americans, who experience the highest number of hate crime incidents. Given the current backlash against systemic racism and proliferation of white supremacy hate groups (Mathias, 2020), this assertion – while backed by hard data – is absurd. We also wondered what the motivation was to change and amend the names of the categories listed under “Race/Ethnicity/Ancestry.” For example, “Asians” and “Native Hawaiians and Other Pacific Islanders” were treated as a single group (“Asian/Pacific Islander”) until 2013. “Anti-Arab” was not a category until 2015. The “Other-Anti Race/Ethnicity/Ancestry” category was previously labeled “Anti-Not Latino or Hispanic” between 2013 and 2014, which confusingly implies that someone was targeted because they weren’t Latino or Hispanic, though that was not the case.

These discrepancies in reported numbers and categorization were the main reason why we shifted our focus from anti-Asian hate crimes to how the FBI datasets misrepresent hate crime data across all demographics. However, we still wanted to go beyond the data to better understand how Asians in America are impacted by hate crimes. We searched for sources that speak to the psychological and social impacts that hate crime victims may endure as well as some of the broader societal and geopolitical issues that motivate anti-Asian hate crimes.

Converting all of our data from PDF tables and article excerpts into information visualizations was a multi-pronged effort, but this confluence of information ended up strengthening our story. Mandy and Bryan started by accessing raw data from the FBI’s annual hate crime data. Mandy searched the FBI’s Hate Crime Statistics page, part of the Uniform Crime Reporting (UCR) Program’s website, which contains datasets from a number of related federal agencies (FBI, n.d.b). This website was the main source for gathering all hate crime data reported by Race/Ethnicity/Ancestry over the last two decades. Most years post their hate crime data directly on the FBI’s website, but the earlier years’ data can only be accessed through lengthy PDF files. Luckily, the same table – “Table 1” – was consistently used to report this data, so it was fairly simple to find this data from each year’s report. Mandy manually input the data into an Excel workbook, cleaned the data for consistency, and uploaded the clean versions into Tableau to create interactive visualizations. Similarly, Bryan extracted and cleaned data from the FBI’s UCR website and reporter Tara Rosenbaum’s Westchester/Hudson Valley Hate Crimes Database, converted the data into Excel spreadsheets that could be ingested by Tableau Prep, and used the data to investigate specific instances of hate crime reporting discrepancies at the local, state, and federal levels.

Tableau allowed us to create a variety of visual idioms that simplified tens of pages of datasets into colorful, user-friendly graphs with a range of visual channels including gradients that highlighted quantifiable variations. Users are able to hone in on individual data points within the visualizations, which is sometimes linked to other graphs, while simultaneously viewing all the aggregate data. Through trial and error, we were able to create a variety of tables that highlighted different aspects of our different datasets (Figure 1).


Figure 1: Tableau visualizations

Brian used Excel for his visualizations. Though it is more straightforward to use, Excel lacks the flexibility of changing the visual channels of data and is far less useful and sophisticated than Tableau. Tableau made it easy to create and manipulate different kinds of idioms, while Excel lacks any kind of interactivity. Still, Excel was helpful in the creation of new – albeit simple – charts that could effectively express less complex data points (Figure 2).

Figure 2: Excel graph

We used Canva to create the rest of our visuals. Of all the services that were suggested to us, we found that Canva was the most user-friendly and eye-catching platform for successfully creating the kinds of visuals we wanted for this project. It was also the easiest to access, as we could easily sign up for a free trial upgrade that gave us full access to the tool – something that other platforms did not seem to easily offer. We created our own set of visuals based on the research we had conducted and agreed to use a fairly subdued palette of black, white, grays, and red (for the most part). Canva’s attractive and easy-to-use templates made designing our visuals much easier, and we were able to use a mix of Canva’s graphic elements (Figure 3) and elements imported from Excel files.


Figure 3: The first and final draft of the same infographic; Canva made editing and transforming this data easy and fun to manipulate

We considered the principles of expressiveness and effectiveness when designing our visuals. Our visuals are expressive in that they visualize the facts in a clear and accurate way, with many explanatory notes to fully contextualize the data. To create the Tableau graph of aggregated hate crime data, color gradients, clear labeling, and clarifying details were included to ensure that the data can be accurately and easily interpreted. It is important to see each group’s individual statistics and compare them all against each other, so two different charts addressed each of these goals. A line chart and a bar chart of the same statistics were made to show different ways of visualizing disparities among the groups, and the dashboard links these two graphs to make these comparisons even clearer. For data points that could not be visually expressed, explanations were included. For example, there are no “Anti-Arab” crimes from 1996 to 2015 because data was not recorded for this group until 2015, so that is denoted on the first table.

Similar principles were considered in creating the static graphs. For example, the “Law Enforcement’s Failure to Report and Record” slide uses a bar graph to show how many U.S. government agencies reported their hate crime data to the FBI and, of those who reported, how many agencies reported no hate crimes in their jurisdiction. A year-by-year breakdown of these figures is provided in a separate table, proving that the apparent decrease in reported hate crimes is from a decrease in hate crimes but an increase of agencies that did not report any hate crimes. These tables display information that underscores important themes in our narrative: most government agencies do not keep good records of hate crime reports, and these agencies often fail to send them to the FBI even when they do keep good records.

We sought to create effective visuals through identity channels such as size and color; specifically, we increased font sizes, bolded words, and tweaked the luminance and contrast as needed to make the graphics more readable and visually engaging. Colors were crucial to distinguishing the datapoints in the Tableau tables while also making them more visually impactful. Linking data created a “pop-out” effect, highlighting the data that someone clicks while graying out the other datapoints. On the  “Law Enforcement’s Failure to Report and Record” chart, the most significant piece of data – that most agencies report zero hate crimes – is given the largest bar on the graph and encoded with the brightest color to create a pop-out effect. Finally, we used consistent design elements throughout the visuals, such as highlighter-style markings, to help strengthen the unity narrative (Figure 4).


Figure 4: Infographics with the same highlighter motif

There are many advantages as well as disadvantages to using graphs and textual visuals as tools for storytelling and communications. If you are trying to present number-driven data, the average user is likely to feel overwhelmed or bored by rows of monotonous text and numbers. An interactive dashboard or colorful pie chart can communicate this data and its analysis in a simple yet dramatic manner, visualizing abstract ideas in a way that illuminates trends and discrepancies that may not be obvious (or interesting) otherwise. If done properly, these visualizations can present data in a memorable way that may change someone’s way of thinking about that topic. Furthermore, this mix of visualizations can help complement and reinforce the data that is being presented. For example, the data presented in the “Law Enforcement’s Failure to Report and Record” graph is very simple compared to the voluminous data presented in the Tableau interactive visualizations, which give nuance to how this story is being told. Collectively, they share different aspects of the complexities of hate crime data collection that highlight the many flaws in this system.

What these visualizations cannot do, however, is provide specific context that would help humanize these numbers and facts. Interviews with survivors, social justice groups, and law enforcement would add much-needed nuance to this project and perhaps some answers to questions that were unable to find the answer to, such as: what prompted the name changes and additions to “Race/Ethnicity/Ancestry?” Are Asians less likely to report hate crimes than other groups? What exactly is the FBI doing to encourage (or enforce) the reporting of hate crime data?

Though they aren’t capable of conveying the enormity of someone’s lived experience, we hope that our information visualizations tell a clear story about how problematic the FBI’s hate crime data is, how it disadvantages minority communities like Asians, and how we should be more critical of federal datasets that may not be telling the full story.

ARTICLE REFERENCES:

Chen, J. (2017, February 17). First-Ever Tracker Of Hate Crimes Against Asian-Americans Launched. NPR. Retrieved from https://www.npr.org/sections/codeswitch/2017/02/17/515824196/first-ever-tracker-of-hate-crimes-against-asian-americans-launched

Federal Bureau of Investigations (FBI). (n.d.a).  FBI – About Hate Crime Addendum 2012. Retrieved Jun 16, 2020 from https://ucr.fbi.gov/hate-crime/2012-addendum

Federal Bureau of Investigations (FBI). (n.d.b).  FBI – Hate Crime. Retrieved Jun 16, 2020 from https://ucr.fbi.gov/hate-crime

Mathias, C. (2020, May 23). Study: White Supremacist Groups Are ‘Thriving’ On Facebook, Despite Extremist Ban. Huffington Post. Retrieved from https://www.huffingtonpost.ca/entry/facebook-white-supremacist-groups-tech-transparency-project_n_5ec82f17c5b6423c5ca9aa94?ri18n=true

Schwencke, K. (2017, July 31). Confusion, fear, cynicism: why people don’t report hate incidents. ProPublica. Retrieved from https://www.propublica.org/article/confusion-fear-cynicism-why-people-dont-report-hate-incidents

Shanmugasundaram, S. (2018, April 15). Hate Crimes Explained. Southern Poverty Law Center. Retrieved on Jun 16, 2002 from https://www.splcenter.org/20180415/hate-crimes-explained

Thompson, A. & Schwencke, K. (2016, November 15). Hate crimes are up – the government isn’t keeping good track of them. ProPublica. Retrieved from https://www.propublica.org/article/hate-crimes-are-up-but-the-government-isnt-keeping-good-track-of-them


VISUALIZATIONS:
(Links will open a PDF file)

Final Presentation (all files combined)

Individual vis:

Introduction

What is a hate crime?

Hate crime definition: clarification

Different definitions of hate crimes

A Brief History

Race/Ethnicity/Ancestry

What does this hate crime data look like?

However…

The FBI’s Data Sources

Breakdown of the Numbers

Police Bias in Defining Crimes

Reasons for Police Misreporting

More Reasons for Police Misreporting

Law Enforcement’s Failure to Report and Record

Problem States

Anti-Asian Hate Crimes: 2018 Spotlight

Highlighting data inaccuracies: victims aren’t reporting

Why do victims choose not to report hate crimes?

The aftermath of a hate crime

Effect on the Victims

A History of Fear

Recent Anti-Asian discrimination

Conclusion

Address the Reporting Gap/Create Your Own Database

Tips for Bystanders


REFERENCES FOR VISUALIZATIONS:

Bibliography (Choie)
Bibliography (Mayne)
Bibliography (Wood)

UBC’s Efforts Towards Sustainable Operations and Infrastructure

In 2010 the University of British Columbia (UBC) formed the UBC Sustainability Initiative (USI) as a means of bridging the gap between its efforts towards greater environmental, social, and economic sustainability both on and off campus. Described as a “curator and facilitator of a wide breadth of sustainability programs and activities across campus” a significant challenge for the unit is how best to communicate these efforts to support knowledge development and encourage behaviour change.

This challenge is not unique to UBC. Post-secondary institutions as a whole need to consider how best to translate scientific knowledge to varied audiences to increase familiarity with processes, goals, and strategies that support sustainability (Adomßent, 2013, pp.11-12). This ‘knowledge transition’ has been cited as a key component of social change, as it develops awareness of the environmental, social, and economic challenges at hand, while further illustrating possible solutions (Biermann, 2004, p.3).

In an effort to communicate UBC’s efforts towards sustainability, a series of static infographics have been developed, using a narrative approach with explorative characteristics to distil data and research into a format that is easily understood by a general audience, while further presenting this data through charts that are understood by an audience with scientific knowledge. This audience might include UBC students, staff and faculty, as well as external funders and key university stakeholders. The development of static pieces ensures that they can be easily replicated and distributed both digitally and in print.

DATA SET
USI produces UBC’s Annual Sustainability Report – a document outlining the University’s efforts and achievements towards sustainability from each preceding year. Units across the Vancouver and Okanagan campuses provide data that is distilled into one excel file and used to inform the development of charts, tables, and key achievements throughout the report. This file features data resulting from a wide range of activities including those connected to teaching and learning, operations and infrastructure, and the campus communities, with results organized by category and year. Quantitative data was drawn from this file for use in the infographics.

Given that the file is compiled with data from various units within multiple campuses, there are inconsistencies in the presentation of datasets, specifically between those provided by the Vancouver and Okanagan campuses. Several datasets are compiled on a single tab, with multiple levels of headings, and some tables include a combination of numbers formatted generally and as percentages. Complicating the wrangling of data is that several data points are linked via equations to other data points presented in the same tab.

Data wrangling was therefore a first significant step to remove extraneous data and create more consistency in data for analysis. Multiple levels of headings were translated into additional columns and all data pertaining to information outside the scope of the infographics was removed. This process clarified what visual encoding to use to present quantitative data, whether as a chart or a stand-alone key achievement.

Qualitative data was drawn from the narrative of the 2018/19 Annual Sustainability Report. This narrative reports on key initiatives undertaken by the Vancouver and Okanagan campuses that, in part, inform results presented through quantitative data. Sections of the report that relate to the scope of the infographics were reviewed and salient information used to inform the narrative of the infographics.

TOOLS
Microsoft Excel, as well as Adobe Illustrator and InDesign were used to create the infographics.

Microsoft Excel | Given the nature of data being collected and the intent to represent it statically, Microsoft Excel offered enough features to wrangle data with minimal complication. Its tabular layout further aligned with tools used to develop charts in Adobe Illustrator.

Adobe Illustrator | Charts were developed and illustrations adapted from originals sourced from the Noun Project using Adobe Illustrator. The ability to shrink and expand vectors created through the program supported the ability to replicate their use in print and digital formats. The program further offered chart-making tools, which facilitated the creation of accurate graphs.

Adobe InDesign | Given its ability to produce both print and digital outputs, the final infographics were produced using Adobe InDesign. The program allowed for rich formatting of text, colour, and graphics, which ensured a high degree of control over how both qualitative and quantitative data was presented.

ANALYSIS
In reviewing both qualitative and quantitative data, a narrative curve involving the intentions, actions, and results of UBC’s efforts towards sustainability became evident. Intentions included the University’s goals to address key contributors to climate change at the Vancouver and Okanagan campuses. Actions included the University’s efforts towards these goals, as outlined through qualitative data drawn from the narrative of the 2018/19 Annual Sustainability Report. Results included the output influenced by these efforts, as presented via quantitative data provided to inform the development of charts, tables, and key achievements throughout the report.

The proposal for this project included the creation of two infographics, one for energy emissions and water use, and another for transportation and housing. However, during data analysis, it became evident that each energy emissions, water use, transportation, and housing involved enough independent data to inform the creation of four separate infographics. The combination of such would likely confuse the narrative and require audiences to sift through data related to each subject. As a result one infographic was prepared for energy emissions and another for water use. By separating these subjects, it was further possible to present data pertaining to both the Vancouver and Okanagan campuses equally, rather than favouring one campus in the presentation of its data over the other.

A narrative approach was employed to reduce the need for interpretation among a general audience. However, expressive characteristics were further incorporated into the final designs for members of this audience with some degree of scientific knowledge. This combination of narrative and expressive approaches endeavoured to create pieces that were versatile and readily disseminated without additional adjustment.

DESIGN PROCESS
Forming the foundation of the design was adherence to USI branding, which included application of its green colour palette, as well as font selection that echoes UBC brand guidelines. This both branded the infographics as a product of USI while ensuring visual cohesion and consistency among each piece in the series. Each infographic is presented in a landscape format that can be uploaded to campus digital screens as well as printed for individual distribution. The provision of a format replicable in digital and print allows for greater flexibility in the dissemination of the infographics both on and off campus.

FIGURE 1: USI COLOUR PALETTE

The USI colour palette featuring three hues of green

FIGURE 2: UBC FONTS

UBC fonts including Guardian Egyptian and Whitney

A portrait format for each infographic was additionally originally proposed for web use. Given the static nature of these pieces, they ought to be updated annually to remain current. With that in mind, they are better suited for display on static digital viewing platforms and in print than on web platforms, where data can be more easily updated and information more dynamically and interactively visualized. Given that a static representation online does not leverage online capacities for information visualization, it was decided to focus on the landscape format alone.

Following the principles of utility, soundness and beauty, illustrative components were limited to those either intended to identify qualitative data, or to visualize quantitative data. Specifically, vector illustrations were used to draw attention to the presentation of qualitative data, which consisted of short narratives related to key efforts towards addressing university goals. Given that quantitative data consisted of time series, simple bar graphs were selected to visualize the comparison between GHG emissions per year and water use per year. Extraneous elements were avoided in the presentation of these graphs to draw focus to the overall trend of data for each set rather than drawing attention to individual measurements within a set.
The overall layout of the infographics conformed to western reading standards. Starting with a description of UBC’s goals related to each subject in the top left hand corner of the page, the eye follows a ‘Z’ pattern across narratives outlining key efforts to achieve these goals, then downward to the bottom left corner and across results influenced, in part, by the above efforts. Colour was used to distinguish qualitative data – presented through goals and efforts – from quantitative data – presented in key figures and charts.

FIGURE 3: SKETCHES

Preliminary hand drawn sketches of infographics

These decisions came about as part of an iterative process starting with consideration of the narrative arc. What followed was the development of concepts in the form of sketches, then the creation of individual components required – including vector illustrations, charts, and text blocks – to the arrangement of these components in the final digital layout. The preparation of sketches at the outset facilitated fairly quick construction of individual components into the final digital layouts.

NARRATIVE
The narrative arc presented in these infographics is that of UBC goals, key efforts to achieve these goals, and results influenced, in part, by these efforts for both energy emissions and water use at the Vancouver and Okanagan campuses. The intent of such was to highlight UBC’s goals, efforts, and achievements towards sustainability, as a means to transfer this knowledge to general audiences while further suggesting what kinds of efforts contribute to tangible results.

Employing a primarily narrative approach, these infographics sought to share information and data without need for interpretation. Targeted to general audiences, the final pieces were created so that both individuals with and without a scientific knowledge could find information and data that resonates with them. To reach more general audiences, this involved simplification of some concepts and terminology used in narratives informed by the 2018/19 Annual Sustainability Report.

REFLECTION
Employing a narrative approach in the design of static infographics allows for the presentation of information and data in a format that can be easily interpreted by general audiences without need for further analysis. Adherence to USI brand guidelines – including colour and font selection – supports brand recognition while creating visual cohesiveness and consistency among pieces in the series. This resulting infographics carry a uniform message about UBC’s goals and efforts towards sustainability and the results of such.

However, as largely promotional pieces, they do not encourage critical review of these goals, efforts, and results. While the two infographics present data pertaining to environmental sustainability, they do not encourage room for interpretation or assessment of this data in relation to efforts beyond that of the university. Moreover, the static presentation of this data requires manual updating annually. While suited for the sake of increasing knowledge of and engagement with these topics among general audiences, these pieces would not be appropriate to share with practitioners in the field of environmental sustainability for greater analysis.

INFOGRAPHICS
The following are the final iterations of the infographics.

FIGURE 4: ENERGY EMISSIONS INFOGRAPHIC

Infographic featuring UBC energy emissions

FIGURE 5: WATER USE INFOGRAPHIC

Infographic featuring UBC water use

REFERENCES
Adomßent, M. (2013). Exploring universities’ transformative potential for sustainability-bound learning in changing landscapes of knowledge communication. Journal of Cleaner Production, 49, 11–24. https://doi.org/10.1016/j.jclepro.2012.08.021

Biermann, F. (2004). Knowledge for the sustainability transition. The challenge for social science. In F. Biermann, S. Campe, & K. Jacob (Eds.), Proceedings of the 2002 Berlin Conference on the Human Dimensions of Global Environmental Change: Knowledge for the Sustainability Transition, The Challenge for Social Science (pp. 1-11). Amsterdam (www:glogov.org): The Global Governance Project.

Hello InfoVis/VA Class!

If this is your first time using UBC Blogs, please check the instructions here on how to use this site to post a Blog Article. It is very simple to use and in 10 minutes you can get started writing your own Blog Article for your Term Project.

The view below is a simple embedding of a view that I published in Tableau Public, using the
Method 1 (Embed code: if you can paste HTML and JavaScript code directly into a website with HTML pages) that I included in the instructions published in Canvas for embedding Tableau products in websites