Summarize Percent Change Analysis
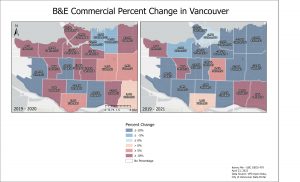
There was a notable trend of B&E Commercial increase in 2020 (Lockdown) all around various neighbourhoods. The increases all bordered major roads, streets, and major urban neighbourhoods like Downtown, Kitsilano, Arbutus, and Victoria-Fraserview. There was a general decrease in B&E Commercial in 2021 except in West Point Grey, Arbutus Ridge, Victoria-Fraserview, and Killarney.
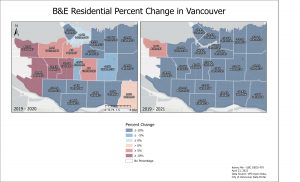
There was a decrease in 2020 for B&E Residential in the right side of the city while the left side of the city saw an increase. 2021 had every neighbourhood except West Point Grey decrease in B&E Residential.
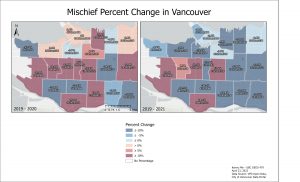
2020 Mischief percent change were slightly mixed, however it does resemble the change observed in B&E Commercial 2020 as Mischief border several central hub areas in the city. In 2021, Mischief saw a general decrease. A notable increase of Mischief was seen in Shaughnessy.
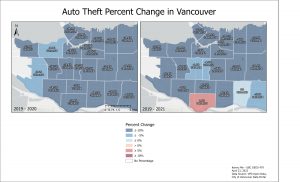
Auto Theft in 2020 decreased significantly in all neighbourhoods in Vancouver. Largest decrease was in Downtown. The decrease in Auto Theft mirrored in 2021 except in Marpole.
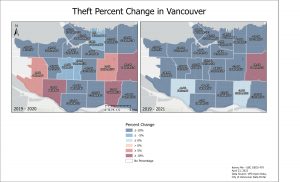
Theft in 2020 generally decreased except a notable increase in Renfrew-Collingwood. Theft in 2021 decreased in all neighbourhoods except in Renfrew-Collingowod again. Because Theft increased in Renfew-Collingwood in 2021 and was further significantly increased in 2021, this might not be due to chance.
Average Nearest Neighbor
B&E Commercial (2019/2020/2021)
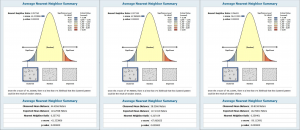
B&E Residential (2019/2020/2021)
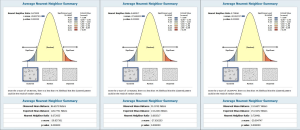
Mischief (2019/2020/2021)
Auto Theft (2019/2020/2021)
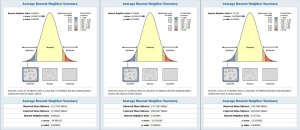
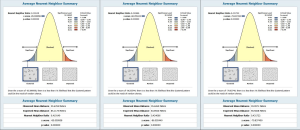
Theft (2019/2020/2021)
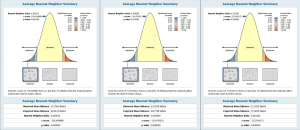
Every single Average Nearest Neighbor results showed that there’s a cluster that exists within the distance relationship of crime data. We observed these clusterings by examining the z-scores that were significant. The result would be significant if lower than -2.58. To note, the general trend of the z-scores over the years show an increase (slightly less clustered in following COVID years). The exception was in B&E Commercial and Mischief in 2021 where it the z-score decreased further (slightly more clustering).
Kernel Density
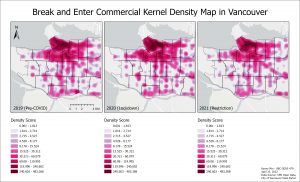
For B&E Commercial, there was an increase in the cluster density in Downtown, Kitsilano, Fairview, and Mount Pleasant in 2020. Most of the cluster patterns were bordering major roads and neighbourhood boundaries.
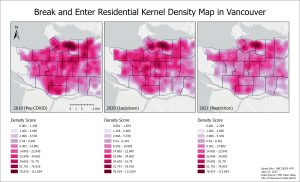
For B&E Residential, there was a slight decrease in cluster density bordering Downtown and Strathcona in 2020 and general decrease in density in 2021.
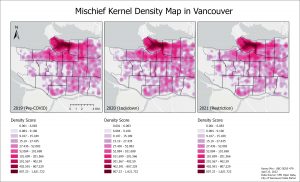
No notable change over the years for Mischief. The cluster patterns mirror B&E Commercial in bordering major roads and neighbourhood boundaries, only slightly more dispersed.
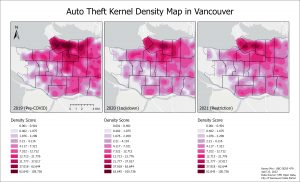
Auto Theft in 2020 decreased in cluster density all around the city and significant decrease around Downtown, Grandview-Woodland, West End, and Mount Pleasant. 2021 had slight further decrease.
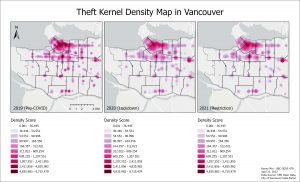
Theft in 2020 decreased generally in cluster density. The overall pattern of Theft all border major roads and boundaries.
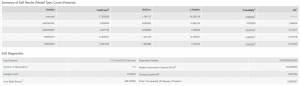
Regression
Generalized Linear Regression
2019
2020
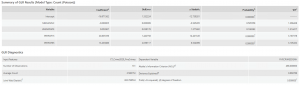
2021
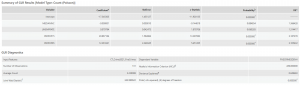
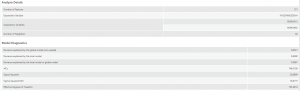
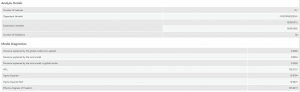
Like stated in the methodology, for the regression analyses, the crimes were bundled into one field under five crime types. All three years of GLR Results showed significance in the normalized population age 15~64 and normalized population age 65+ variables. Only GLR in 2019 included unemployment rate as a significant variable (0.036 Probability score). Median Income variable was not significant in any years of GLR results. The significance for these variables be observed by examining the Probability column and scores. The Akaike’s Information Criterion (AICc) can be used to compare regression models and lower AICc score provides a better fit to the data. The AICc score decreases during 2020 and 2021. The r-squared value that is resulted from the GLR model of Continuous (Gaussian) is missing here. Since we had the had the discrete normalized count crime data in each CTs, the GLR model Count (Poisson) was used instead. Because of this reason, the r-squared value was replaced with Deviance Explained. They both convey a similar goodness of fit and Deviance Explained is often part of the r-squared value. The actual value remained almost same over the three year period of 2019, 2020, and 2021 (0.66, 0.66, 0.65 respectively).
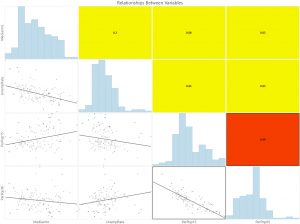
For additional information, this chart of relationships between only the explanatory variables was created. The two population variables showed the highest r-squared value of 0.66 and showed a negative relationship.
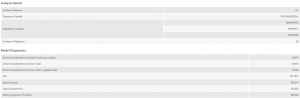
Geographically Weighted Regression
2019
2020
2021
After removing non-significant explanatory variables by conducing the GLR, GWR was performed. The Deviance Explained for the local model increased to the 0.8 range from the 0.6 range of the Deviance Explained in the global model. The AICc decreased in 2020 and increased slightly in 2021, but still less than 2019.
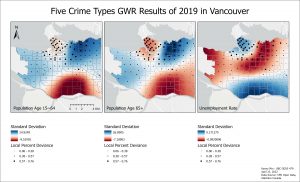
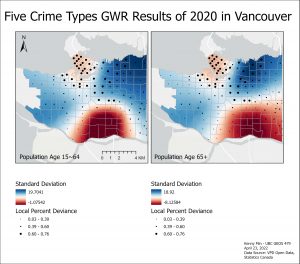
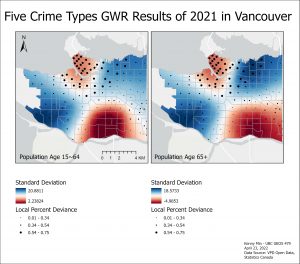
The GWR map for the variable population age 15~64 remain similar over 2019 and 2020 except in 2021. The highest point of Standard Deviation switches from the top right side of the map near Strathcona to the bottom left side of the map near Dunbar-Southlands. The slight formation of this high Standard Deviation can be observed in the 2020 map. There is a negative relationship or independence of low Standard Deviation that develop over the years in the West End and in Downtown. For population age 65+ variable, similar high point of Standard Deviation appears over the years in the lower left side of the map near Kerrisdale. The negative independence relationship in the West End and Downtown region in 2019 weakens in 2020 but becomes stronger again in 2021. Interestingly, the unemployment variable that was solely applied to the 2019 GWR due to its significance only for that year, has an inverse relationship compared to the other two explanatory variables. There is an independent negative relationship measured by Standard Deviation rage in the middle parts of the city while there is a positive high Standard Deviation in the West End, Downtown, and Southern regions of Vancouver. The Standard Deviation range is significantly smaller in the unemployment rate variable than the other two variables.