GEOB270 enabled me to gain a solid first experience with ArcGIS. It taught me how to organise, parse, filter and mine different data in order to focus my analysis on the key elements which I want to portray in a final map. Most importantly, the labs of this thorough introduction class to Geographic Information Science allowed me to understand the important basic analysis tool of ArcToolBox which enabled me to carry a thorough analysis of the different layers in my final project to ultimately construct 4 different maps, each with a different and focussed message but which could be easily compared to each other.
Personal Experience Toward Final Project
My team’s project was to analyse crimes around Schools in different neighbourhoods of West Side Vancouver in 2015. To do so the group acquired data from the online Open Data Catalogue of the City of Vancouver,and from the database of the Geography Department of the University of British Columbia. In order to carry out the analysis, our group compared crime occurrences around schools to overall crime within individual neighbourhoods, as well as to our entire targeted project area, and moreover evaluated the results to the different relative number of schools in each of the 12 targeted neighbourhoods. The organisation of the project was very fluid; each team member took on a more focussed jobs (Map making, FlowChart drawing, Uncertainty analysis) yet, the overall flow of the analysis was carried out together as a team, in the lab, as well as outside through constant communication between each members and regular updates on the advancement of the work. Such effective communication enabled our group to come to the consensus that our original project proposal had to be altered. Indeed, our original idea of analysing the impact of urbanisation and human activities on Wild life species around Vancouver was short-ended and few data was available. Consequently, our team quickly refocused and promptly found another topic of interest; that of mapping out the relative safety for children to attend school in different neighbourhoods in the West Side of Vancouver.
As a matter of fact, acquiring the data was rather easy. Analysing the data and summarising it was more challenging. The tools of Clipping, Intersecting and Buffer from the previous labs in the course were very useful to target and focus our analysis. Furthermore, the tool of “Summarise” in the layers’ attribute tables were perhaps the most important for our analysis as they enabled summarising crimes per neighbourhood and permitted the calculations of the different percentages required for 3 out of 4 of our maps through the Field Calculator. Moreover, by joining tables with layers, and creating new data frames the group was able to carry out precise comparison of the different data that was calculated through the analysis with ArcMap. Many steps were required to achieve different final maps, and this project did confirm that organisation in Geographic information Systems is crucial. Naming layers, creating Summary Output tables, adding fields, and joining tables can quickly become confusing if layers are not probably organised and named. Thankfully the team was effective in organising its work which rendered the final analysis of the large amount of information we build up easier and more focussed.
Final Submission of Project: gis_final_project
Flowchart of analysis: flowchart
Environmental impact assessment, Garibaldi, Squamish
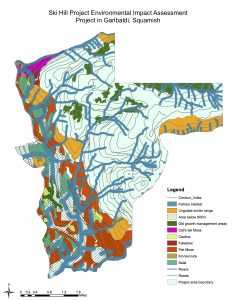
The following environmental impact assessment for Northland Properties and Aquilini Investment group of Vancouver, focuses on the proposed project of a year round destination mountain resort on Brohm bridge. With a total project area of 54,717,275 m2, located on Highway 99, 80 kilometres north of Vancouver and 45 kilometres south of Whistler, the ski resort project commonly referred to as the Garibaldi to Squamish Project would consist of 124 ski trails, 21 lifts and will involve accommodation as well as commercial developments.
Produced for the project proponents, and constructed in response to the critics advanced by Whistler in a 14 page letter, and by the BC Environmental Assessment Office, this document, its analysis and accompanying map of the project, aim to work towards developing a strong argument supporting the development of the project, evaluating criticisms, and make recommendations regarding what are the priorities in order to proceed with the proposal and what are the main issues to be addressed and their possible solutions, as well as the more minor details which even if less critical still need to be taken into consideration.
Data was gathered from DataBC, a central spatial warehouse for data, applications and geographic services in British Columbia, and from the BC Government, which was provided by the department of Geography at the University of British Columbia. In order to analyse the data, the different layers: Ungulate Winter Range, Old Growth Management Areas, Ecosystem mapping, Elevation model, Parks and protected areas boundary, roads, rivers, and 20 m contours, were all added together in the geographic information system software ArcMap. The different layers were made to all be in the same projection. The data was parsed: structured and categorised for organisation, and filtered; for instance all of the layers were clipped (cropped) to fit only the project boundary in order to isolate information and target our analysis to the desired area of the ski hill project in order to determined the feasibility of building a ski resort in that area.
Determining the feasibility of building the ski resort — Questions of interest:
- Will there be enough snow in the area?
- Percentage of total project area lower than 600m vertical = 8%
- More than two thirds of the project area is above 600m, which makes the ski resort an appropriate place for skiing, knowing that most of the slopes will certainly located at higher elevation
- Is the resort easily accessible by roads?
- As observed on map, roads provide access to higher levels up in the mountain
- How much percentage of the project area falls into protected areas?
- Sum of individual protected Areas, percentage of total project area = 65,74%
- Protected Areas, percentage of total project area (corrected for overlapping) =68%
- Old growth management area (old growth forest), percentage of total project area = 78%
- Ungulate Winter range areas (Mule Deer and Mountain goat), percentage of total area =88%
- Endangered Ecosystem (Red-Listed Ecosystem Area), percentage of total area = 83%
- Percentage of Falsebox in project area= 0.54%
- Percentage of Salal in project area=5.38%
- Percentage of Cladina in project area= 1.49%
- Percentage of Kinnikinnick in project area= 0.33%
- Percentage of Flat Moss in project area= 15.99%
- Percentage of Cat’s-tail moss in project area= 1.10%
- Fish bearing (Riparian zones), percentage of total area =28%
What are the two greatest environmental concerns to project development and are there ways to mitigate them?
By looking at the results of the environmental assessment analysis and at its resulting map (MAP 1 – overleaf), it is possible to figure that one of the main environmental concerns of the project’s development is the percentage of endangered red-listed ecosystem area, which is 24.83%. However, it is important to note that when looking at the map it is possible to observe that in fact, most of the red-listed ecosystem areas are below 600 m. The second major environment concern is the percentage of Riparian zones (fish bearings) in the area, which is 26.28%.
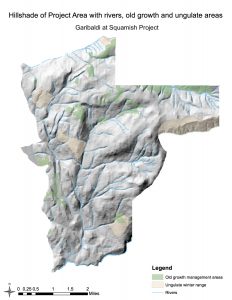
One way to mitigate these environmental concerns, and thus to promote the development of the project would be to avoid those areas when developing accommodation and commercial planning; by, for instance, concentrating constructions and the ski resort to areas above 600 meters; a potential area representing more than 68% of the total project area in Garibaldi, Squamish and which already has roads for access. As a result, this would not only prevent harm to red-listed species, which are mostly concentrated below 600m (Map 1) but it would nullify Whistler’s criticism that the Skill Hill Project is located too low in elevation. Furthermore, if the proponents make sure that the project includes environmentally harmless sewage and evacuation systems for waste and toxic materials, then the riparian zones should not be affected negatively. Indeed, other than the potential effects of pollution, skiing activities are usually not concentrated near streams. The priority in order to proceed to the proposal is to select more precisely the specific areas where the project will be built in order to avoid areas below 600m, avoid wildlife habitat, and red-listed species areas, and thus to show to the BC Environmental Office that the project area will have a limited impact on vegetation, fish and wildlife habitat. In addition, when analysing the hillshade of the project area (Map 2 – overleaf) it is further possible to show that large areas of the mountain above 600m does not include Old growth forest areas nor Ungulate Winter Range (Wildlife) and that the project area thus holds serious potential in developing a ski resort project.
Housing Affordability
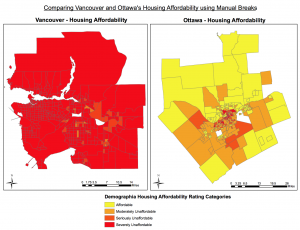
In order to measure affordability we need to normalise the housing cost data by household income. People in larger cities tend to have higher incomes than people in smaller cities, so if we normalize the cost of housing by income for any city, we have an affordability index that makes it more accurate to compare cities of different sizes and income brackets regarding ‘affordability’.
The housing affordability rating categories calculated using the Median Method are as follow:
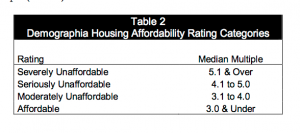
Affordability is a better indicator than housing cost of a city’s livability as it takes into account cost in relation to income.
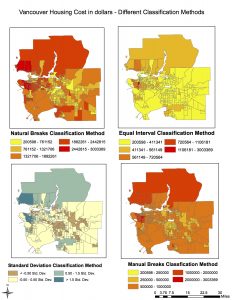
Quantitative Data Classification
As a journalist, I would use the Manual Breaks Classification method in order to get the most accurate representation of housing cost in Vancouver. This would enable me to emphasise how expensive housing costs are in Vancouver and would enable to create more sensationalism about the topic.
If I was a real estate agent preparing a presentation for prospective house buyers near UBC I would use the Equal Interval Classification method. Indeed, since my aim is to sell as many houses as possible, I would use the equal interval to make housing cost look more uniform in Vancouver. This would make housing cost near UBC look more affordable, and thus be able to make clients focus on the social advantages and safety of living near UBC, and differentiate the area compared to other places in Vancouver.
Some ethical implications could be brought up regarding data distortion and/or data manipulation.
Accomplishment Statement Lab 1-5
The accomplishment of five labs in GEOB 270, Introduction to Geographic Science, provided a thorough introduction to the different skills necessary in order to carry out effective and constructive analysis of different case scenarios in the field of geography and beyond. Beneath is a list of accomplishment statements achieved at the end of each respective lab.
Lab1: Introduction to GIS and ArcGIS
Understanding ArcCatalog, connecting folders, manipulating layer information and understanding their content while simultaneously understanding the importance of having clearly labelled, organised layers and data files for easy transfer of spatial information.
Lab 2: Understand Geographic Data
Understanding the content of different layers, and the content found in the attributes table, and most importantly understanding the importance of coordinate system and how to correct misaligned spatial data to
Lab3:Planning for a Tsunami
Use ArcToolbox and the overlay tool to create new layers in order focus our analysis on areas, roads and facilities in the tsunami danger zone in the city of Vancouver
Lab 4: Housing Affordability
Understand the different quantitative data classifications that symbolise the data in different ways in order to manipulate the data and portray messages with different meanings for different ends.
Lab 5: Planning a Ski Resort: Environmental Impact Assessment
Learned to acquire, parse and filter data, and to evaluate as well as analyse it using appropriate tools in ArcTool box in order to construct a final map portraying an effective explanation and sending a clear message to its audience.
Using ArcMap to find total areas of danger and facilities prone to tsunami danger
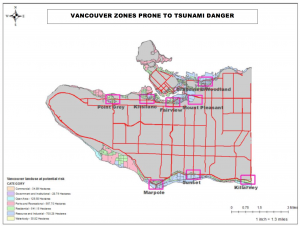
What percentage of the city of Vancouver’s total area is under danger?
15.5% of the City of Vancouver’s total area is under potential danger. In order to determine this percentage several steps are required. Firstly, it is necessary to find the total area of Vancouver; one way of doing this is by adding and thus summarizing the total area of different land use in Vancouver which is equal to 131 020 600 m2. Once the total area of Vancouver has been determined, the next step is to calculate the total area of land use that is at potential danger of a tsunami. By using Geographic Information System, and specific tools in the software ArcMap, it is possible to extract the different land uses that are in danger and to summarily their total areas to find out that 2 0303 078 m2 of land use in Vancouver in at risk. Finally, the last remaining step is to calculate what percentage this represents and to find that the land use in danger represents 15.5% of Vancouver.
List the healthcare and educational facilities within the Vancouver danger zone, if any explain how you came up with your answer
By using the ArcMap Software, it is possible to overlay different layers to find specific desired information. For instance, we can use the software to find out which education and healthcare facilities are located in danger zones prone to risk to tsunamis; i.e. 1km offshore and below 15 metres. By allowing overlaying of such different layers it is thus possible to find that the following facilities are in the Vancouver danger zone:
Healthcare facilities in Vancouver danger zone:
- False Creek Residence
- Broadway Pentecostal lodge
- Coast West Community home
- Yaletown House Society
- Villa Cathay Care Home
Education facilities in Vancouver danger zone:
- St Anthony of Padua
- Ecole Rose des vents
- Heritage 3R’s School
- False Creek elementary
- Emily CARR institute of art& design (ECIAD)
- Henry Hudson Elementary
- St John’s International
- St Francis Xavier
- Institute of Indigenous government (IIG)
How to fix misaligned and improperly referenced spatial data?
In the field of Geographic Information Science and especially when using the software ArcMap, it is important to pay particular attention to the different coordinate system used when adding different layers to your map. For instance, distance, and other properties such as shape, true direction and area are affected when the data is projected into a different coordinate system.
Nevertheless, when using ArcMap, the process of project-on-the-fly temporary changes projection settings to align with the existing layers. If those existing layers were not in place the projection would look much different.
Nevertheless, it is possible to solve this by using ArcToolbox project. Through this software’s Transformation commands it is possible to change map projection permanently in order to make the projection more accurate and to adjust all layers to the same coordinate system.
Advantages of using LANDSAT
First launched in 1972, Landsat data provides a repository of raster data imaging of the world, in approximately 16 day intervals. The dataset provided by the passive Remote Sensing can be crucial to geographic analysis focussed on comparing Land use.
Analysis of repeat photography can be a powerful geomorphic tool, allowing one to calculate the rate and distribution of surface processes. An example where Landsat data would be useful for geographic analysis is to assess the impact of artisanal mining on deforestation in the Peruvian Amazon rainforest; where it would allow the comparison of aerial photography each year to assess the rate of deforestation.