E-Portfolio | Daniel Minney

Quantitative Data Classification and Housing Affordability in Vancouver, BC

Posted by in Geographic Information Systems

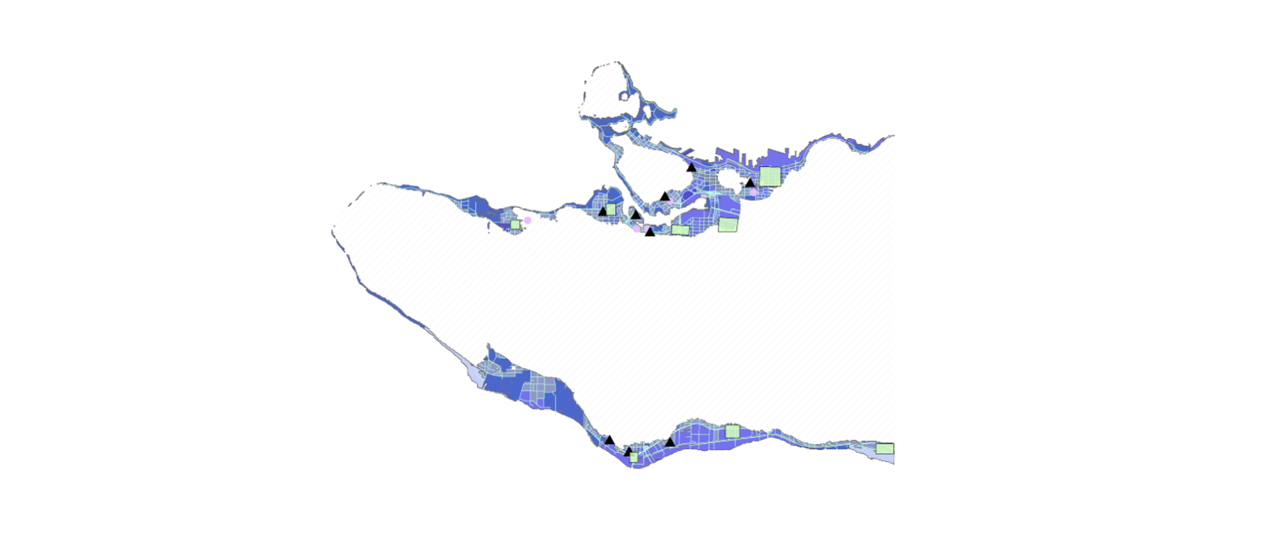
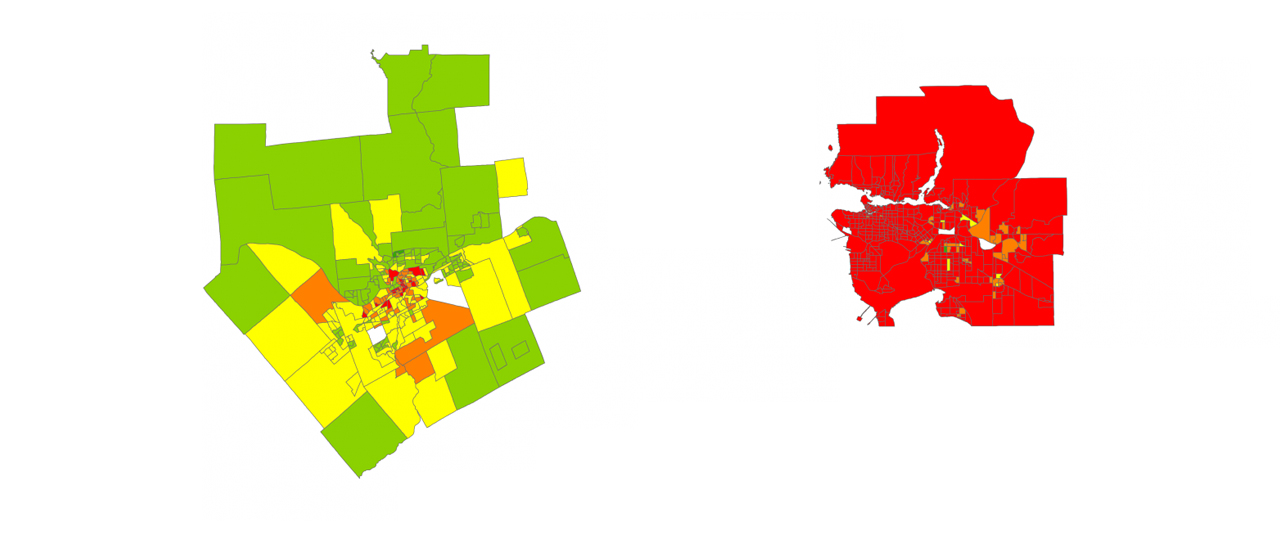
Summary The four maps use different classifications to display median dwelling cost in Vancouver, BC. As a journalist a natural breaks map would be good at displaying how expensive Metro Vancouver without distorting the breaks. A real estate agent may want to use a map showing manual breaks as it presents the information as easy to understand with clear breaks. Different classification methods can be used to visually trick people into thinking areas are cheaper than they appear. For example, if you were to use an equal interval map, it…read more

Identifying Tsunami Risk in Vancouver, BC

Posted by in Geographic Information Systems

Summary 15.49% of the City of Vancouver’s total area would be affected by the potential threat of a tsunami. – Method used: used the attribute table to find the total area of Vancouver. For the potential affected area, obtain the sum from the attribute table and divide by the total area of Vancouver. For Vancouver’s health facilities, the following are in danger: FALSE CREEK RESIDENCE BROADWAY PENTECOSTAL LODGE COAST WEST COMMUNITY HOME YALETOWN HOUSE SOCIETY VILLA CATHAY CARE HOME For Vancouver’s educational facilities, the following are in danger: ST ANTHONY…read more

Spam prevention powered by Akismet