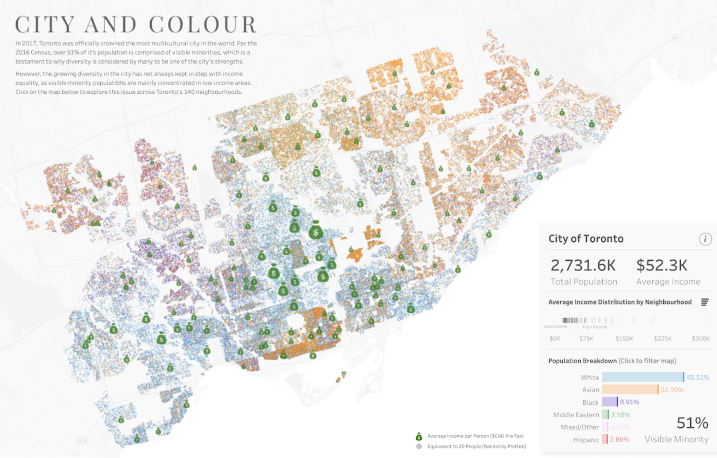
Click on the image to interact with the Tableau dashboard.
Data science is a growing field that uses big data analytics, machine learning and data mining to help improve a variety of industries. Educational services is one such industry that is expanding its use of learning analytics to improve the quality of teaching and learning. Learning analytics is already widely used in higher education to help faculty make better informed decisions and in recent years it has made inroads into the K-12 sector. This Open Education Resource, on Big Data and Learning Analytics focuses on the progress made in learning analytic tools and identifies three areas of opportunities for growth in K-12 education.
For this OER we have the following learning objectives:
1) Review the history and current landscape of big data and learning analytics.
2) Introduce key innovations in data collection and interpretation.
3) Determine opportunities and recommendations for investors in learning analytics.
Within our OER there are several activities for you to contribute your thoughts and perspectives on learning analytical tools. We have also included surveys and some discussion questions.
We hope you will enjoy our OER and find it interesting and informative.Here’s the link Big Data and Learning Analytics
Allan, Amanda, Grant & Jamie
An interesting and well designed OER, Amanda, Al, Grant, and Jamie.
I really liked how you laid it out with Past, Present, and Future, and I liked that you clearly tackled the Opportunity Forecast. The latter being an element that I’ve felt was missing in many of the OERs. Your playing card model for introducing your team also gave me a smile.
The only thing that I did not like was the opening survey, as it asked many questions (that were required in order to complete) that were not directly applicable to the topic. I suspect that you were using this to drive home a point about Big Data, but it created a feeling of unease and mistrust in me at the start of the OER. Had this not been for class that unease and mistrust may have stopped me from proceeding further.
Dear Erica,
First, our group would like to apologize to you and our other classmates for whom our survey made uncomfortable. You are correct. We were using the questions to later highlight some of the concerns surrounding data collection. We regret our questions made you and our other classmates feel uneasy.
We have removed all questions related to gender and political views. We will also delete the data we collected on these questions.
Taking your feedback to heart, we will look for other ways to bring up some of the concerns about data collection. We will explore providing similar datasets from NSSE and other international polling agencies.
Once again we apologize for the unease our survey created.
Jamie, Amanda, Allan, and Grant
No worries. It was a powerful way of making a point. I just see potential in others using this resource, and would hate to see that scaring them off.
I actually thought the survey was brilliant because it did introduce some uneasy feelings. It drove me to reflect on my own feelings personal about surveillance and see how they conflicted with what I considered progressive views about adaptive learning. It is a really interesting debate and I see both sides of it. As Erica said, it was a powerful way of making a point and I’m certainly not looking for an apology.
Well done!
Thank you Allan, Amanda, Grant and Jamie for this OER on Big Data!
I’m currently going through the course and the content is great so far, with the videos being quite informative. I do agree with Erica, however, on the survey – I understand that you wanted to demonstrate the types of questions and data gathered, but what is the purpose of questions not directly related to education (or perhaps you’re saying the way to design the optimal learning experience is to know as much about the learner/participant as possible?)
Also, I answered Long Question 1, but forgot to include my name – I’m response #4.
Hi Alice
Thank you for your feedback. As a group, we had a discussion on the opening survey, we took in how you felt and decided to remove several questions. Our intent was to create an analytical environment, to fully understand the issues pertaining to big data and privacy.
Nonetheless, we apologize for any uneasiness.
Jamie, Amanda, Allan, and Grant
Thank you Alice, We will take note of your response to the Long Question 1.
Jamie
Thanks Amanda and Jamie,
I just submitted the Long Question for Big Data and my responses seem to be an issue with the formatting in the response summary.
I hope to provide more meaningful comments once I get through the course!
I too was cynical about giving up the personal information that you requested in the survey. I am generally heedful of providing this kind of information; however, more recently I have begun to concede more information to big data. For one, I’m sure my data isn’t really all that interesting. Secondly, the reason I have become less hesitant is because I feel that big data is more likely going to be used for good (more than bad, anyways), to make things more efficient, which will lead to better use of resources. And I’m not talking only about education, but in many more global initiatives as well. I enjoyed the videos that you shared that spoke to this efficiency, and tout big data’s potential.
I also appreciate your Moneyball example, and more so the Snell examination (I’m a Dodgers fan, so it was interesting to learn that trusting analytics won us the Series). Nevertheless, what I took from this example is that we can’t rely on analytics alone, but must learn to give into our gut instincts as well. That is, even though we trust so much in silicon-based machines and what they can do for us during these split second decisions, there is still a level of carbon-based cognition that is needed. This is especially true when it comes to us as educators. There are important relationships that we have to acknowledge, and they aren’t all found in zeros and ones, but in chemistry as well.
Another interesting take away from your informative OER is that big data will likely not be used to its greatest potential for another fifty or so years. We’re only at the very beginning stages of this enormous undertaking; but it’s definitely something that will prove indispensable if we want to become more efficient with industries such as energy, health care, and education, to name a few.
Even after all that data that I gave up in your initial survey I couldn’t put it together with Google Analytics; it’s frustratingly enigmatic. Thank you for introducing the app to me though; perhaps when I have a little more time I’ll play around with it some to come up with some unexpected analytics.
Thanks for your efforts in this truly engaging OER.
Neal
Thank you for your comments Neal. Your thoughts on chemistry and human connection opened a great new facet to this discussion.
Your comments on carbon-based cognition got me thinking about some of my best learning moments with my dad. If we were fishing or fixing the car there were times I knew he saw me failing. He knew I was going to fail and let me fail so I could learn. Do you think learning analytics might be taking away an educator’s willingness to let students fail if everything in the data recommended an intervention?
Thanks again!
Hi Jamie,
Thanks for sharing this story. I think that the at the heart of adaptive learning, partly what my EMT is tackling next week, is the idea of trying, and failing, and sometimes even trying to fail just to see what happens. These are essential learning qualities.
Thanks for your comments, Neal. I came to this topic due to my own analytics experience through coaching. I have been using statistics in-game for more than 15 years (I coach volleyball), and usually find myself trusting my own instinctual “feel” for the game more than the data…but data analytic is evolving, and as the analytical tools become better and more reliable in their predictions, there is a ‘trust’ earned by the data that I can lean on more. I believe I find myself using the data to confirm my human observations and interpretations — but we are biased observers by nature, and it is hard to shift to more objective decisions…in the past few years, I have won a championship by going against the data, and I have been knocked out by going against the data (which is most painfully obvious in hindsight!).
As you have discovered, using analytics tools like Google Data Studio is a steep learning curve (and why proficient users call themselves Data Scientists). Have educators been reluctant to use analytics for just that reason, that the learning curve is so steep? Do you think that indicates an opportunity for investment and development in digital tools that are more intuitive to use and become time-savers for educators, even after accounting for the time taken to learn to use the tools? Can the time it takes for a user to learn how to use the tool be part of a calculation of ROI?
Hi Allan,
Your championship stories begs an analysis of the four possible outcomes of analytics in sports: winning using data; losing using data; winning without data; and losing without data.
As for your questions, I feel that teachers are, and really education as an institution for that matter is well behind the times that are a changin’. For education to adopt learning analytics to a level of usefulness there would have to be either a lot of professional development, or a simpler LA version; the former being very expensive and time heavy, while the latter may compromise the level to which the LA proves useful.
Wow! I really like your OER. The layout is very easy to follow, the design is great, looks very professional, and I enjoyed reading through the information. The examples you gave on the data dashboard I found it very useful. I had not used one before, and it gave me a lot of great ideas on how information could be laid out. The questions for that page were very difficult, I had to read each question several times. I quite enjoyed it because you really put a lot of thought into them, and they forced me to really interact with the dashboard and learn its capabilities. The only thing I didn’t like about it was that I had to keep scrolling up and down the page to look at the dashboard and the scroll down to answer the question. It was hard to find the right place every time I scroll up and down.
I’m still going through the website. Just wanted to leave a comment to let you know that I think it’s very well down so far! Thanks!
Hi Emily,
Thanks for you comment and feedback. We will look into the issue with the page formatting for the interactive dashboards and the quiz. I can see where you are coming from so we will try to find a way to make that less frustrating.
Having a bit of experience using dashboards in my current job and having been to a couple of big company conferences (Tableau, ESRI) on data/data analytics, I can tell you that data dashboards are extremely valuable today especially in the business world. I think there is still an opportunity for them to be utilized more in education, but it seems like it just takes some time to maneuver through some the challenges of implementing these types of tools. Not to pry too hard, but do think data dashboards could be utilized in your place of employment? If so, in what ways do you think they could provide value to yourself or to your organization?
Thanks
Thanks Grant!
I see great value in data dashboards and I am so glad you included in your OER. I am learning a lot from your OER.
I think it could definitely be used in my workplace, since we are a chain of private tutoring centers, it’s very important for us to track how each center is doing in terms of student’s academic performance and teacher’s performance as well. Now we rely on schools to send back their data, but the collecting process is very slow and filled with human errors. It would be great if everything can be shown not just as data, but a visuallization of the data.
Hi Emily, you are right that the collection process of data can be challenging (slow, time consuming, validity of data, etc.). I think this is possibly one of the issues that is holding educators back from using data dashboards and data analytic tools. Thanks for your reply!
Grant, that issue is one of the concerns that several people mentioned in one of the responses, that the time for data input is the major roadblock for using learning analytics in the classroom–the demand for a system that would automatically input the data (or take it from an SIS or gradebook program) would be pretty high, I would think.
Hi Week 10, I would like to commend you on a great OER and offer a contrasting opinion to some of my classmates here. With full respect to my classmates, I personally think those who took issue with the intro survey totally missed the point. In my opinion it was an excellent way to introduce the topic by conveying not only what big data is, but the privacy implications it has. On that note, I think my classmates who found the survey intrusive should perhaps think a little harder about why they had that reaction and apply that critical thinking not only to the tools they use in the classroom, but the applications they use in their personal lives. If you are worried about providing you age on an online survey as part of a school project, think about your students and bring that same critical eye to the teaching tools you use in the classroom (and you now, maybe consider how much personal info you feed facebook and google in your personal life…).
As for the rest of the OER I was very impressed. You presented the data in an approachable and well organized format, your activities were engaging, and the site was visually interesting without being cluttered. My only real piece of constructive feedback is I would have appreciated if the comment boxes were a little larger so there was less scrolling involved to read other responses.
If you read my comments, Adrian, you’ll see that I got the point, as I suspect did our other classmates. Part of the purpose in these Beta Testing weeks is to make these OERs stronger, so that others get use from them beyond our class. To make them stronger, as the Beta testers our job is to give honest feedback, which those of us that commented with regards to the survey were doing. No matter how powerful a point the survey makes, it doesn’t do anyone any good if you scare people off from engaging in the rest of the OER, which is why I gave the group my reaction to the survey (regardless as to whether I’d guessed at their intentions). With every start up there is always some fine tuning to be done. When Beta Testing, the whole goal is to get insights and observations from outside observers on their experience in order to do that fine tuning. Part of the beauty in the work this group has done is that they took the initial feedback they were given from the first few Beta Testers (aka the initial commenters here), discussed and adjusted the survey in a way that still works for them, while taking user experience into account. David can correct me if I am wrong, but I believe that is the whole point of this exercise.
Hi Erica,
My comment was not directed at you specifically, I was merely offering my opinion on the survey so please don’t take it personally.
I am well aware of the point of the activity which is why I was giving my feedback and opinion, the fact that our opinions differ is perfectly fine and a normal occurrence during beta testing. I stand by my opinion and think that given the target audience and context for this OER the survey in its original form was excellent.
Of course, we are all welcome to our opinions, which is the point of beta testing, but we should not be judging each other for those opinions. You stated, “I think my classmates who found the survey intrusive should perhaps think a little harder about why they had that reaction and apply that critical thinking not only to the tools they use in the classroom, but the applications they use in their personal lives.” which is why I replied to your comment as it suggests a judgement on those of us that had a different opinion to yours. We are entitled to our gut reaction and should not be judged for it.
Hi Erica,
That was not meant to be a value judgement, if it came off as such I apologize. I was simply highlighting what I thought to be a gap in the conversation.
Yeah, unfortunately it didn’t come across that way, Adrian. Rather that those of us that felt that way were not thinking critically.
Apology accepted. Words can be tricky things in an online space, as can impressions when you are not sharing a physical space where you see body language and can hear tones. For me, that was my concern with the initial survey, is that it might set an air of unease and mistrust before people (outside this course) fully engaged in the OER and acquired a sense of intent from the creators.
Hi Adrian
Thanks for the insightful feedback. As a group, we spent some time discussing the potential learning objectives of big data and learning analytics. We hope to create a safe learning environment for classmates to critically analyze presented content and information. We will look into ways to make our comment boxes more visually appealing.
I am curious how you are utilizing big data and/or learning analytics in your professional career? And, how are some ways we can teach the importance of privacy and ethics in data usage?
Hi Amanda,
We use data analytics to keep track of how much our rooms, systems and equipment are used. This helps us decide where to invest in new equipment or expand existing offerings. As for privacy and ethics FIPPA is an excellent place to start: https://www.oipc.bc.ca/guidance-documents/1466
Hi everyone. Let me commend you on an insightful and well structured OER. I really enjoyed the interactive activities as well as the informative collection of videos. I never really know how to tackle my own perspective on big data and your OER certainly helped. On the one hand, some of my most used tools in my life collects an exorbitant amount of data from me (ie. google maps, messaging systems, health tech, etc.), but I figure as this collected data ages, it loses its ability to reflect and influence me (yes, my internet behaviour may inform advertisers, but how relevant is it that I visited a sports car’s website in my early 20’s now that I’m in my 30’s or when I’m in my 40’s?). I understand that big data can inform larger, general patterns, but I feel my contribution to those patterns have always been present. I’m not trying to position myself as a proponent or opponent to big data, but often reflect that as big data is a relatively new thing, I feel like in many ways we’re still ironing out its usefulness and in this exploratory stage, there will be a lot of data hoarding. With that said, what may concern me about big data is how anonymous it is. I would hope to see more tools, aimed at users, that will help them understand where their data is going, and how it’s being used.
Hi Julio,
Thank you for your comments. You mentioned, “we’re still ironing out its usefulness and in this exploratory stage, there will be a lot of data hoarding.” This reminds me of the Massey Lecture podcast I listened to this week on CBC. These three podcasts discuss the our reliance on mobile devises, the personal data surveillance economy and how social media platforms are engineered to be “addiction machines” in order to collect data on us. If you only have time to listen to one podcast I would suggest episode three.
Nov. 9, 2020: CBC Massey Lecture # 1: Look At That Device In Your Hand – https://www.cbc.ca/listen/live-radio/1-23-ideas/clip/15807770-cbc-massey-lecture-1-look-at-that
Nov. 10, 2020: CBC Massey Lecture # 2: The Market for Our Minds – https://www.cbc.ca/listen/live-radio/1-23-ideas/clip/15808000-cbc-massey-lecture-2-the-market-our
Nov. 11, 2020: CBC Massey Lecture # 3: Toxic Addiction Machines – https://www.cbc.ca/listen/live-radio/1-23-ideas/clip/15808039-cbc-massey-lecture-3-toxic-addiction-machines
Jamie
It was interesting, when I first read about analytics in education, I thought, “Wow that is interesting, maybe some time I will use it.” Although, as I worked through your activities I came to realize that I have used them at my different schools. It was a great learning experience, I especially enjoyed the materials and the layout of the pages. I do understand why some people suggested too much information was being collected and it may turn some people away, although my own personal opinion is that we already have so much information out there already, what’s a little more. Again, great job!
I love google forms! It is a nice tool to easily organize large amounts of data, especially in a non-open ended format.
When I noticed that you made the data public, I chuckled when thinking of your TedX video on privacy.
In your first Form I was confused with why “discussion participation” was not an example of “engagement”.
Your Academic vs Learning Analytics was slightly miss aligned.
I found that the Ted X talk gave me very little info and did not change my mind about digital data ever being private, especially when the speaker chose music encryption as an example, yet it is almost impossible not to find ripped copies of music online…..so how is it being protected? Would love to hear more about their algorithm design. As my thought is if you can program to “hide it” some else can program to “un-hide it”.
The buttons at the bottom were a bit confusing as the button labelled “past” made me wonder if it would take me backwards in your presentation.
Data analytics Google Form was way too long to get the point across. Scrolling and flipping screens made this a test in patience more than a test in how these can be used to gather and analyze info. I also had the first chart stop working on me, but that is nothing to do with your design. The course data for me is missing context, but perhaps that is the point and something we need to think about when collecting and analyzing data.
Q1 Why change the order of comparison from question to answer? Was this to intentionally confuse the quiz taker?
Why choose 1/10 instead of 1/15…when technically it is 1/13, which is closer to 1/15?
“Which province has the highest CTPTD graduates after three years? ”
This one needed a calculator, as graduation rates and graduates are different. Nice!
Google forms are great, but when designing a data collection questionnaire we need to be careful not to include our own biases in the design, having the addition of “other”, as you did, helps with reducing some of the biased data you may end up collecting. Good idea!
I am a huge data nerd and love spreadsheets and tables and analyzing trends!
Thanks for the post. Good work Team!
Hi Sarka,
Thank you for your terrific feedback and suggestions. We are incorporating some of your suggestions right now and will work on including others in our final product. Did take a look at creating a visualization using Tableau Public: https://public.tableau.com/en-us/s or Google Data Studio: https://datastudio.google.com/u/0/navigation/reporting?
Thanks again
Hi Sarka,
I’ll reply to your thread to nest these similar reactions.
Overall, I loved the visuals and the flow/choice of content in this OER. I also thought it was wonderfully creepy how each time you asked for a name, it said “so we can collect your data.”
There’s been much discussion already about the opening form. I think the big issue/difference between collecting/publishing data like this vs big data is big data tends to be viewed as a whole. I feel way less concerned with Google Maps knowing EVERYWHERE I’ve been because it’s not being posted online with my name, age, feelings about children, etc etc. Big data is used to identify big patterns. I am all for big patterns. I love statistics. I feel like big data is less of an invasion of privacy than publishing personal data publically and, later, with identifying factors such as name (unfortunately, given that you have to provide a list of participation providing an unidentifying nickname isn’t really possible). What I think would have been cool is if there was an immediate discussion ABOUT the survey after it. Actually make that discomfort BE the point to lead into privacy? Make people feel uncomfortable and then talk about it. I actually feel incredibly differently about social media and sharing information about myself online that way than I do about big data.
I felt similarly to Sarka that the Ted talk was perhaps a bit dated/not so relevant. It was recorded during the Obama administration and DRM was much more of a hot topic when you downloaded music for $0.99 off of iTunes back in 2005. I wonder if there’s a more relevant clip to current privacy laws and issues? I was also left wondering what kinds of privacy laws do exist for data around the world?
The one thing I did feel strongly about was that the interactive infographics/learning analytics was WAY too long. I took 3 years of stats in university and got the point after the first question (which was worded a bit awkwardly). Luckily, I have a second monitor so I duplicated the tab and viewed it on the second screen which helped with the scrolling, but I got bored and frustrated after the first few questions and ended up clicking random answers just to get through it. Especially if you want a reliable data set to analyse, I think you could benefit from reducing the number of questions. I think of those x% of my classmates who have children (though it seems most of us do not). PS – what did QP stand for?? Was that supposed to read QC?
I was very happy that the rest of the OER flowed quite well from here. Frontloading it with two lengthy Google Forms had me worried. But, let me reiterate my first statement of the post. I think you tackled big data in a very ‘big data’ way which was great, and you held true to that theme through your copy, activities, and even your bios. Overall, I thought it was really well done!
I echo Jessica and Sarka’s responses above, re: the length of the quiz, the TedX clip and the survey.
to the Big Data Team, my suggestions on the quiz would be to split it into 3 sections, with questions relating to a particular visual following directly underneath. Not sure how difficult that is, but I know for me it would have helped with the scrolling. But I did like the quiz as a a format and have added it on to my growing list of tools to learn.
About the opening survey, I agree that a discussion around the survey would be helpful. A suggestion could be telling the reader right off the bat data isn’t really being gathered and this info is not a part of the course itself, but to evaluate the impact of big data in our lives (without necessarily being that obvious); possibly grading the questions from less to increasingly private and uncomfortable; moving the format from a quiz to a list of questions readers don’t actually have to answer, but would be asked, culminating in a response question on how they felt about the data collected, why, what to do with the data, etc. This could bring home the discomfort around data collection, while not actually being guilty of doing it!
Like other comments, I found your OER to be very informative and valuable on Big Data, Privacy, and Future Impact while being practical with the sections on the tools. Big Data has been very much on my mind particularly as we all continue to transition our lives online, and this OER has managed to put all my own disparate research into one complete package. Not only have I learned a lot, it has also given me something to act on by looking into / joining associations like MyData.Org that seek to protect our privacy.
Hi Week 10,
I wanted to add a little more feedback now that I have finished the optional assignment. I created mine with Google Data Studio and I noticed the included tutorial seems to cover an old beta version of the software. While I was able to figure it out, I would recommend finding a more up to date tutorial as it seems the interface has changed somewhat. Secondly, I noticed that your submission form doesn’t accept .pdf files which is a little odd given the main export format for Google Data Studio is .pdf. If this is a limitation of the google form, I might recommend noting that on the submission page (ie: please submit as a .jpg).
As a more general comment, I found the tool quite interesting and powerful. The visualization I created was rather basic, mostly due to lack of imagination on my part. Without a real background in data visualization I had no idea how to look for or create any sort of meaningful story from the data. As such I resorted to an embarrassingly basic visualization of the scores.
Thanks for catching that Adrian! I have changed the form to accept pdf, docs and video. Adrian, I have also posted your viz on the Activity #3 page. Thanks for your contribution.
Thanks Jamie!
Hello,
I thoroughly enjoyed your OER, it has been one of my favourites so far! It was well written, useful, and engaging. Thank you for thoughtfully curating all of the information and tools you shared, I have been inspired by your OER to pick up learning to use Tableau. I also was not familiar with Google Data Studio but it seems like a very robust tool as well.
Did you get my form submission? It did not give any confirmation notice after I pressed submit so I am not sure if it worked.
Again, great job. Thanks for the OER!
Hi Ryan,
Thank your for your comments. We are delighted you enjoyed our OER and find it useful. Did you submit a visualization for Activity #3? We didn’t receive anything on our side. I just recently changed the submission criteria so perhaps the form was down at that time.
I did, looks like it should have gone through now, let me know if it worked.
Hi Ryan,
Yes! Thank you we got your visualization and I included it in a new slide show with the others. Great job! Thanks for your contribution.
Hi Allan, Amanda, Grant & Jamie,
You outlined many of the prominent issues with this topic and presented them with a thoughtful layout. Given the scope of the resource, I think the resources that you used and your presentation meet a high standard. SoLAR, Tableau, and Google Data Studio are all resources that I use for work, and while the site would have been incomplete without at least a passing mention of them I can’t help think that they are too advanced for use in the current state of K-12 education. This is where I am not sure what I might suggest that could be helpful for you when you are sifting though comments for revision.
I think that you clearly met the three initial learning outcomes for the topic, though achieving the outcomes as an expression of the future potential of K-12 is rather difficult. Your selection of the video from Kenneth Cukier nicely sets up the problem with K-12 and learning analytics: K-12 stakeholders are very conventionally attached to the status quo. This includes policy makers, administration, and teachers. Curriculum changes and improvements to technology-driven pedagogy are not accepted and approved in a timely manner. These groups are protected by unions and may not open to the kind of changes needed if learning analytics were to be applied in a manner that makes the system accountable and obligated to improve learner progress. K-12 may be a harder case than Higher Ed, but Higher Ed too can be reluctant to change. Academic freedom can prevent progress with technology, starting with research-driven educators without proper training in teaching and learning pedagogy. While your opportunity forecast hits on the right trends and topics, I wonder how relevant they are for K-12 in the short term; however, it is certainly worth considering an emerging market for this sector.
Now that the intense week of review and feedback is complete, I might suggest that you reduce the amount of interactivity in the form of quizzes in favour of a list of questions with some of the prominent answers (and correct responses). You ask lots of really relevant questions, but as a resource I think future viewers will pass those sections by to the detriment of a well-informed product. I would otherwise gladly send someone to your site for a quick overview of learning analytics without any fear of having steered them astray. Very nice work!
I agree, the quizzes would have steered me astray had it not been for the course.
Hi Week 10 team,
Thank you for presenting us an engaging and educational OER. Among all the OERs I have seen so far for this course, I have to admit that I have spent the most time to go through the material for this week. I am quite enjoyed the challenge of the information about big data and learning analytics in your OER. As a P/J teacher, big dada and learning analytics is quite new to me but I wouldn’t be surprised to see one day that learning analytics tools would be widely used among teachers in order to better monitor students’ progress and behaviour patterns. I’ve always known our information been collected daily behind the sense but I’ve had better understanding how my information being collected and how could it be used after doing the activities in your OER.
Good job!
Hey Allan, Amanda, Grant & Jamie,
Thanks for the very comprehensive coverage of Big Data – this is probably the most information I have read about the topic and so it was all very informative. I really liked your assignments, even though I sometimes didn’t like doing them (lol the multiple choice utilizing the 3 charts felt like schoolwork!), but they always drove the content home. I do think that the question “Which province has the highest CTPTD graduates after three years?” has no correct answer given, as PEI has 64.1%, of which I don’t think another province is higher.
Overall, your OER was jampacked with useful information, so thanks a lot!
Thanks for your feedback Johannes! We will look into this question that you had an issue with and fix for our second launch.
Hey no worries! After I wrote that I realized that I guess the question works as is, because you can just select the answer with the highest percentage out of the given choices, as the 2nd highest province isn’t represented either…. I think I just thought that the highest on the map should be the right answer, but it doesn’t have to be!
Thank you for a very engaging OER Allan, Amanda, Grant & Jamie!
I must admit I am conflicted about “Big Data.” Even as I answered your survey I was hesitant to answer some of the questions, which in hindsight weren’t really intrusive.
While I don’t subscribe to conspiracy theories I think we should all have a healthy skepticism about what corporations or governments will do with our information. I live in Thailand where encrypted messaging is aloud but I do (I did before COVID hit) make several trips to China during the year for conferences and there is one app that is seemingly the key to all social and financial transactions. Through this one’s buying habits, locations they frequent and messages they send can all be accessed legally by the government. You can be pinpointed any time and an infinite amount of data about you exists.
This kind of data collection obviously does not only exist in China but it is more widely known and there are fewer ways to get around it due to internet restrictions.
When we talk about Big Data as it relates to education I begin to think differently, knowing how much potential there is with the proper usage of data points to improve the learning experience of students. As you state in your OER data collection can further adaptive technology, improve personalized learning, predict student performance and potentially allow for earlier intervention to help those that struggle. I think we can all agree that these things are good. However, as Audrey Watters warned, personalized learning is a pretext for “massive data collection” and “surveillance” of students (Herold, 2020). This makes many parents and educators uneasy and it is understandable why this is so.
With all of my pessimism though I have to say that the potential of this technology to move us closer to true student centred learning, catered to the individual is compelling enough for me to put aside my fears. Clearly, controls need to be in place with transparency over who has access to the data, how it can be used and what penalties there should be for misuse.
Personalized learning can of course occur from human to human interaction but to truly tailor to an individual takes a complex set of data calculations and intuitive decision making as well. I don’t believe that means an eventual replacement of teachers as the human interaction is invaluable. However, there are limits to human perception and computation and technology needs to continue to progress if we are to achieve our ideals of constant evolution.
I really enjoyed the activities you provided this week and in particular I like how you delved into the market aspect of the technology which is an important aspect of this course.
Thanks again for a great submission!
Great OER Week 10! The information presented was nicely laid out and had a great balance of text, images, and videos. The differentiation in content, allowed your OER to appeal to varied learning styles and increase peer engagement. Having had little experience with learning analytics and big data, I found your OER and activities had a good balance and pace, and the amount of information was not overwhelming.
I was however intimidated with the long pre-survey asking for personal info. Not knowing what was going to be done with the data (and how it was going to be shared) made me nervous. I have always been skeptical and a bit paranoid of data collection and analysis; I do not have any Social Media accounts and privacy is very important to me. I also felt very uncomfortable taking the quizzes in activity one. I felt put on the spot and pressured. It had me second guessing myself and made me feel very insecure- this is no doubt what our students feel when they are tested and it makes me very sad to think that we are putting them in those situations 🙁
A couple suggestions for improvement: There is a minor spelling mistake on the ‘About’ page- it says OEC- rather than OER. Also in the pre-survey I felt that there could have been more of a marked difference in the amount of hours worked (the only options were 35 or less hours or 35 or more hours). By not having more options, I felt like you were possibly missing a target group of part time workers, as 35 hours could still be considered full time and part time could be anywhere between 15-30 hours.
Just one last stray thought, as it came up in conversation with a friend this morning. Your target audience for this OER is largely teachers. I don’t know about everyone else, but during my MTeach we had almost weekly PSAs that went “so and so posted this to social media, and so and so lost his teaching licence”. Ever since I got certified, I have been EXTRA cautious about posting online. I’ve never even posted a Google or Trip Advisor review. I think if this OER was for a different group of people there might have been a different attitude about the surveys. It’s weird, on one hand, to be asked to publically put forward personal information and, on the other, to know your name is getting collected for participation. It seems a bit extortionate. A possible solution: could you find a platform that lets you ask questions that automatically get put into graphs and other visualisations? That way there is not so much identifying information as being able to scan rows of responses of raw data?
Thanks for the feedback, Jessica. We are making major modifications to the pre-survey to focus primarily on the Learning Analytics questions, with almost no personal info., for the second version. Also working on your suggestion of an automatic viz, but you can get one of those directly from Google Forms buy selecting the responses tab at the top of the form (that wasn’t explained though, and should have been.)
Thank you very much, Allan, Amanda, Grant & Jamie. The OER was very well designed and the topics (past, present and future) were very to follow and understand. I actually learned a lot specially from the video that discussed future privacy and how we can access to observers’ data as well/
Few things that I noticed, the StatsCan dashboard on student completion rates was not always visible for me. Can you please include the link? Also, I didn’t understand the purpose of writing a review about one software. I would prefer if you can find video of these software and what they offer. I also liked how you summarized the video. If possible, it would be nice to point out that the paragraph under the video is the summary of that video. I watched the whole video and then I realized that you summarized it underneath. Lastly, I think you didn’t give us access to the google slides in Activity #3 page, right?
Again, thank you very much. I really enjoyed your OER 🙂
Thanks for the comments, Raafa. We will investigate the changes you suggest. I myself had one instance of not seeing the StatsCan dashboard, but thought it was just me. So we will include the link as you suggest.