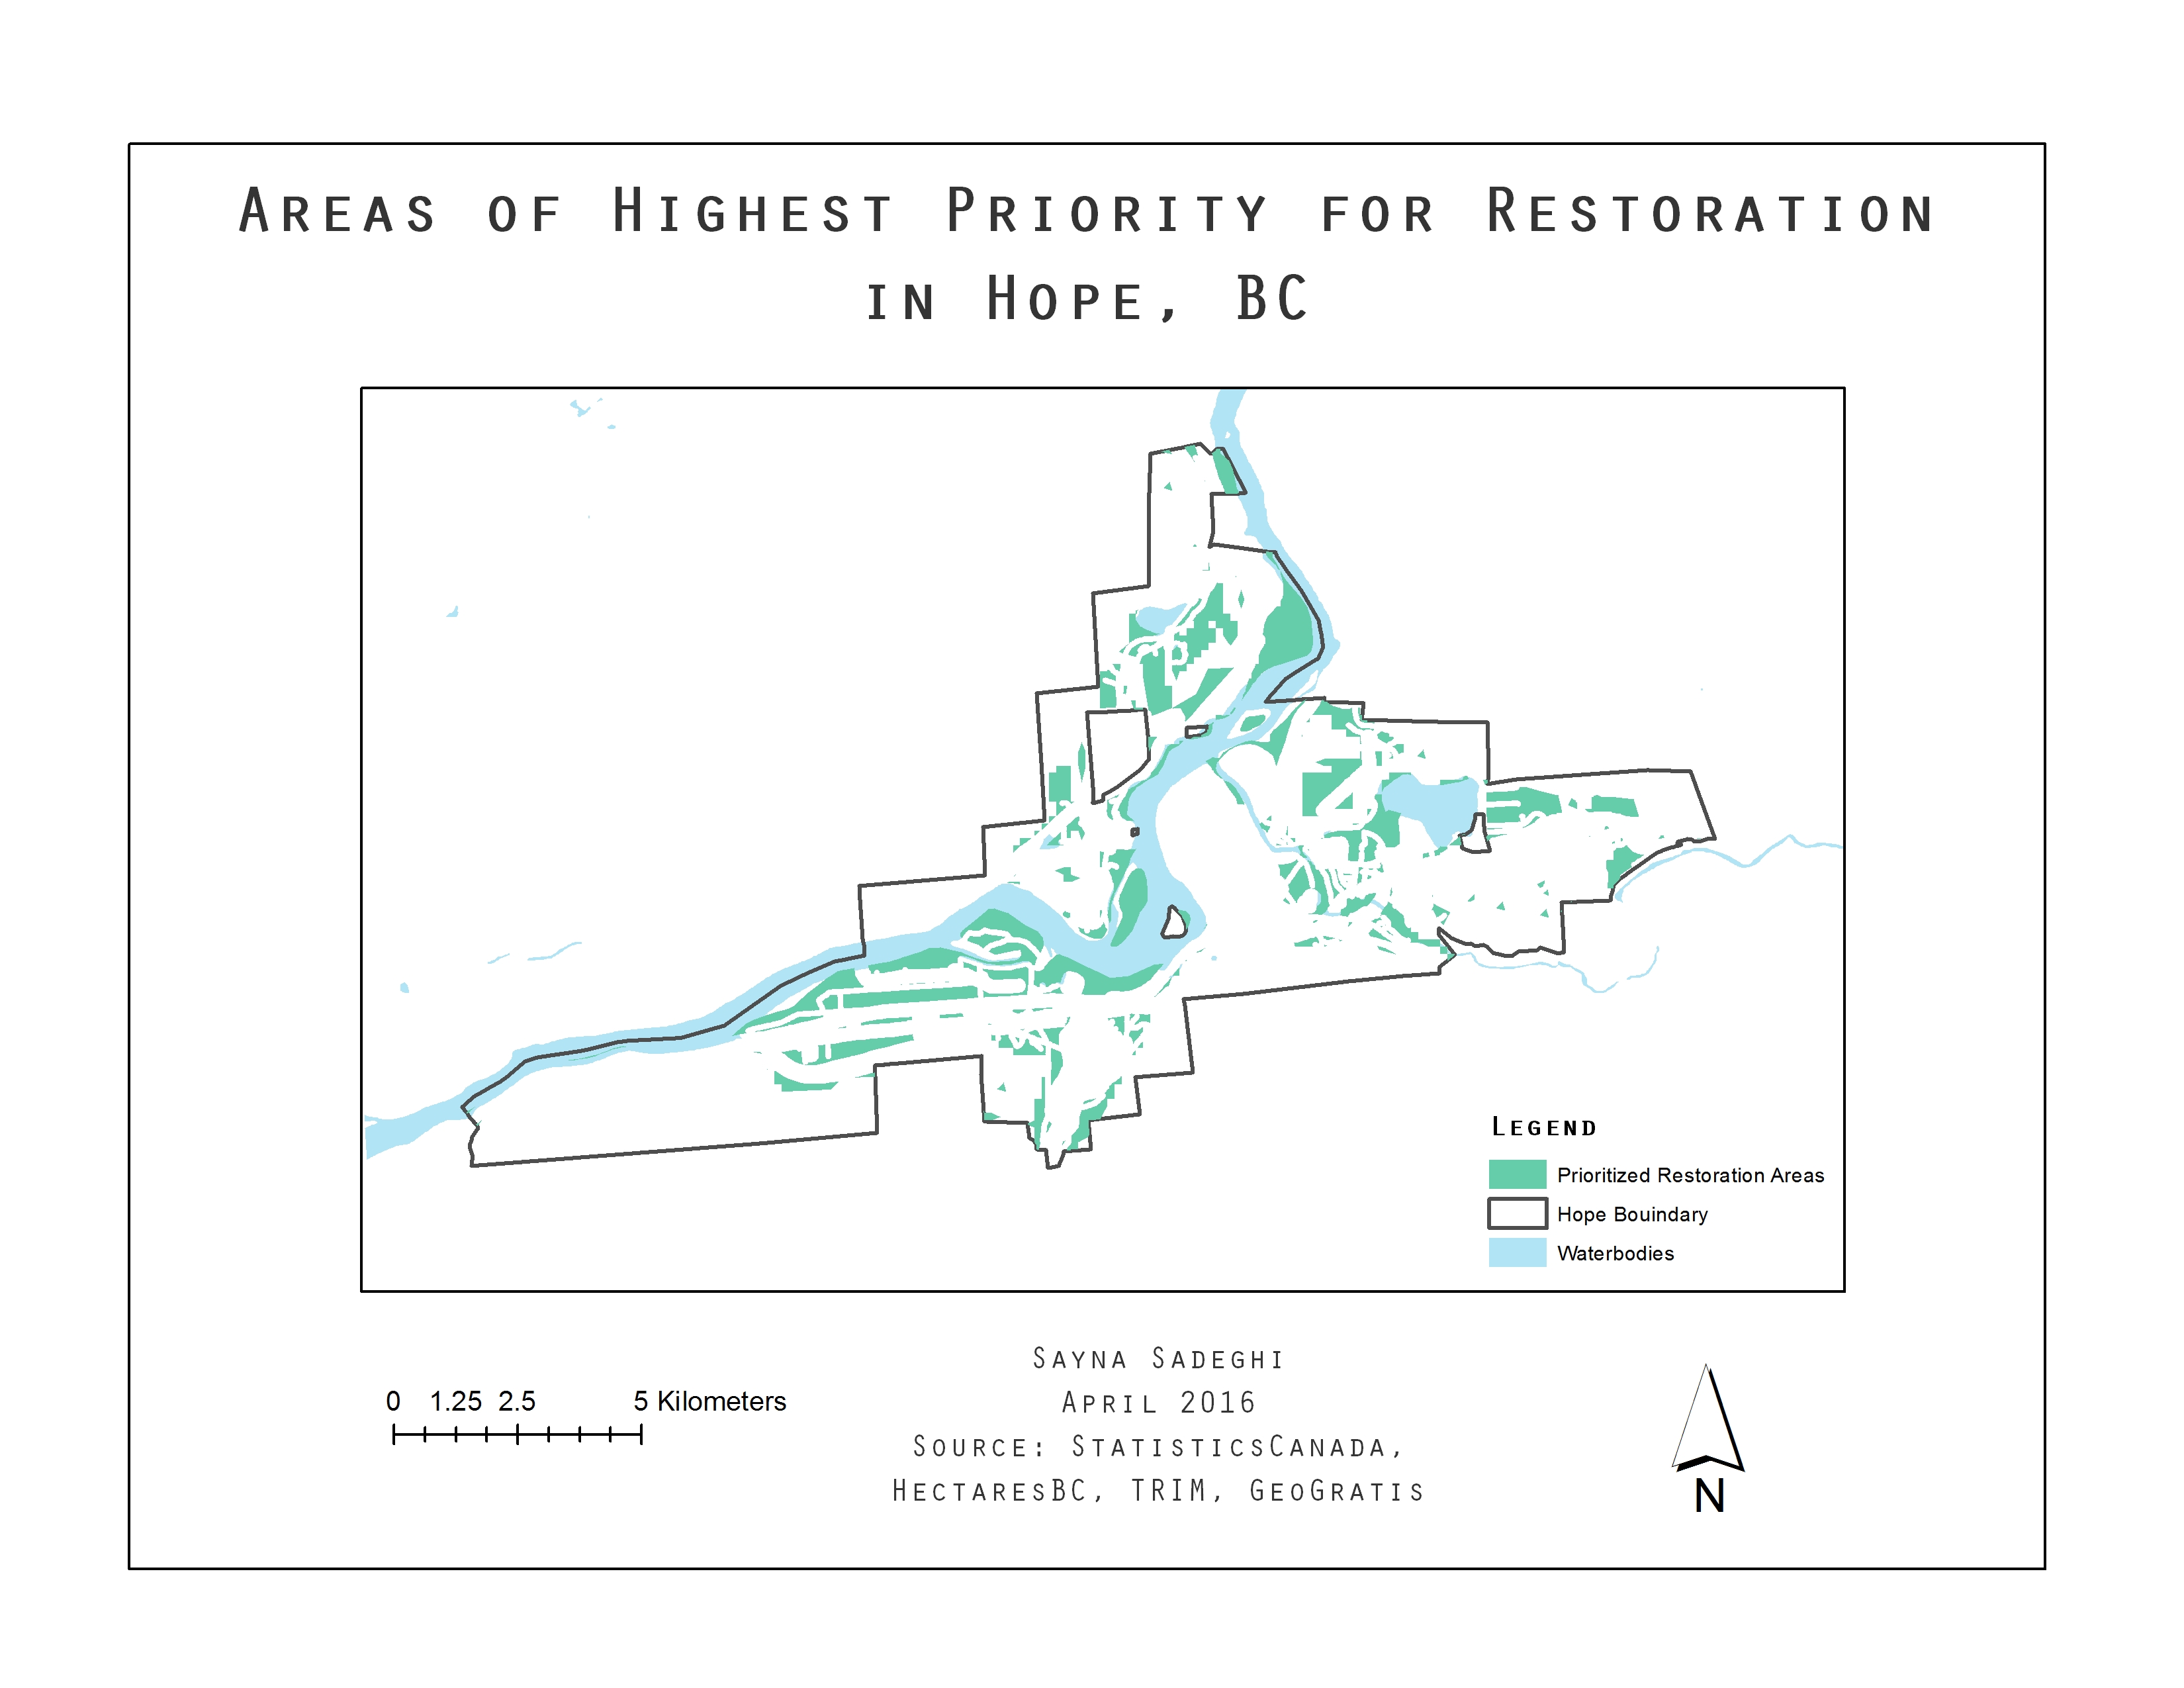
The intersect of criteria 1 and 2 areas indicates polygons that are of highest priority for restoration projects. Map 6 shows the results of this intersection. The green polygons show areas that have both highest probability of restoration success and highest levels of restoration efficiency. These areas total to 7,079,430.8 meter squared.

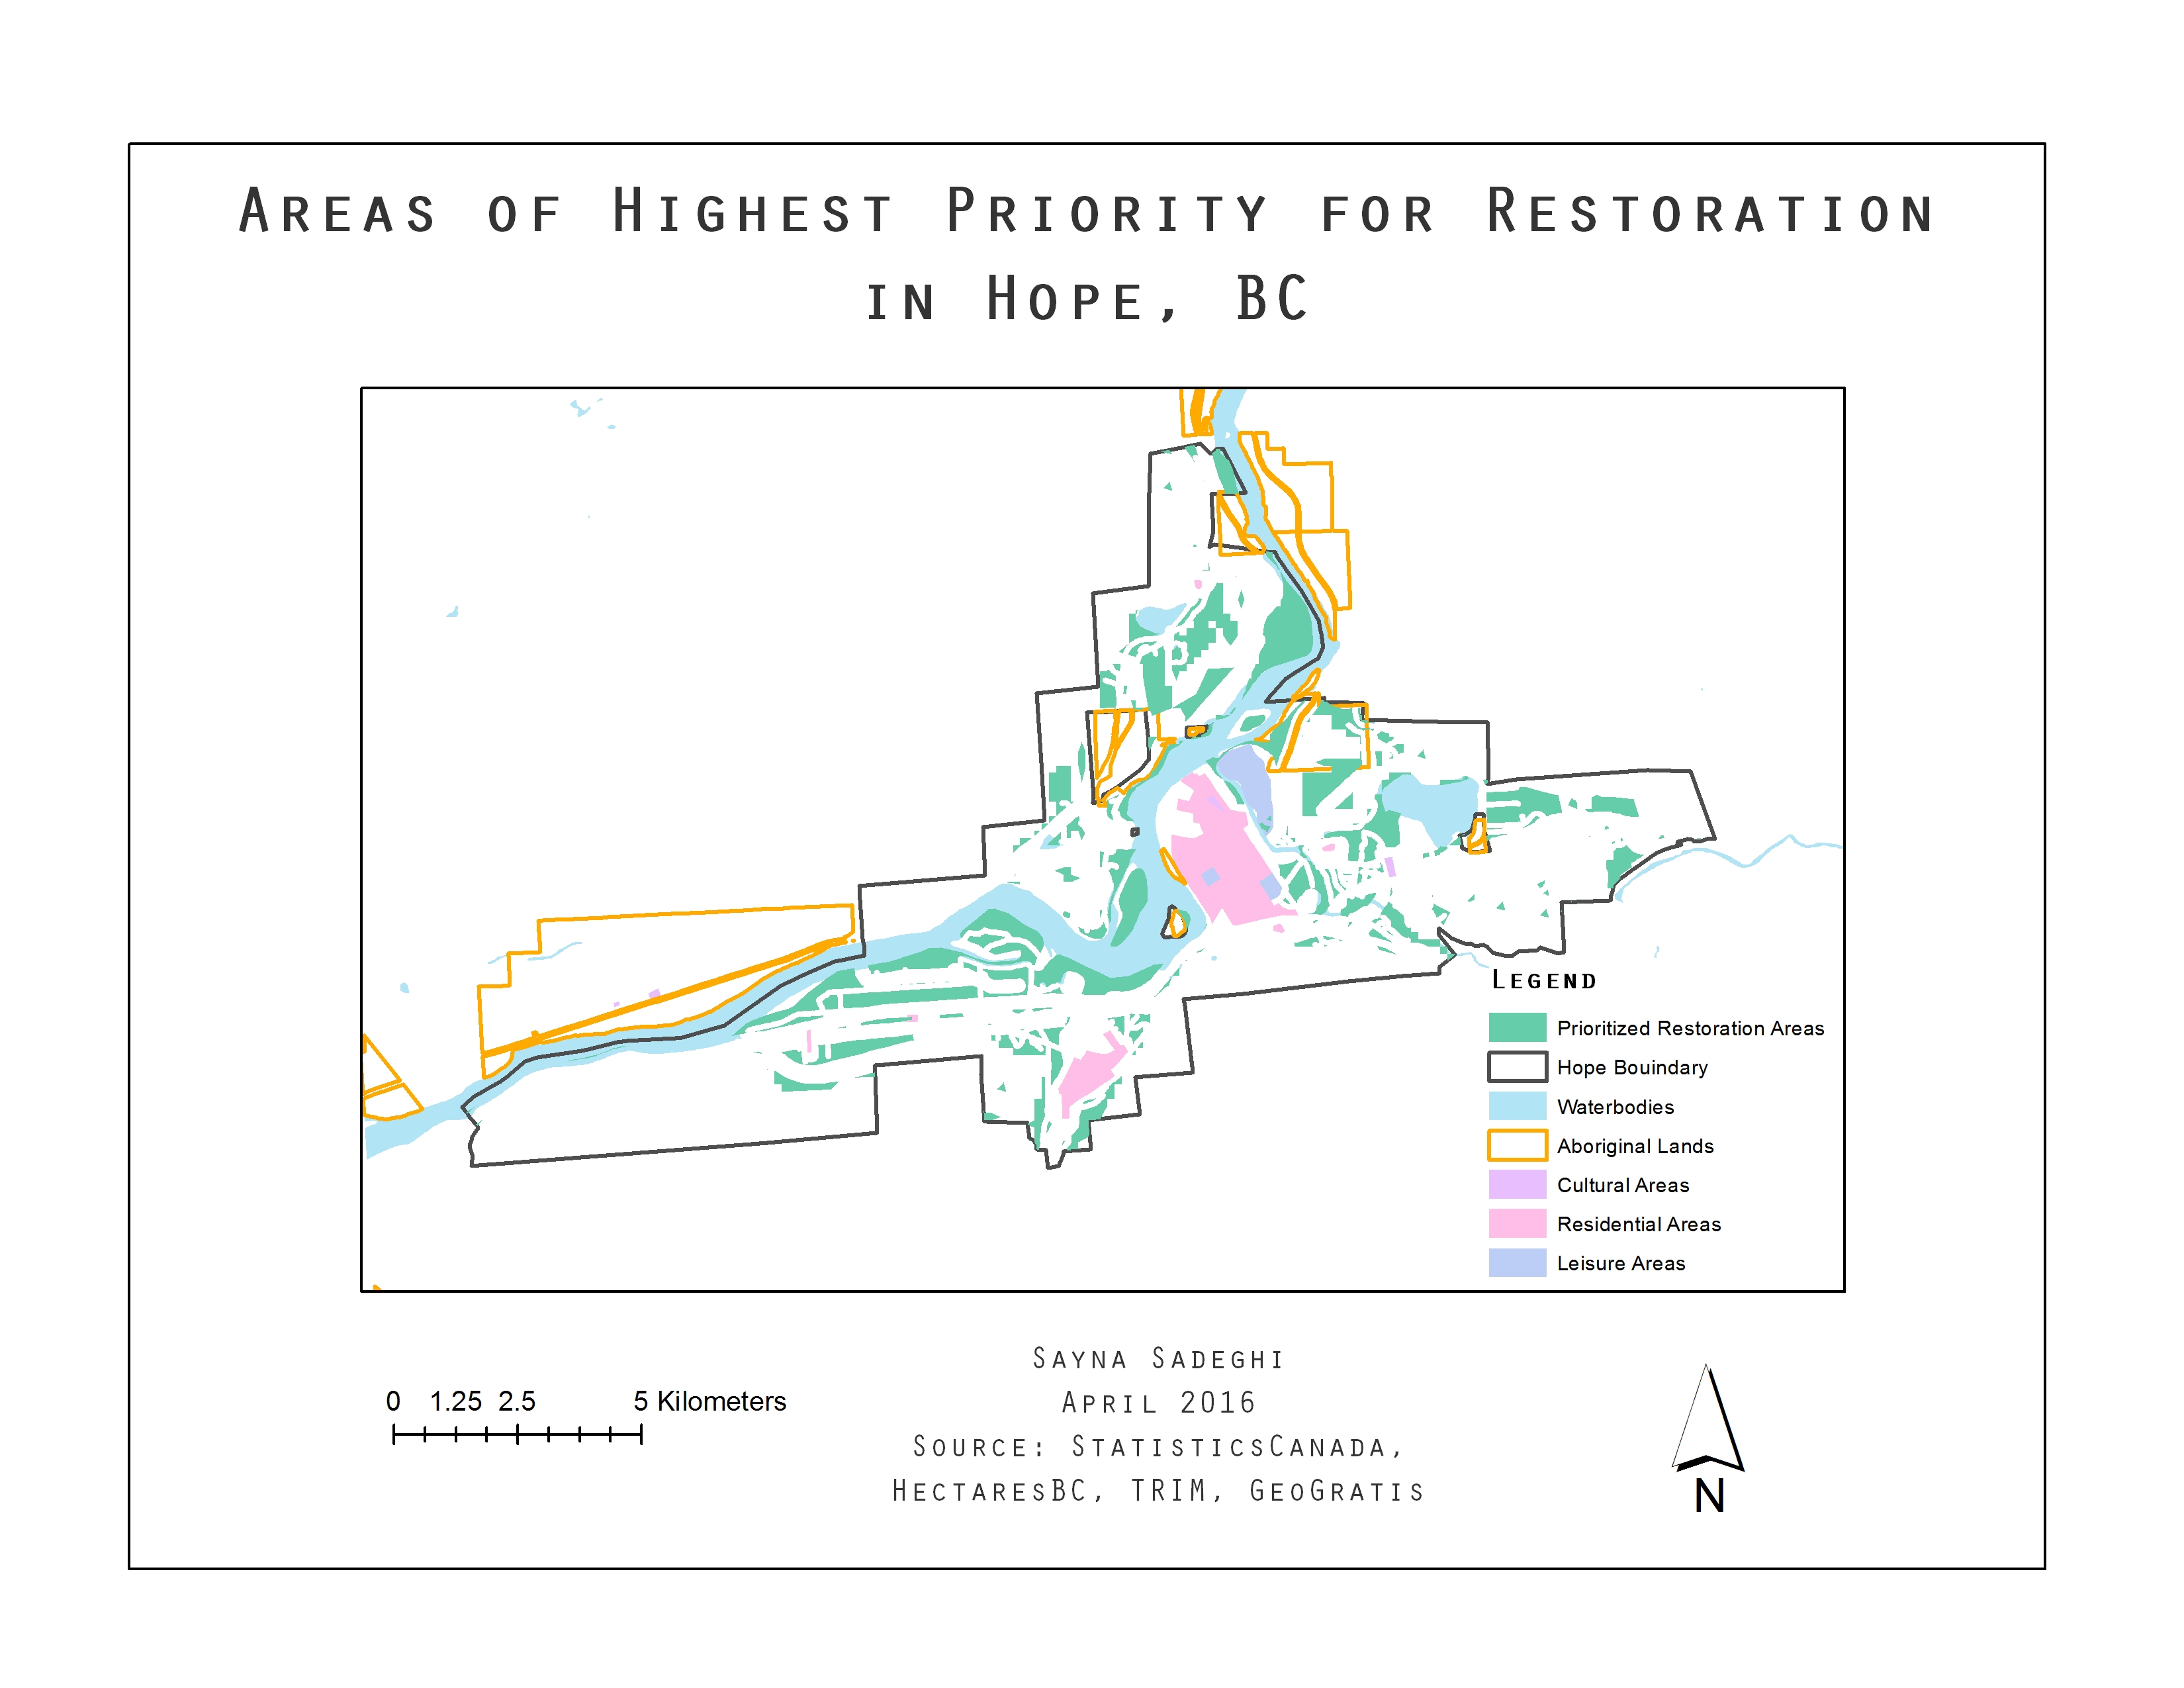
Looking at the land uses within these areas, the prioritized restoration areas barely overlap with residential, cultural and leisure ares as well as Aboriginal Lands, boundaries of which are shown in orange (Map 7).

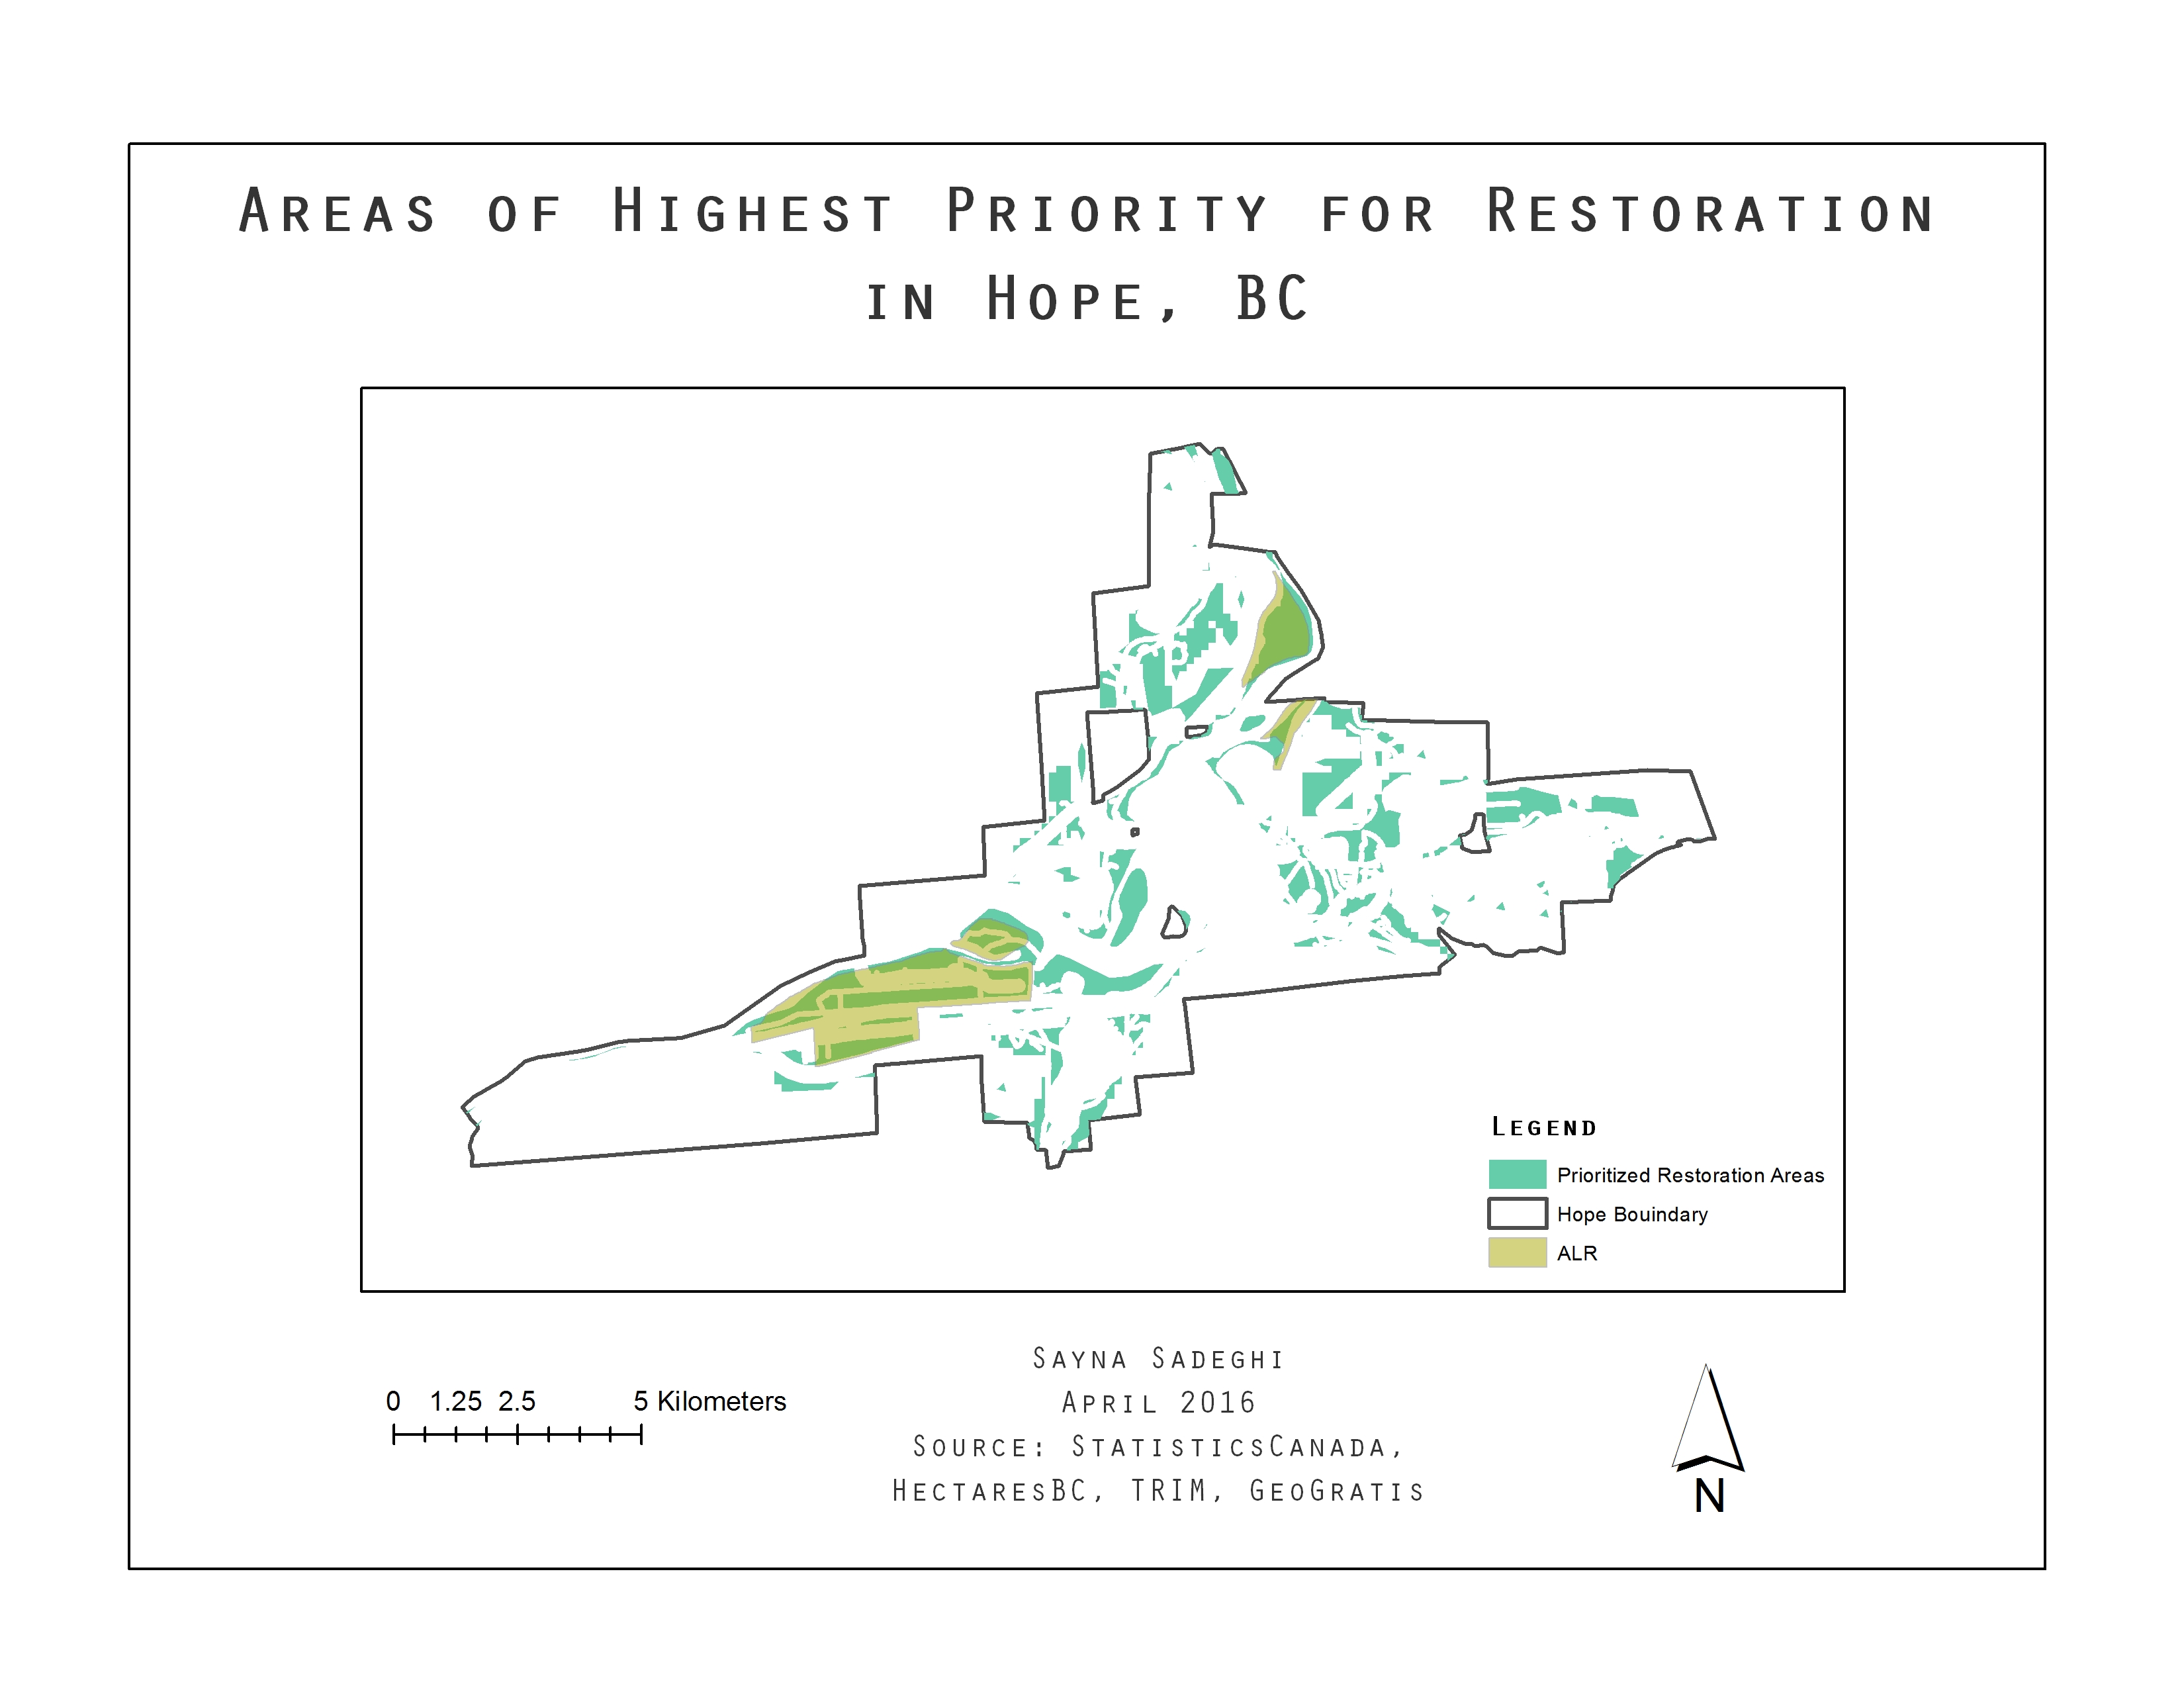
However, two significant parts of the prioritized restorable areas fall over Agricultural Land Reserves (Map 8).

The meaning and implications of these results are discussed in the ‘Discussion’ section.