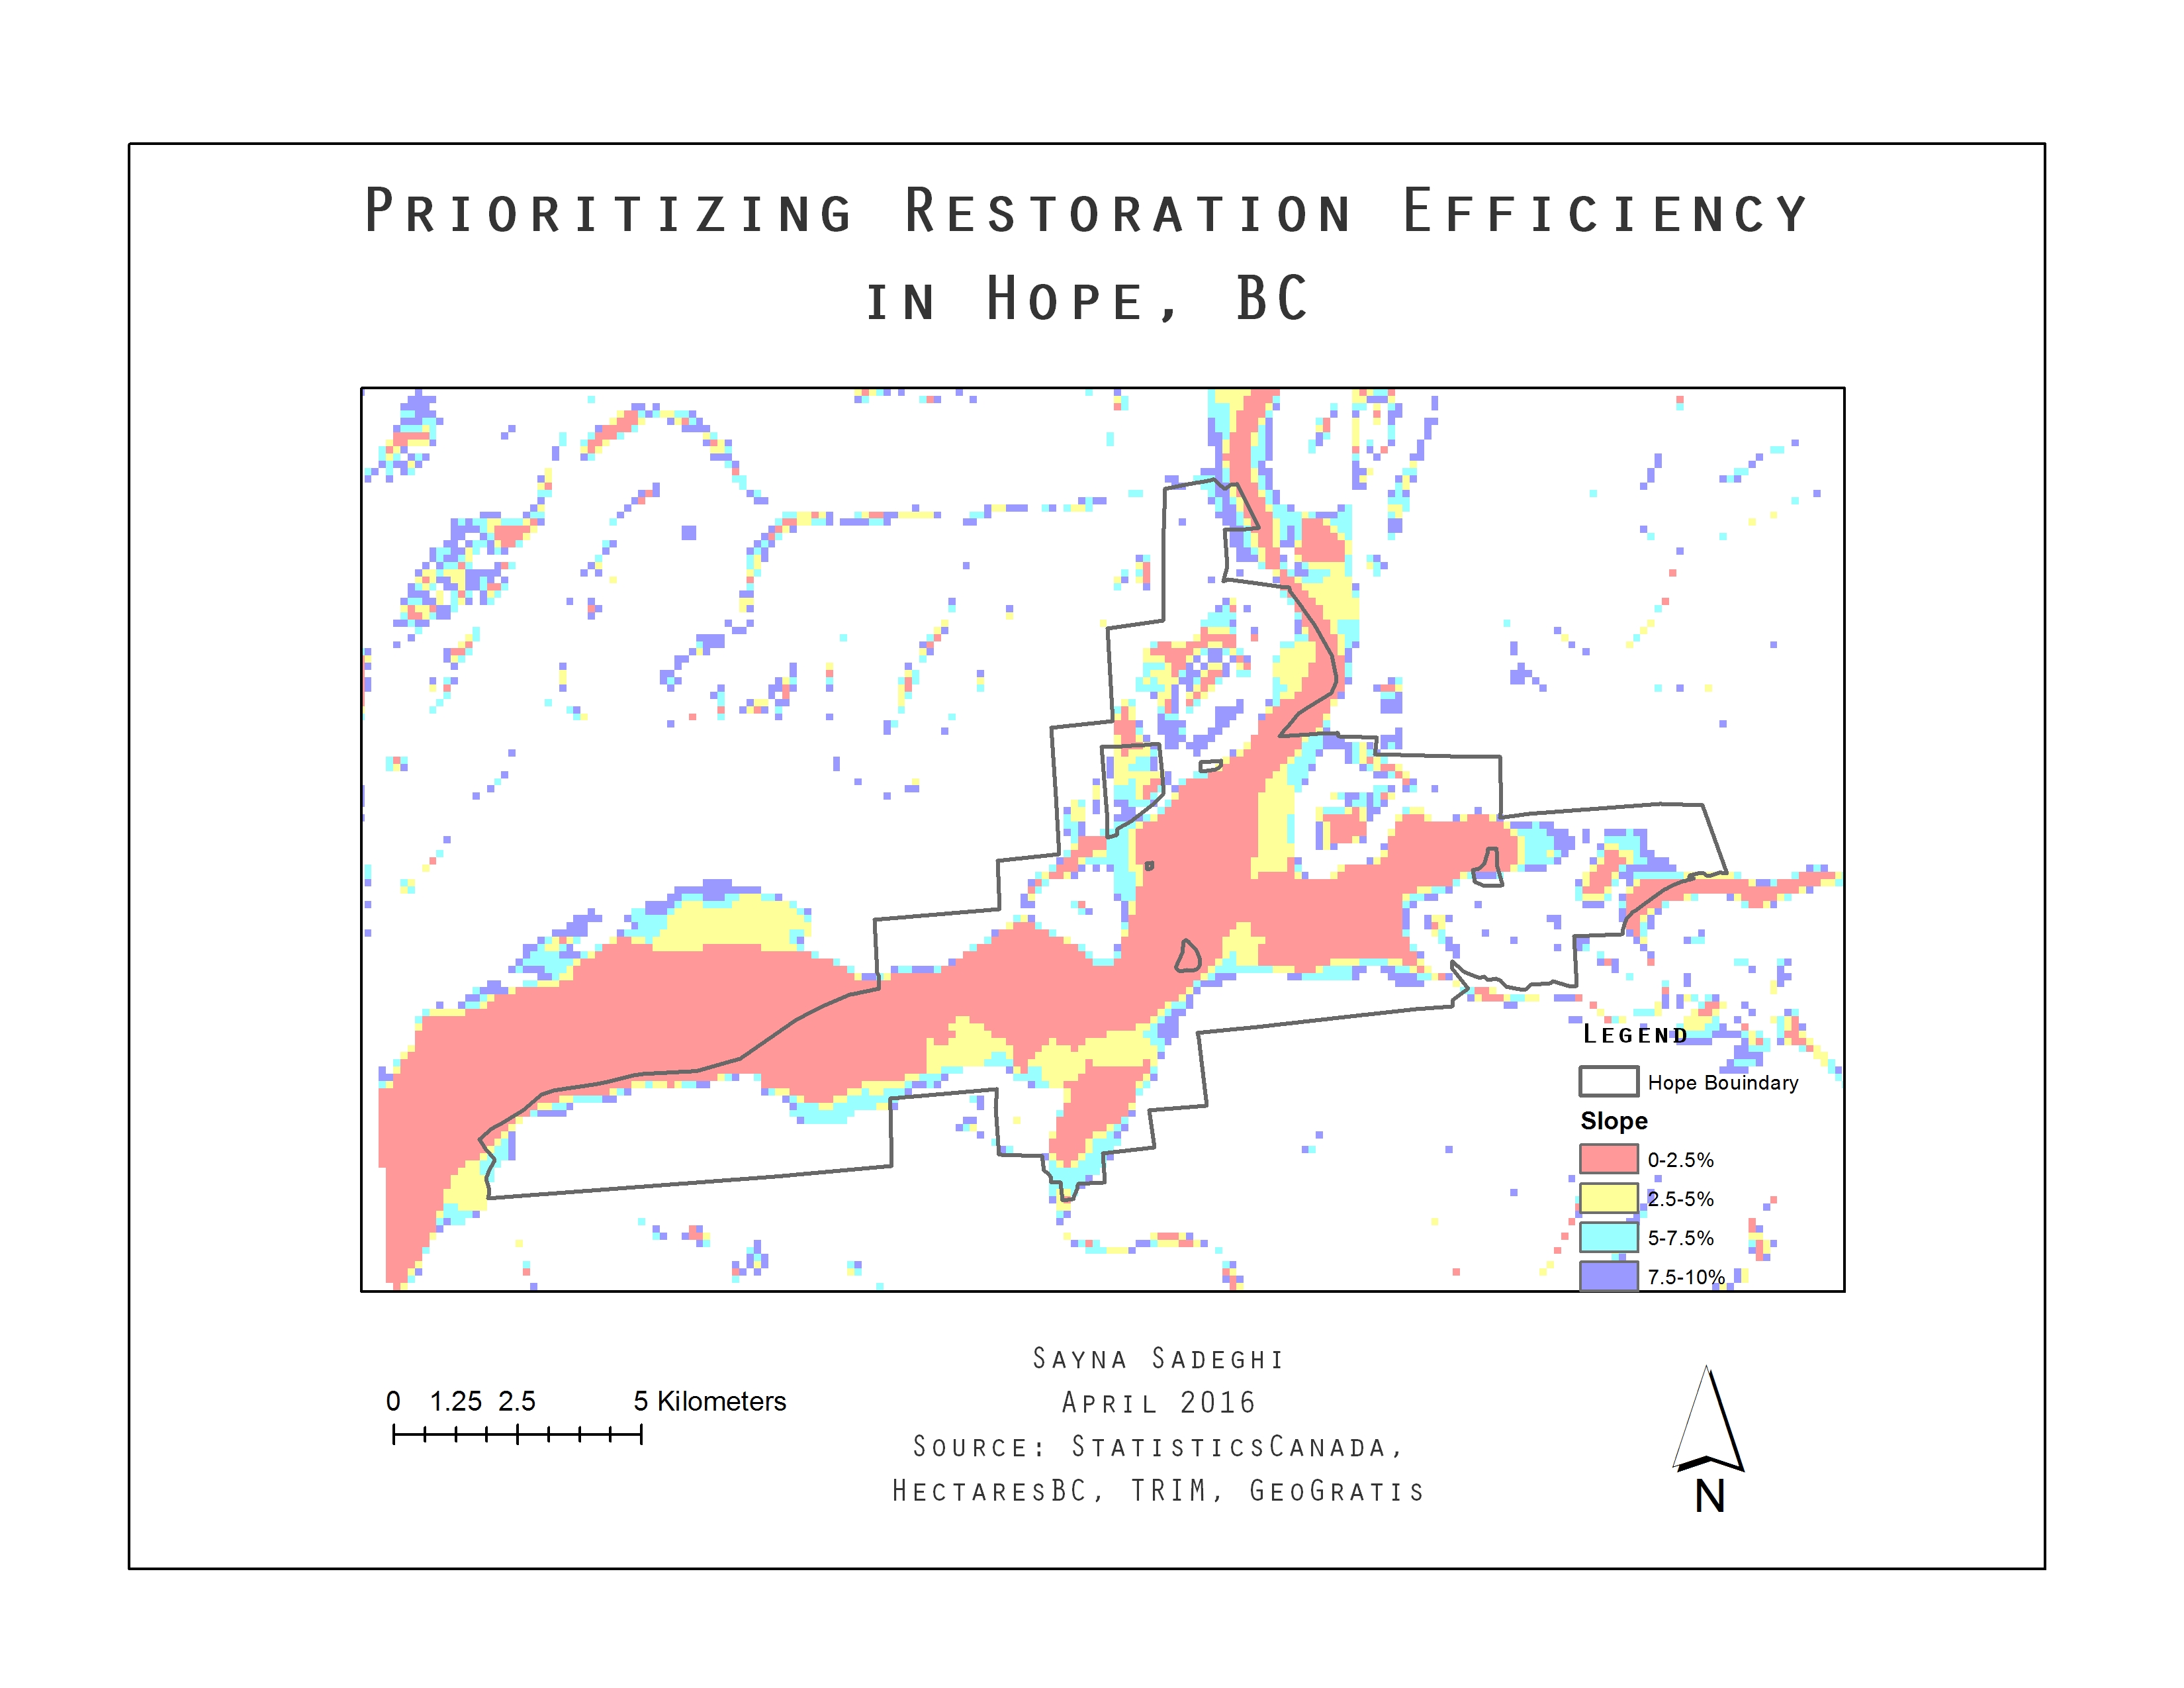
Map 5 represents final product of criterion two. Areas with greater than 10% slope were omitted in this map as they do not provide sites that have the high levels of restoration efficiency. Lower slopes are more desirable in this map. Red areas are the most desirable and have slope of 0-2.5% as described in the legend.

The intersect of criteria 1 and 2 areas indicates polygons that are of highest priority for restoration projects. Map 6 shows the results of this intersection. The green polygons show areas that have both highest probability of restoration success and highest levels of restoration efficiency. These areas total to 7,079,430.8 meter squared.