In this lab exercise I took a look at the crime cases in the Ottawa area, specifically, break and enter in the commercial and residential areas as well as car thefts. Using the program CrimeStat, I was able to conduct several spatial distribution analysis such as nearest neighbour index, fuzzy hot spot analysis, knox index, and kernel density.
In the first analysis I used the nearest neighbour index. The purpose of this is to
analyze the distance between each crime and the 25 closest instances of the same crime. The nearest neighbor index is the ratio of the observed nearest neighbor distance to the mean random distance of the crime took place, therefore, the index compares the average distance from the closest neighbour to each point with a distance that would be expected on the basis of chance.
The hot spot and clustering analysis allows map reader to visualize where exactly
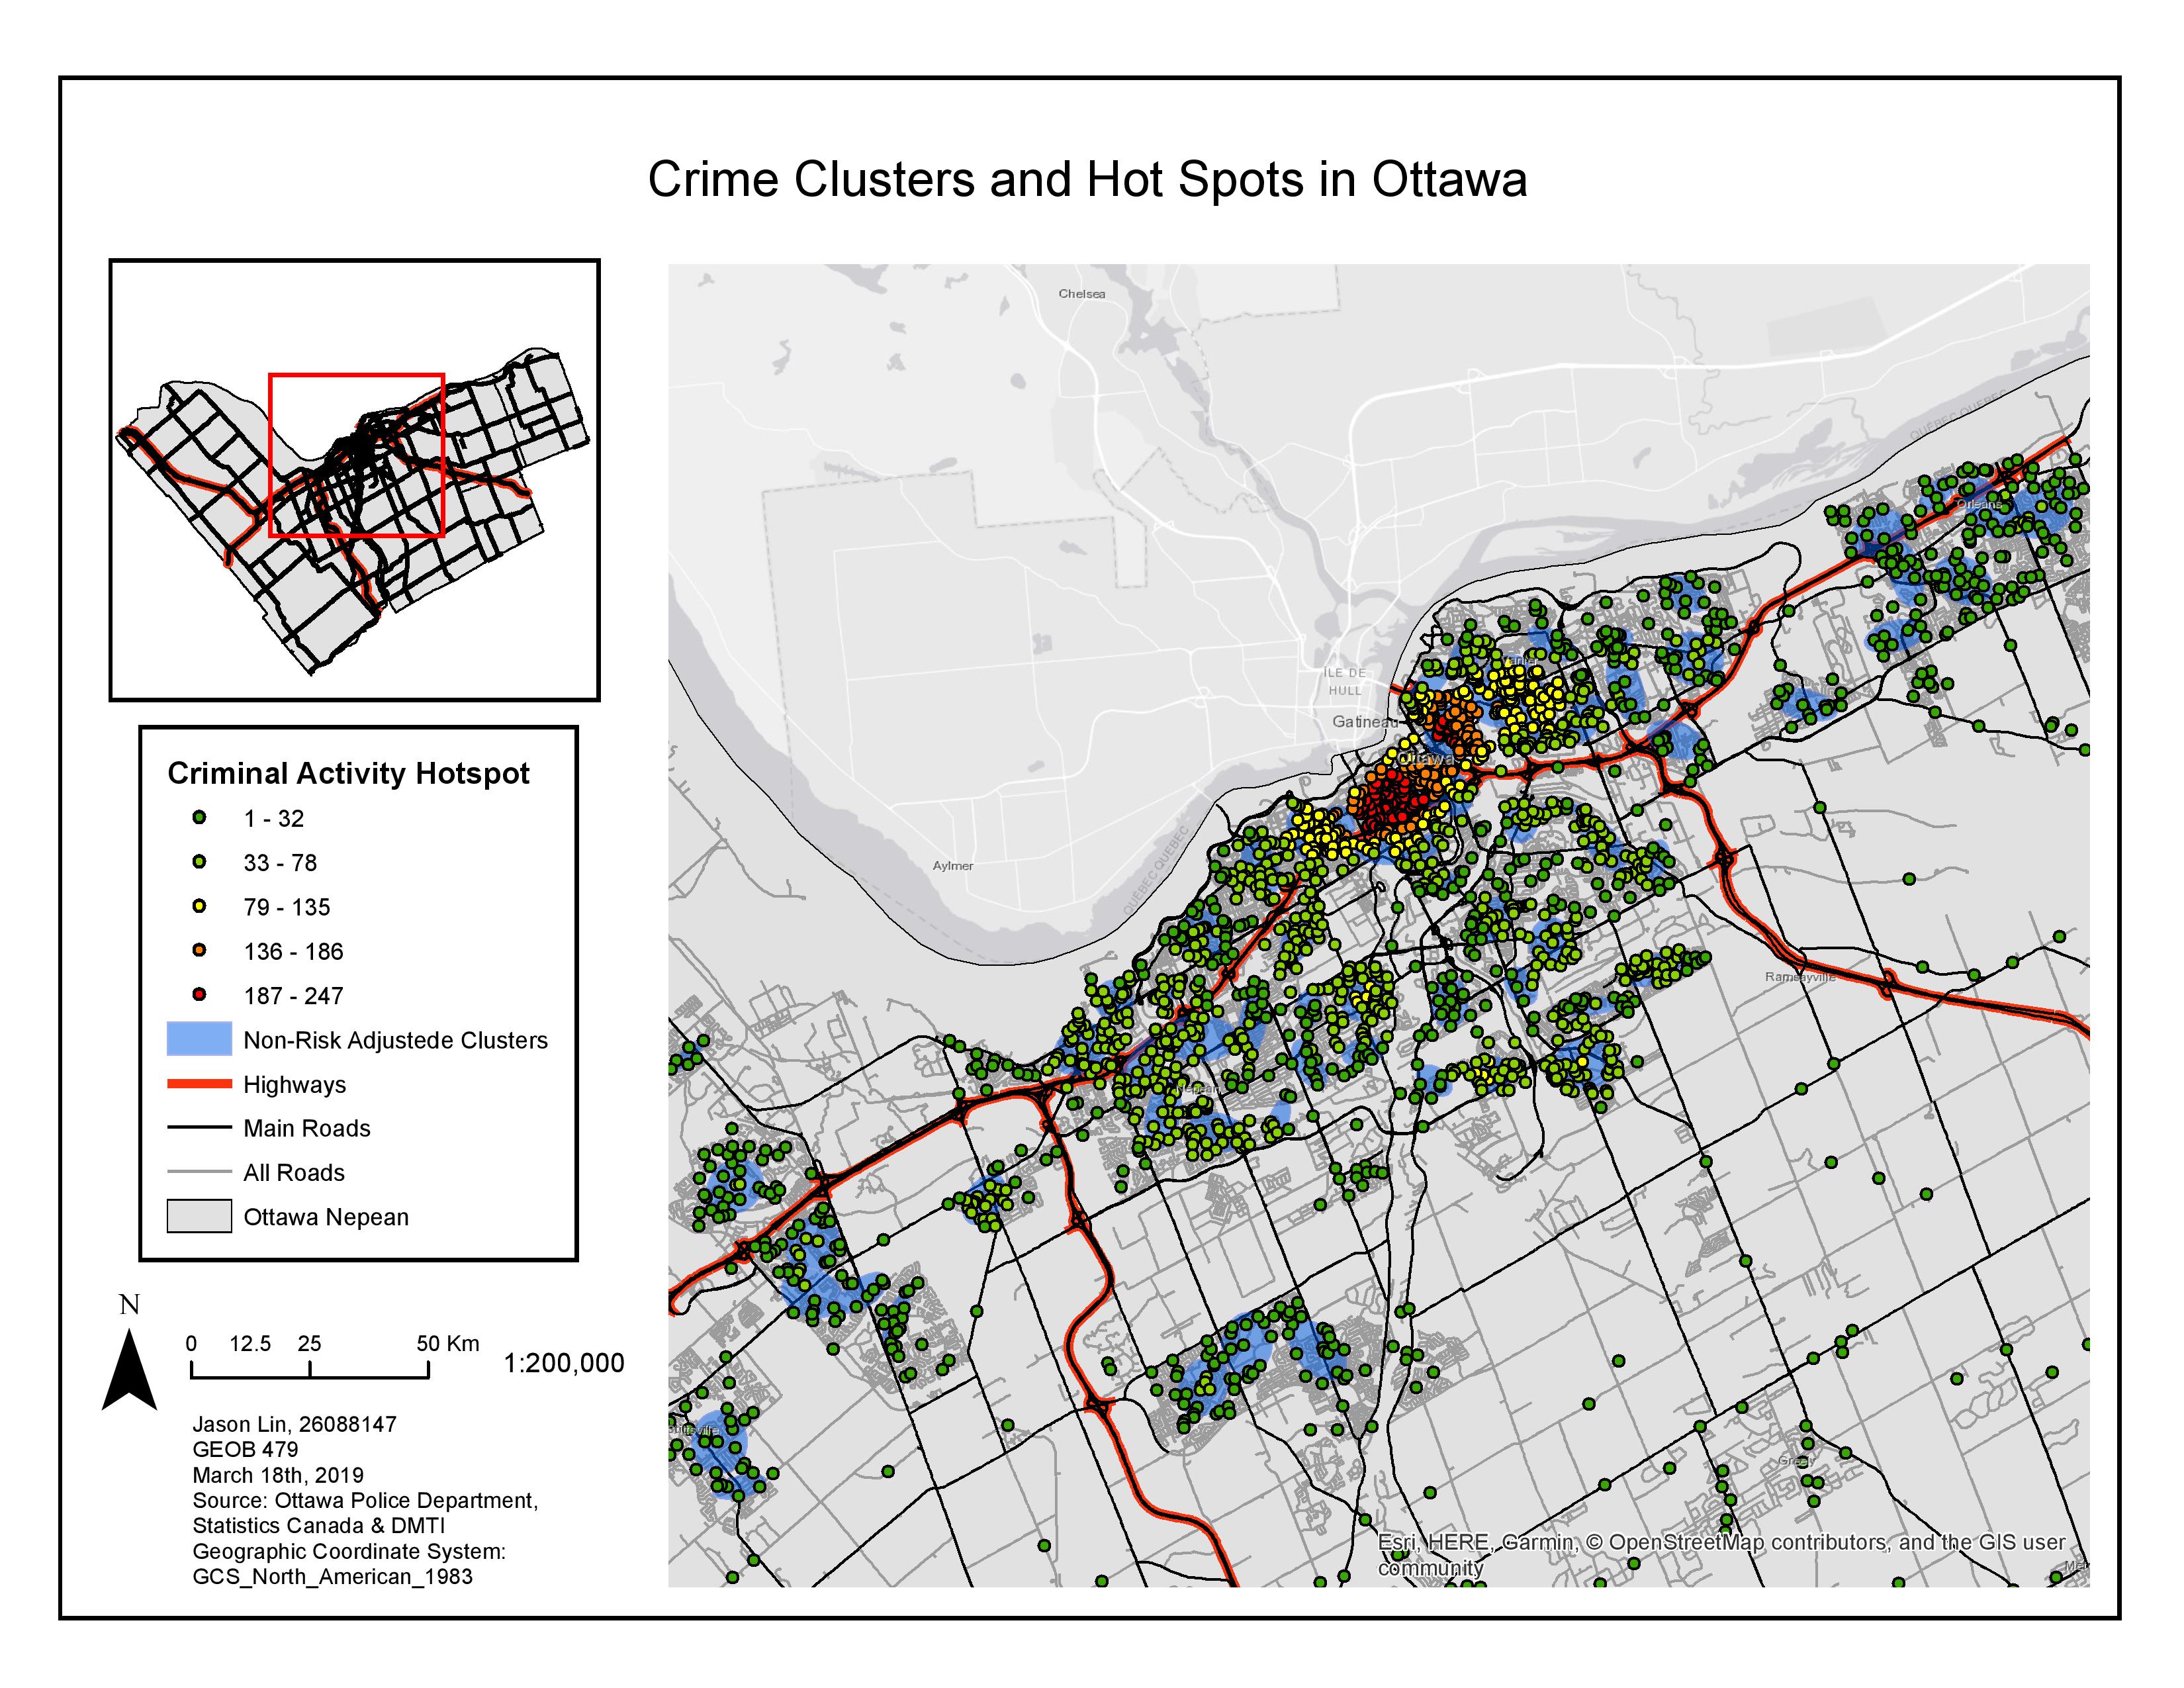
crimes are being committed in Ottawa. The first hot spot analysis used in this lab is the fuzzy mode analysis. These clusters are visually represented by coloured circles on the map below. The colours of the circle represented with a tool which quantifies the number of other crimes within 1000 metres radius. For instance, the red circles represent crime sites where 187 to 247 of crimes are within 1000 metres, orange circles represent crime sites where 136 to 186 of crimes are within 1000 metres, and green circles represent crime sites where 1-78 of crimes are within 1000 metres.
On the other hand, the other method is the nearest neighbour hierarchical clustering analysis. The method identifies hot spot areas instead of circles on the map, therefore, creating zones of blue polygons shown on the map. The polygons portray hot spot areas that contains at least 10 crimes located within a 1000 metre area. When comparing the two hot spot analysis methods, I can visually see similar results produced by the two. In this application, the fuzzy mode analysis is superior where it provides readers with more information about the criminal activity within the area since it is able to provide the intensity (number) of the crime sites.
The nearest neighbour hierarchical spatial clustering method used previously was non-risk adjusted, meaning that the underlying conditions and factors to why these hotspots occurred is unaccounted for. Therefore, this could potentially be problematic because the relative risk to a person from crime within an area is affected by many elements such as population. When the risk adjustment is carry out, clusters of clusters are identified.
For my analysis on car theft I used the knox index, the knox index is used to determine whether there is a spatial and temporal clustering within a given data. I ran the analysis 19 times and I have defined the temporal element as close within 6 hours and distance element as close within 5000 metres. Specifically four numbers for each categories were produced: close in time and space (325473); not close in time and space (759110); and close in time and not close in space (986929); and not close in time and close in space (242964 ). Therefore, from the numbers, I can observe that car thefts tend to be close in time but not close in space, in another word, these crime happens depends on the time of the day rather than the location of the crime.
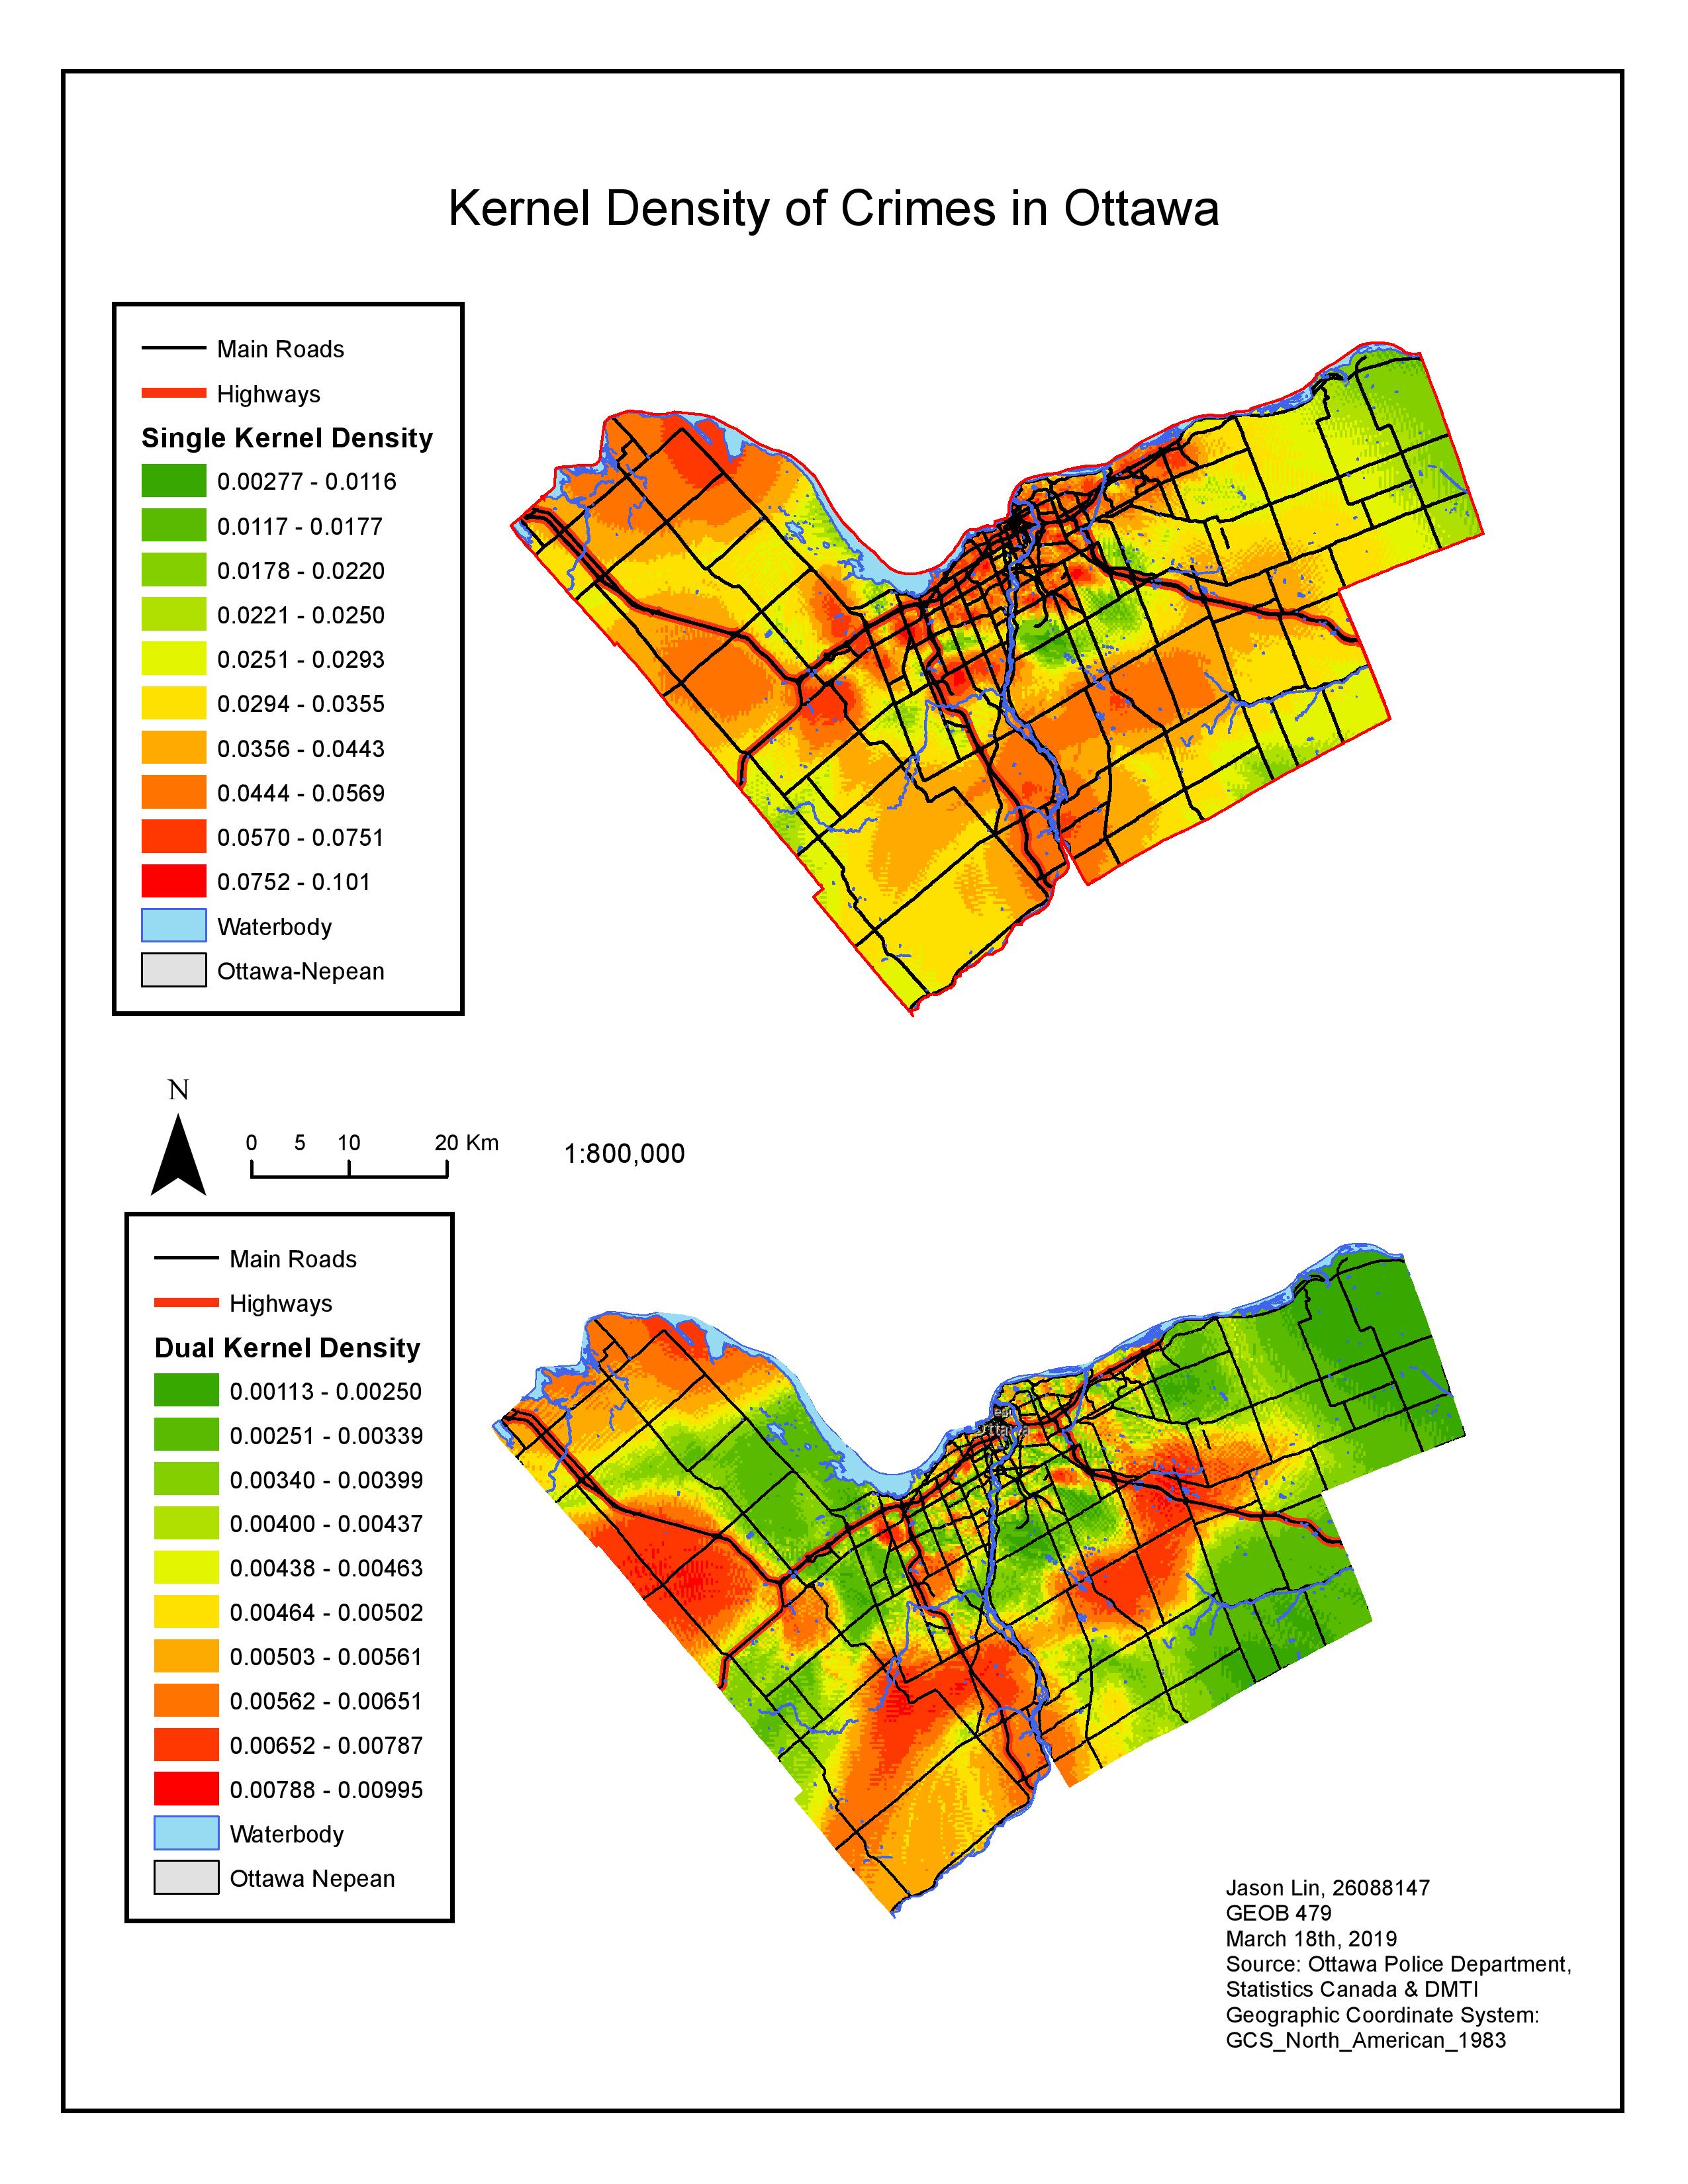
The last map shows the kernel density of the crime cases. Kernel density is a method where it interpolates crime data given to form a smooth surface showing the expected intensity of crimes over the study area. Contrasting with other hot spot analysis such as fuzzy mode and nearest neighbour clustering, kernel density method offers one major advantage, it offers the ability to visualize a broad, regional view of events.


