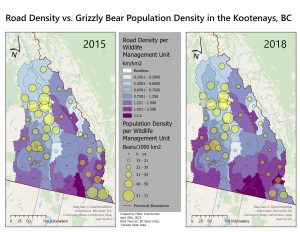
Choosing to showcase bear population density over raw counts allowed for a better direct comparison between wildlife management units. Bear densities less than 10 bears/ 1000km2 are considered at higher risk and require management attention. Additionally, although there are 7 density categories, those above 0.75km/km2 are considered high risk.
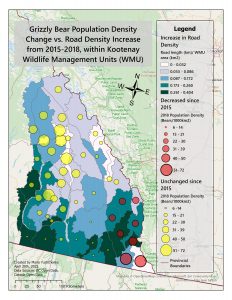
In addition to comparing 2015 and 2018 side by side, the map below combines the data together to show which WMUs had more significant road density increases. It should be noted that roads cannot be removed, therefore all regions experienced higher road densities between 2015-2018. Graduated symbols represent 2018 population densities, with yellow circles representing unchanged densities and red circles indicating a population density decrease. The lower map presents the raw count decrease per WMU between 2015-2018.
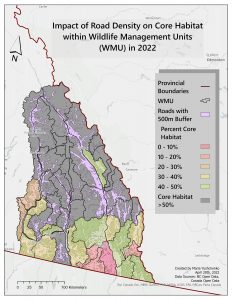
Because 2018 was the most recent population data available, current 2022 roads were used to map fragmented habitat in the Kootenays. Individual habitat areas outside of the 500m road buffer were highlighted as core habitat if they exceeded 10km2. Unsurprisingly, regions with the least remaining core habitat were found along the southern border, such as around Kimberley and Cranbrook, BC. Upon further analysis with 2022 road data, road density did not increase in the area to the same extent it did from 2015-2018. The majority of new roads up to 2022 were seen mid to high latitude Kootenays as resource and service roads, where core habitat remained above 50%.