Data
Table 1: Data sources
| Data | Source |
| 1992 Land Cover | Global Land Cover Characterization from USGS |
| 2016 Land Cover | National Land Cover Database 2016 from the Multi-Resolution Land Characteristics Consortium |
| Chicago Metro Area Boundary | US Census Bureau- Tigerline Metropolitan Statistical Areas |
| Lake Michigan Shapefile | Great Lakes Council |
To constrain the study area I first downloaded a Lake Michigan and Chicago boundary shapefiles. The tigerline metropolitan areas is a statistical area calculated by the US Census Bureau based on the degree of social and economic connectivity of an area to a core city, which in this case is Chicago. Areas within the metropolitan boundary are more closely connected to Chicago than any other city. The tigerline boundary also includes parts of Wisconsin and Indiana that are connected to the Chicago metro area, but were not included in either a Chicago city proper or Illinois counties containing the Chicago metro area.
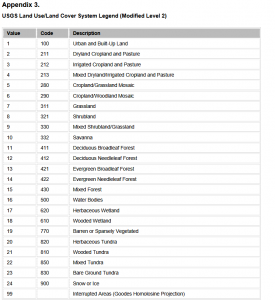
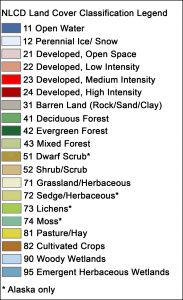
Land cover data was provided by the US Federal Government based on satellite imagery taken from April 1992 to March 1993 for the Global Land Cover Characterization (GLCC) layer and from 2001 to 2016 for the National Land Cover Database (NLCD) layer. The 1992 layer was created provides land cover at a 1km resolution. The 2016 layer provides land cover at a 30m resolution (https://earthexplorer.usgs.gov/) (https://www.mrlc.gov/data). Both data sets used land classifications based on Anderson et al. (1976), however, the land cover classes were not identical (Table 2). Therefore, I reclassified the classes to line up.
Table 2: Land cover legend for 1992 (left) and 2016 (right)
Reclassification
Table 3: Reclassifying GLCC 1992 (left) and NLCD 2016 (right) datasets to the same, simpler system. Alaska only classes were excluded from the NLCD 2016 data.

Both datasets were reclassified based on Table 3 to a simplified version of the NLCD 2016 land classes. The original classification systems included finer details and considered that land cover can be mixed (E.g. mixed forest, mixed shrubland/grassland). However, the two data sets did not have the same detail for every broad land cover class. The 1992 data only included one class for urban land, while the 2016 data included four. Conversely, the 1992 data had four classes for cropland, while the 2016 data only had two. Rather than parse between these details and make arbitrary breaks, I decided to group the data into the most general description of the land cover. The new broad classes were snow, developed, barren, forest, shrub, herbaceous, cropland, and wetland.The changes are shown below in Figures 2.1, 2.2, 3.1, and 3.2.

Figure 2.1: 1992 GLCC land cover before reclassification
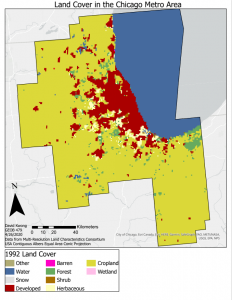
Figure 2.2: 1992 GLCC land cover after reclassification
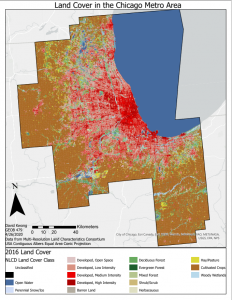
Figure 3.1: 2016 NLCD land cover before reclassification
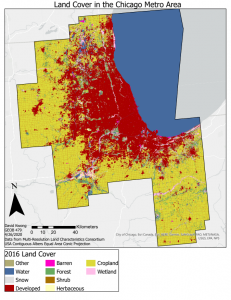
Figure 3.2: 2016 NLCD land cover after reclassification