Transition Matrix
Table 4: Transition matrix showing land cover change from 1992 (first column) to 2016 (first row).
| Barren | Cropland | Developed | Forest | Herbaceous | Shrub | Snow | Water | Wetland | |
| Barren | 33.03% | 0.21% | 0.56% | 0.47% | 5.53% | 58.30% | 0.30% | 1.12% | 0.48% |
| Cropland | 0.20% | 53.13% | 7.64% | 13.97% | 9.99% | 4.89% | 0.00% | 1.82% | 8.36% |
| Developed | 0.30% | 7.64% | 70.43% | 10.70% | 1.97% | 1.84% | 0.00% | 3.81% | 3.30% |
| Forest | 0.42% | 9.89% | 4.71% | 60.56% | 4.66% | 9.55% | 0.01% | 1.07% | 9.12% |
| Herbaceous | 0.27% | 18.77% | 3.85% | 8.95% | 34.14% | 31.24% | 0.00% | 0.92% | 1.87% |
| Shrub | 2.21% | 2.57% | 1.37% | 7.83% | 18.74% | 66.28% | 0.00% | 0.35% | 0.64% |
| Snow | 92.68% | 0.00% | 0.00% | 0.00% | 0.27% | 1.36% | 0.81% | 4.34% | 0.54% |
| Water | 0.80% | 1.31% | 1.67% | 3.76% | 1.02% | 0.94% | 0.00% | 85.26% | 5.24% |
| Wetland | 0.94% | 1.38% | 14.79% | 0.23% | 0.86% | 0.33% | 0.00% | 8.37% | 73.09% |

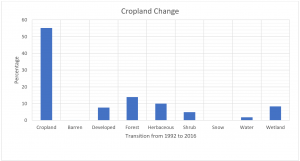
Figure 7: Bar graph showing how cropland changed from 1992 to 2016
The results of the transition matrix confirm that there has been significant cropland loss in Chicago from 1992 to 2016. Only 53.13% of existing cropland in 1992 remained by 2016. Surprisingly, developed land was only the third largest transition for cropland (Figure 7). Forest (13.97%), herbaceous (9.99%) and wetland (8.36%) all contributed more to cropland loss than developed (7.64%) (Table 4).
Urbanization and development are two main processes behind the cropland to developed transition, but the processes behind the cropland to forest, herbaceous, and wetland are less obvious. All three stem from allowing cropland to remain fallow and return to other more ‘natural’ land cover such as trees growing into forest, or grasses taking over. One possible explanation could be economic. Cropland becoming fallow may be because it is no longer profitable to farm the land. Related to this, urban expansion increases land value, which may make farming less profitable on the land (Kim, 2015). In many cases development projects buy up land well before actual construction begins and during the intermediate period the land appears fallow. Another explanation may be that the soil was depleted after continuous farming making the land no longer viable for farming.
While the amount of developed land (70.43%) that remained the same is still higher than for cropland, the value is much lower than I would have expected based on the general pattern of urban expansion in Chicago in the past 30 years (Kuang et al., 2014). Developed land is mainly lost to either forest (10.70%) or cropland (7.64%) (Table 4). These transitions could be explained by the data being derived from satellite imagery. According to Kuang et al. (2014) Chicago experienced significant urbanization and suburbanization from 1976 to 2000 that then slowed down after 2000. As these neighborhoods age the trees may start covering the houses. To a satellite it appears like the land cover has changed from suburban to forest even though the land use has remained the same (Kim, 2015). Taylor and Lovell (2008) found that urban agriculture, personal gardens, and community gardens were relatively common across the Chicago metro area and that their use is increasing over time. This expansion of urban agriculture may explain the transition from developed land to cropland.
The results of the transition matrix largely agree with the maps that developed, forest, and wetland are similar in magnitude for cropland transition, with the exception of herbaceous being significant in the transition matrix but not the maps. The reason for this disagreement is not clear. Perhaps it could simply be related to symbology where the color choice for herbaceous is less noticeable than the other land classes.
Since the transition matrix shows percentages rather than counts it is not useful for comparing land gained between classes. According to Table 4 a larger percentage of wetland (14.79%) was lost to developed than cropland (7.64%), but since there is much more cropland than wetland, the counts for cropland lost is far higher than for wetland lost, which can be seen in Figure 6. Because of this, I rely mainly on the mapping result for urban land gained to determine that urbanization is an important contributor to cropland loss.