According to the World Meteorological Organization, this year is on pace to be the warmest in recorded history. Whether or not 2014 is awarded the gold, silver or bronze in the global warming’s equivalent of the 100 m dash will probably depend on the temperature dataset. The precise placement of any one year on the medal standings is, of course, immaterial to the broader issue of the longer term trend, described beautifully by Eric Roston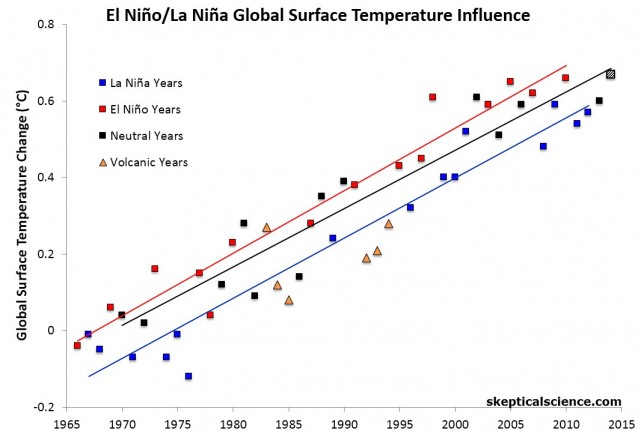 .
.
What is remarkable to many observers is that a record might be set without the help of a “full El Niño”, to use the WMO’s term. In the last few decades, global average surface temperature records have generally been set by a combination of the long-term warming trend and the bump from everyone’s favourite Latin American weather nickname. An increasingly common way to plot global average surface temperatures is with additional labels for El Niño, La Niña and neutral years, as was done in the WMO report and this figure from Skeptical Science. The take-home message – El Niño, La Niña, neutral, it is all warming.
The labeling is the tricky part, for two reasons. First, El Niños normally develop and peak over the “boreal” or northern hemisphere winter, which means they span two calendar years. There’s usually a few months lag between the development of El Niño and the global temperature effect. Thus, for the global temperature analysis purposes, the “El Niño” year is the year after the onset of the event. The best example is the 1997/98 event which helped bump 1998 to a warmest year gold medal.
Second, there’s no one perfect way to classify El Niño events. For example, in the Skeptical Science plot, 2005 is classified as an El Niño year. In a plot in the WMO report, 2005 is classified as a neutral year. These conflicts arise with “weak” El Niño years because different groups use different classification systems. The U.S. agencies NOAA and NASA disagreed as to whether 2004/05 was an El Niño event.
The suggestion that El Niño events be divided into types or flavours may address some of this potential disagreement. The recent paper led by my former student Sandra Banholzer concluded that the global average surface temperature is anomalously warm – statistically-speaking – during the canonical or traditional “Eastern Pacific” El Niño events like 1997/98, but not during “Central Pacific” events or “Mixe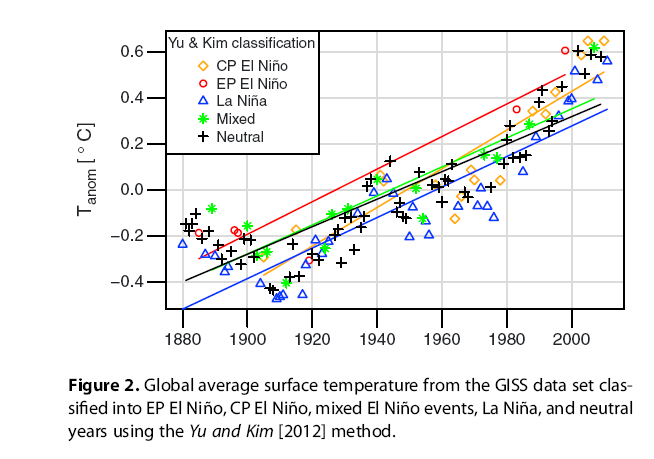 d” events. A more nuanced classification system allows 2004/05 to get status as El Niño-ish, but not a classic El Niño.
There are a variety of ways to perform the classifications and it is safe to say that the scientists involved do not agree on the “best” method. Whatever method is used, the underlying surface warming trend is the same. As is clear from this figure from the recent paper, the warming trend is robust.
NOTE: We will have a poster on this subject at AGU on the afternoon of Wednesday, December 15th, 2014.