
Monitoring coral reefs in Butaritari, Kiribati (2012)
When I first studied ecology, I was struck that so many of the influential research findings came from the same few locations. Often this is because the geographic characteristics or the history of the particular country, island, coastline, or lake makes it ideal for testing a scientific hypothesis (e.g., Barro Colorado Island, which was created by the Panama Canal) or representative of something that is common in other locations (e.g., Experimental Lakes Area in Ontario, a good proxy for northern lakes).
It also a question of logistics. The resources for environmental monitoring – the equipment, the expertise, the money – are not evenly distributed around the world. While scientists do choose field sites based on ‘science,’ we also have to weigh the optimal locations for answering key scientific and societal questions against the infrastructure available and the basic ability to complete research in those locations. No funding agency will support a project unless you can show that it is feasible.
So environmental research and monitoring tend to cluster in places with available resources. Hubs develop. For coral reef research, the hubs include parts of the Great Barrier Reef, the western Indian Ocean, the Galapagos, Hawaii, and the Florida Keys. In choosing to do field projects in the central equatorial Pacific, I am probably tipping that science vs. logistics scale so much towards ‘science’ that it is liable to break, which may explain my growing familiarity with tropical infectious diseases.
This geographic bias in environmental monitoring is essentially the reason behind our work on a new global database of coral bleaching events published in PLoS-One and described in this CBC video:
For as much as bleaching is of interest to scientists, to funders, to divers, and to the public at large, countless bleaching events go unreported or unstudied. The majority of tropical reefs are in developing countries where the capacity for extensive monitoring is limited, either because of the available resources or the remote nature of the reefs.
We tried to fill the gaps by searching the literature and the coral reef science community for reports missing from Reefbase, the existing voluntary database used by scientists, and by spatially interpolating the information that was available. The process produced a database with two components: one is a set of the actual observations, and one is a set of gridded (4 km x 4 km resolution) interpolated maps of the probability that bleaching occurred each year across the world.
The observed database, as described in the paper, has 79% more records than were in Reefbase. The number of reports gives a sense of how coral bleaching has become a more common occurrence in the past few decades. Of the 7429 reports, only 250 occurred before 1990!
 The more comprehensive observed database cannot fill the gaps where no monitoring occurred. There remains a large, unknown area of unobserved past bleaching (possible “Type II errors” or “false negatives”). Th
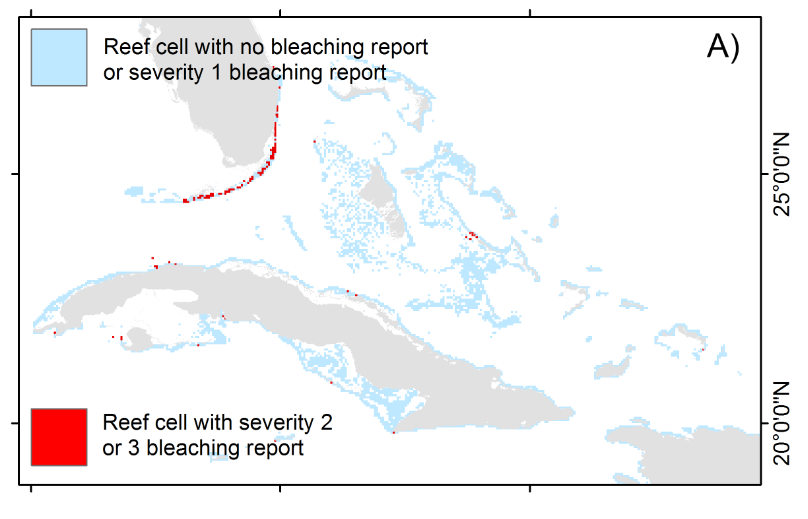
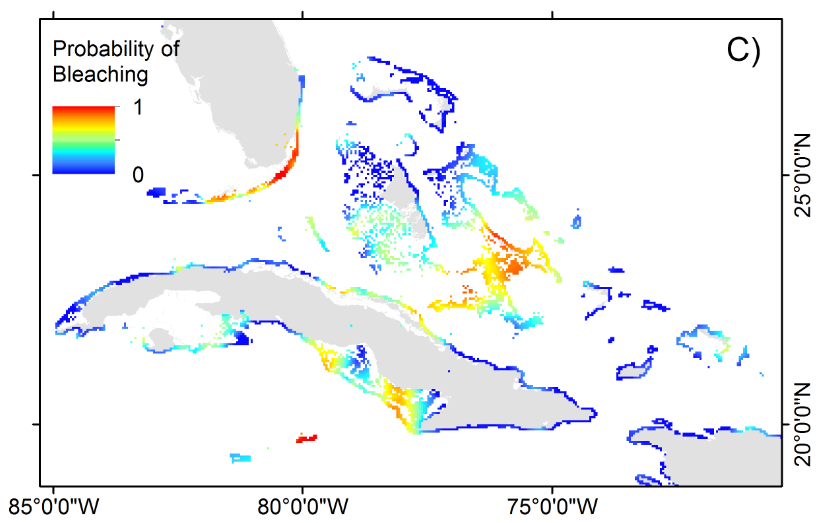 e spatial interpolation was an attempt to fill that gap. At left is an example of the before (top, observations only) and after (bottom, interpolation) from the Caribbean in 2005.
Using the interpolated maps, we found that the area of coral reefs with >50% probability of bleaching was eight times higher in the second half (1999-2010) of the time period studied (1985-2010). We also contrasted the bleaching probabilities with past temperature data and found that the higher the probability of bleaching, the higher the heat stress (measured as “degree-heating-weeks”) that the coral reef experienced. Put this all together, and it is yet more evidence that coral reefs have experienced more frequent and more severe bleaching over the past few decades because of rising ocean temperatures.
This work is only beginning. Version 1 of the database can be downloaded here. We’re also hard at work on version 2, which will include data through the end of 2016. So please share any and all reports of coral bleaching, particularly any older reports that are not described in the existing literature.
Simon
Sorry to be more tardy still in replying-
You might find it useful to take a look at this :
https://www.youtube.com/watch?v=UPnOsCuAO_w&t=16s
and to compare notes with Tom Goreau, who has been following my work since the original publication Climatic Change- google ‘ seitz bright water’ for Harvard’s free pdf link
The two most interesting developments are that mid-day solar energy flux can be rabidly and reversibly reduced by up to 95% ( or a little as you want ) , and that these reductions are attended by multidegree reductions in SST.
I hasten to emphasize that I’m more interested in hectare to square kilometer applications than geoengineering, and that the primary economic focus of this research is fresh water conservation .
Totally off-topic question (sorry!) — I was trying to follow the trail of the “Woody Guthrie Award for a Thinking Blogger” and it ran cold (or else my search skills failed me…) Did you ever pass that on to another blogger? If so, do you remember who or roughly when? Thanks for any tips.
Good question Ned! I realize now I never did pass it on, in part because of done so little blogging the past couple years. Do you have any nominations?
In order to calculate the duration and the plausible economic range and relative positioning difficulty for various shading measures in areas of high and highly threatened biodiversity, coral conservationists may be curious as to your view of the degree to which peak near-surface temperatures, typically in the early afternoon figure in bleaching events. This obviously would impact the degree of mitigation that might be achieveable by various local coral shading measures, either atmospheric or in situ . How much of the culmulative ‘ SST degree-day’ damage occurs at high sun angles?
Sorry to have not responded earlier. To answer, you have to parse out the role of temperature and UV in causing stress to the corals. The temperature corals experience may vary that meaningfully over the day in many reef environments, with the clear exception of shallow reef flats (especially if there’s a big tidal variation). The temperature stress is happening 24 hours a day; NOAA Coral Reef Watch actually uses nighttime-only SSTs for the real-time prediction algorithms (yet the values are similar if you using dday and night-time observations).
On the other hand, the UV input obviously does vary substantially with sun angle. If shading reduces the UV input and the temperature, you could certainly forestall some bleaching. Yet even if shading reduces the UV input and has a negligible effect on temperature, you may still reduce bleaching, as has been suggested from studies showing that cloudiness reduces bleaching extent (i.e. less than expected by the temperature stress).
My concern would be the other effects of deliberate reef shading, e.g. photosynthetic rate of zooxanthallae, etc.